Abstract
Age-related variation in marker frequency can be a confounder in association studies, leading to both false positive and false negative findings and subsequently to inconsistent reproducibility. We have developed a simple method, based on a novel extension of moving average plots (MAP), which allows investigators to inspect the frequency data for hidden age-related variations. MAP uses the standard case-control association data and generates a birds-eye view of the frequency distributions across the age spectrum; a picture in which one can see if, how, and when the marker frequencies in cases differ from that in controls. The marker can be specified as an allele, genotype, haplotype, or environmental factor; and age can be age at onset, age when subject was last known to be unaffected, or duration of exposure. Signature patterns that emerge can help distinguish true disease associations from spurious associations due to age effects, age-varying associations from associations that are uniform across all ages, and associations with risk from associations with age-at-onset. Utility of MAP is illustrated by application to genetic and epidemiological association data for Alzheimer's and Parkinson's disease. MAP is intended as a descriptive method, to complement standard statistical techniques. Although originally developed for age patterns, MAP is equally useful for visualizing any quantitative trait.
Keywords: GWAS, MAPT, SNCA, APOE, coffee
INTRODUCTION
Allele frequency variation as a function of age can be a confounder in association studies, particularly for age-related traits, disorders with variable and late onset, and time-sensitive conditions that involve cumulative exposure over time. Age-related frequency variations may arise from biologically meaningful mechanisms, ascertainment bias or cohort effects. Regardless of the cause, the mere existence of an age effect could be problematic, because if unrecognized, it can lead to both false-positive signals and missing true associations, and as a result, findings may not replicate consistently. We have reported evidence for age-related allele frequency variation in controls, which at times was greater than the differences between cases and controls [Payami et al., 2005]. We showed that age-related fluctuations exist that if undetected could lead to false association signals and failure to replicate. In a recent report, Lasky-su et al. [Lasky-Su et al., 2008] demonstrated age-varying association between body mass index and a common SNP, highlighting age effect as an important cause of non-replications. To demonstrate the age-varying association, Lasky-su and colleagues used data from eight studies comprising more than thirteen thousand individuals. Such rich datasets, however, are not available to most investigators and therefore age effects may go undetected.
Test of association with risk is based on the difference in the average frequency of the marker in patients vs. controls. It is assumed that frequency is constant across the age spectrum, or age is controlled for statistically as a covariate, or studied in interaction with the marker. Association studies do not usually examine frequency distributions as a function of age, and as a result, any information that may be held in such data is untapped. To examine age effects, binning the data in large discreet age categories is an option but not ideal because age is a continuous trait and forcing it into a few discreet categories could mask the underlying variations. Moreover, the arbitrary cut-offs for binning could affect the outcome. Theoretically, the best way to test for age effects is to perform prospective studies; realistically, however, most studies, including genome-wide association studies (GWAS), are being conducted with cross sectional case-control samples. The wealth of data that is being generated and the speed by which GWAS are progressing underscore the need for a simple method that can be applied to existing datasets to explore potential confounding by age.
Age at onset is an important phenotype especially in age-related disorders. For common disorders, whose incidence increases with age, such as prostate cancer, dementia and macular degeneration, the question of “when” may be more relevant than “if”. Increasing numbers of studies are therefore attempting to identify age at onset modifiers. The distinction between risk factors and age at onset modifiers could be biologically significant: risk factors point to the initial cause, whereas onset modifiers implicate the process that begins after the initial insult and leads to the threshold for development of clinical signs. Age at onset modifiers and risk factors can be difficult to distinguish by the commonly used statistical techniques (e.g., logistic regression models, analysis of variance). In fact, associations with age at onset and risk, as measured by standard techniques, could mimic each other, or yield seemingly contradictory results. Here we illustrate that a graphic display of frequency data as a function of age could reveal easily identifiable signature patterns that distinguish age at onset effects vs. risk association vs. age effects unrelated to disease that mimic disease association.
METHOD
The purpose of this study was to develop a simple method that will allow investigators to inspect the marker frequency distribution as a function of age in their case and control populations. We propose using moving average plots (MAPs) to visualize marker frequency distributions as a function of age. Moving averages are used routinely for tracking financial gains and losses over time and for statistical quality control. The method is old and proven, but its extension to the multinomial framework and its application to genetic and epidemiological association studies is novel (see Figures 1-6). The dependent variable may be specified as the frequency of an allele, genotype, haplotype, or environmental factor; and the predictor may be age at onset, age at diagnosis, age when subject was last known to be unaffected, or duration of exposure. We calculate and plot the moving average estimates of marker frequency versus age, with 95% central posterior intervals (CPI), under a multinomial data model. Each point on a MAP corresponds to a group of ages centered at the point, where the group includes this age ± t years. For example, if t=10, the point at age 55 is an average frequency estimate for subjects age 45-65, the point at age 56 is the average estimate for subjects age 46-66, and so on. For association studies, two MAPs are generated, one for cases and one controls, and plotted on the same graph. The result is a picture of the marker frequency distributions across the age spectrum, in which one can see if, how and when marker frequencies in cases differ from that in controls.
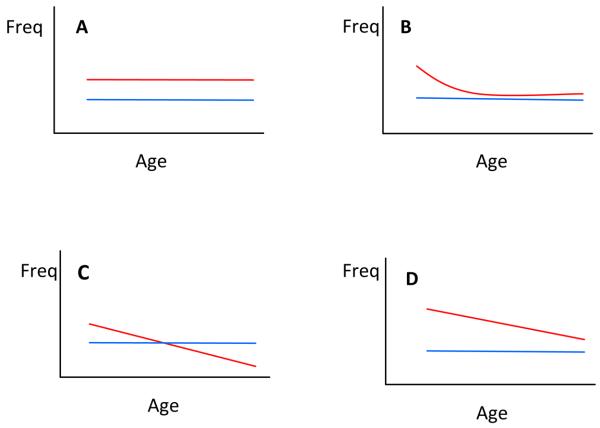
Figure 1. Hypothetical MAP Models of Association with Risk and Age at Onset.
Plots depict marker frequency distribution as a function of age in controls (blue) vs. patients (red). If marker is not associated with disease, the curves for patients and controls would be superimposed (not shown, for an example with real data see Figure 3). Model A depicts a susceptibility allele for which marker frequency is elevated in patients uniformly across all ages. Model B depicts an age-varying association where the marker is associated only with early-onset form of disease. Model C depicts an age at onset modifier, where there is no difference in the overall average marker frequency between patients and controls, but there is a shift in patients showing higher frequencies of the marker in younger onset cases and subsequent depletion of that marker towards later onsets. Model D depicts a marker that is associated with both risk (as evidenced by higher frequency in patients vs. controls) and age at onset (as evidenced by the shift in patients).
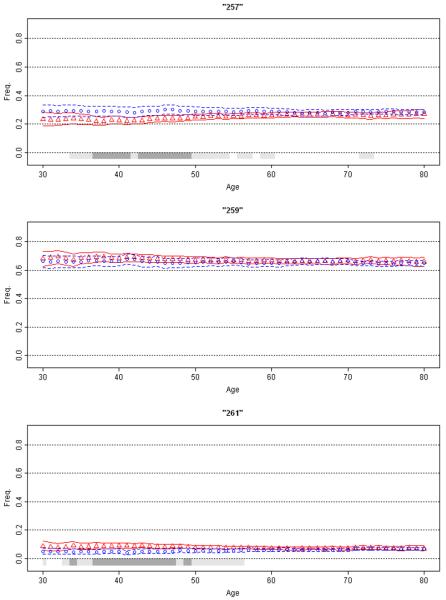
Figure 6. Association of SNCA REP1 with Parkinson's Disease.
Moving average frequency estimates for the three REP1 alleles (257 bp top panel, 259 bp middle, and 261 bp bottom) are plotted against age for controls (blue circles) and age at onset for patients (red triangles), each shown with 95% CPI (grey bar). The extreme low (ages ≤30 yrs.) and high (≥80) ages were collapsed. MAPs suggest inverse association with PD risk with 257 allele, no association with 259 allele, and increased risk of disease with 261 allele (for enlarged figure, see supplemental material). Moreover, the association with this locus appears to be mainly in the 35-50 year range.
Although MAP is intended to be descriptive in nature, it is grounded in a sound probability model for frequency data. Consider the Ni subjects which fall into the age bin (ai−t, ai+t) for age ai and pre-specified width 2*t. The vector of counts (xi1,…,xiJ) of each marker 1,…,J in these subjects is Multinomially distributed with N trials and parameter vector (θi1,…,θiJ), which represents the unknown true marker frequencies. The multinomial distribution is estimated independently for each age ai - the dependence on the age index i is suppressed from here on. Following a Bayesian analysis of this model, a non-informative Dirichlet prior distribution is used on the unknown frequency vector (θ1,…,θJ), which results in a Dirichlet posterior distribution with parameters (1+x1 ,…, 1+xJ) [Bernardo and Smith 2000]. Monte Carlo analysis is used to estimate the posterior distribution. For a large number (G) of posterior samples, a GXJ matrix is generated where each row of the matrix is a single multivariate random sample from the posterior distribution on the frequency vector (θ1,…,θJ). In the results given below G is set to 100,000. The posterior mean on each marker frequency is estimated by averaging its posterior samples. The 95% CPI on each marker frequency is estimated by the 2.5th and 97.5th percentiles of its posterior samples. The analysis is applied independently to each population, and the probability that cases have a higher (or lower) marker frequency than controls is estimated by comparing column-wise the 2 GxJ matrices of posterior samples. For example, to calculate the posterior probability that θ1 in cases is larger than θ1 in controls, the first column of the two matrices are compared by counting the number of times the posterior sample in the cases matrix is larger than the sample in the controls matrix, divided by G. The marker frequency is declared to be significantly higher (or lower) in cases than in controls when this probability is very large, e.g. >95%. Under a two-sided comparison, a significant difference is declared when this probability is either very large or very small, e.g. >97.5% or < 2.5%. Samples from the posterior distribution on the odds ratio (OR) comparing marker 1 vs. 2 and cases vs. controls, can be calculated by
for g=1,…,G, where is the gth posterior sample of the frequency of marker 1 in cases, is the same frequency in controls, and the two other frequencies are defined similarly. The posterior mean and 95% CPI on the OR can be estimated from these G posterior samples.
The conceptual framework for MAP is illustrated in Figure 1 with four hypothetical models. Theoretically, signature patterns that emerge from MAP (Figure 1, Models A-D) can help distinguish true disease associations from spurious associations due to age effects, age-varying associations from associations that are uniform across all ages, and associations with risk from associations with age at onset. To illustrate, we applied MAP, in conjunction with standard statistical methods for assessing risk (χ2 tests, logistic regression) and age at onset (t-test, analysis of variance, Kaplan Meier and log rank statistics) to genetic and epidemiological data on Alzheimer's disease (AD) and Parkinson's disease (PD). Data on 2,135 AD patients were provided by Layton Aging & Alzheimer's Disease Center at Oregon Health and Sciences University [Payami et al., 1993], The University of Washington Alzheimer Disease Research Center [Yu et al., 2007], and the National Cell Repository for Alzheimer's Disease [http://ncrad.iu.edu/]. Genetic and epidemiological data on 2,196 PD patients and 2,360 control subjects were from the NeuroGenetics Research Consortium (NGRC) [Kay et al., 2008; McCulloch et al., 2008; Powers et al., 2008; Zabetian et al., 2007]. The study was approved by the Human Subjects Committees at all participating institutions.
RESULTS
Six examples are used to illustrate utility of MAP. Data on Apolipoprotein E (APOE) in (I) AD and (II) PD illustrate issues related to allelic association with disease risk and age at onset (Figure 2). (III) A case of no association with risk or onset is displayed in Figure 3. (IV) Association of microtubule-associated protein tau (MAPT) H1/H2 haplotypes with PD is an example of a uniform (non-age specific) association with risk (Figure 4). (V) Association of coffee with PD demonstrates application of MAP to non-genetic risk factors with cumulative exposure over time giving false evidence for association with age at onset (Figure 5). (VI) Association of α-synuclein (SNCA) with PD is an example of an age-specific association. The examples of MAPT and SNCA illustrate that MAP can be informative even when effect size is small (OR=1.2-1.4). Collectively, the examples used here illustrate flexibility of MAP in defining the dependent variable (allele, genotype, haplotype, or environmental factor) and the predictor (age at onset, age when subject was last known to be unaffected, or duration of exposure). For genetic markers, we defined age as age at onset for patients and age at blood draw (DNA extraction) for controls. For coffee consumption, we used age at data collection (cumulative exposure) for both patients and controls. Each graph (Figures 2-6) contains a MAP for patients (blue circles with CPI boundaries), a MAP for controls (red triangles with CPI boundaries) and statistical significance (gray bar) calculated in a moving window, comparing patient MAP to control MAP. The gray bar is drawn when marker frequency in cases is significantly different from marker frequency in controls under a two-sided comparison: light gray for at least 95% posterior probability, dark gray for at least 99% probability. Figures 2-6 are set at fixed scales for comparability; enlarged figures are provided as supplemental figures.
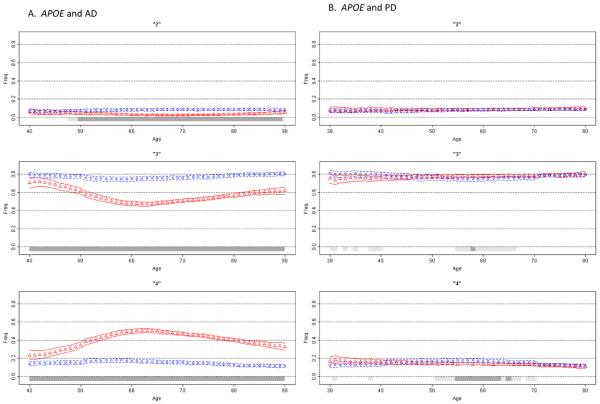
Figure 2. Association of APOE with Alzheimer's Disease and Parkinson's Disease.
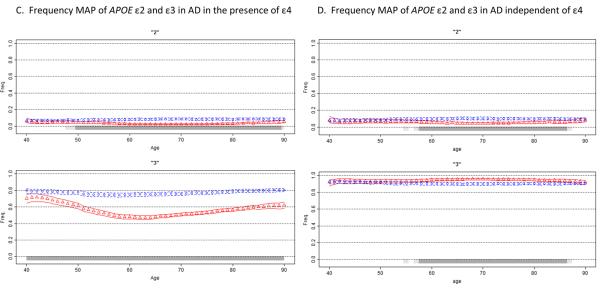
Moving average frequency estimates of the three APOE alleles (ε2 top, ε3 middle, ε4 bottom panel) are plotted against age for controls (blue circles) and age at onset for patients (red triangles), each shown with 95% CPI. Due to few subjects in the extreme low and high ages, tail ends were collapsed (ages ≤30 and ≥80 for PD, ≤40 and ≥90 for AD). A gray bar indicates the allele frequency is significantly different in cases than in controls under a two-sided comparison, not adjusted for multiple comparisons: light gray for at least 95% posterior probability, dark gray for at least 99% probability. Figure 2A shows that ε4 frequency in AD patients begins a sharp rise after age 40, reaches its peak at around age 60, and then starts to decline, while remaining above the control frequency at all ages. For PD (Figure 2B), the effect is dramatically different (for enlarged figure, see the supplemental material). The MAP of ε4 in PD patients is sloped and intersects with control MAP. ε4 is enriched in the youngest patients and depleted in the oldest patients; a pattern suggestive of an age at onset effect. Figures 2C and 2D depict frequency MAPs of ε2 and ε3, before and after the ε4 effect is removed. The plots demonstrate that the reduced frequency of ε2 in AD patients is independent of ε4, but the lower frequency of ε3 in patients is solely due to the increased frequency of ε4 and disappears once the ε4 effect is removed. In the absence of ε4, ε3 frequency in patients is elevated because the frequency of ε2 is decreased.
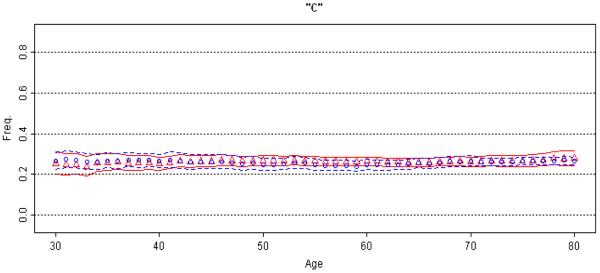
Figure 3. Lack of association between rs682705 and Parkinson's Disease.
Moving average frequency of the “c” allele is plotted against age for controls (blue circles) and age at onset for patients (red triangles), each shown with 95% CPI. This is a bi-allelic SNP; therefore, the MAP of the “t” allele (not shown) is the mirror image of the MAP for “c”. The extreme low (≤30 yrs.) and high (≥80 yrs.) ages were collapsed. Absence of gray bars indicates lack of significant difference between cases and controls at any age.
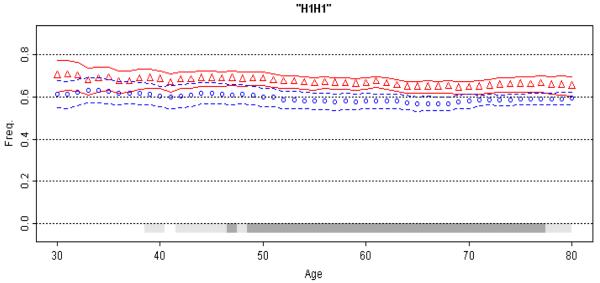
Figure 4. Association of MAPT with Parkinson's Disease.
Moving average frequency of the H1H1 diplotype is plotted against age for controls (blue circles) and age at onset for patients (red triangles), each shown with 95% CPI (grey bars, light gray for at least 95% posterior probability, dark gray for at least 99% probability). The extreme low (≤30 yrs.) and high (≥80 yrs.) ages were collapsed. The MAP for patients is consistently above the MAP for controls, suggestion a uniform association that achieves highest statistical significance in the 50-70 year age spectrum (for enlarged figure, see the supplement).
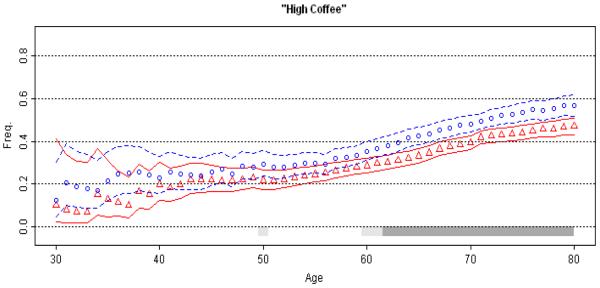
Figure 5. Association of Coffee with Parkinson's Disease.
Moving average estimates of amount of coffee consumed is plotted against age at data collection (patients: red circles, controls: blue triangles), with 95% CPI (grey bar). The extreme low (≤30 yrs.) and high (≥80 yrs.) ages were collapsed. Subjects were classified as high or low coffee consumers if their total lifetime consumption of caffeinated coffee was less or more than the median coffee consumption in controls (the median was 66, which was calculated as the number of caffeinated coffee cups an individual drank per day multiplied by the number of years of consumption). The age scale indirectly reflects cumulative intake of coffee over the years. The upward slopes of MAPs reflect increasing cumulative coffee consumption with advancing age in both cases and controls. Age and age at onset are highly correlated. If one uses cases only to assess marker association with age at onset, one will obtain highly significant, but inaccurate, evidence for association coffee with delayed onset.
(I) APOE and AD
We chose the association of APOE with AD as proof of principle because it is the most robust genetic association [Hirschhorn et al., 2002]. By convention, AD is classified as early-onset or late-onset, with the cut off often placed at age 60 years. APOE has three common alleles: ε2, ε3, ε4. The field has come to the consensus that ε4 is associated with increased risk and earlier onset of late-onset AD (>60 yrs), and that ε2 is protective. Association of ε4 with early-onset AD (<60 yrs), and with very late-onset AD (varied definition of >75, >80 or >90), has been less clear and inconsistent. We analyzed APOE data from 2,135 AD patients and 2,146 controls. The allelic OR for ε4 (reference: ε3) was 4.82 (95% CI=4.24-5.48, p<10−10) for late-onset AD, and 3.12 (95% CI=2.56-3.80, p<10−10) for early-onset AD. Amongst late-onset AD patients, mean age at onset was 2.8 years earlier in ε4-carriers than in patients lacking ε4 (72.3 ± 6.2 vs. 75.1 ± 6.9, p<10−10), which is consistent with the predisposing effect indicated by the elevated OR. Amongst early-onset AD patients, however, mean onset age was 3.5 years later in ε4-carriers than non-ε4-carriers (53.7 ± 6.0 vs. 50.2 ± 7.0, p=10−8), suggesting a protective effect which is counterintuitive to the predisposing effect suggested by the elevated OR. MAP provides a bird's-eye view of the ε4 allele frequency distribution for the full age spectrum (Figure 2A), and seeing the whole picture reconciles the fragmented and seemingly inconsistent evidence. According to MAP (Figure 2A, bottom panel), ε4 frequency in AD patients begins a sharp rise after age 40, reaches its peak at around age 60, and then starts to decline, while remaining above the control frequency at all ages. We observed nearly identical bell shaped curves for ε4 in each of the three AD datasets, and for patients with or without a family history, although the peaks were higher for familial AD. To our knowledge, this is the first time that the association of APOE with AD has been seen in its entirety. Although prior studies had detected the ε4 effect as being maximal around age 60, the fact that MAP can make that very clear in a relatively straightforward graphical display is a demonstration of the utility of this method.
Given that ε4 is believed to be associated with both risk and age at onset of late-onset AD, we expected the MAP to resemble Model D in Figure 1. In fact, if one draws a line at age 60 in the MAP of ε4 with AD and considers the right side of the line, which is late-onset AD, it is a perfect Model D. The left half of the MAP, which corresponds to early-onset AD, explains the seemingly contradictory results of an elevated OR (implying ε4 as a risk factor) and delayed age at onset (implying protection). The rising ε4 frequency from age 40 to 60 leads to enrichment of ε4 with increasing age at onset, which would also reflect as higher average age at onset in ε4-carriers than non-ε4 carriers. The evidence for delayed onset could therefore be an artifact of rising frequency of ε4 between ages of 40 and 60. This is an example demonstrating that a risk factor could masquerade as a protective factor.
In Figure 2A, the general patterns of ε2 and ε3 are similar, in that the frequencies of these alleles are lower in cases than in controls, raising the question of whether ε2 and ε3 are “protective” against AD. Since relative frequencies of all alleles at a locus must add up to 1, a rise in the frequency of one allele will necessarily force the others down; therefore, the reduced frequencies in either or both ε2 and ε3 could be a byproduct of the rise in ε4. To test the effects of ε2 and ε3 independently of ε4, we used the Relative Predispositional Effects (RPE) method [Payami et al., 1989]. Designed for multi-allelic loci, the RPE method helps to identify predisposing and protective alleles, sequentially in the order of the strength of their associations with disease. In the global 3-allele analysis of the present dataset, ε4 was by far the most significant contributor to the difference between cases and controls (overall 3-allele test p<10−10). After removing ε4, and normalizing the ε2 and ε3 frequencies, there was still a significant difference between cases and controls, and this time, the deviation was driven by ε2 (p=10−8). We applied the RPE procedure to MAP. Figures 2C and 2D show the MAPs of ε2 and ε3 before and after ε4 was removed. The frequency of ε2 remained significantly lower in cases than in controls even after ε4 was removed, which suggests the reduced frequency of ε2 is not merely a reflection of the increased frequency of ε4, and is consistent with ε2 being protective. The MAP of ε3, however, was reversed from ε3 being lower in cases than in controls when ε4 was present, to ε3 being higher in cases than in controls when ε4 was absent. MAP is consistent with ε3 being neutral because its fluctuations can be attributed entirely to ε4 and ε2: the dramatically increased frequency of ε4 was responsible for the decreased frequency of ε3, and when ε4 was removed, the decreased frequency of ε2 pushed the frequency of ε3 up. Note that after ε4 is removed, the ε2 and ε3 plots are mirror images of each other, which is expected for all two-allele loci, where an increase in one allele will mirror a decrease in the other. This example demonstrates utility of MAP as a visual aid for distinguishing between protective vs. neutral markers; also demonstrates the flexibility of MAP for application to different methods of analyses.
(II)APOE and PD
AD and PD are both common neurodegenerative disorders with a significant genetic component. Patients with AD have a high risk of developing parkinsonian signs and patients with PD are at increased risk for dementia. Given the overlaps between the two disorders, a genetic link has long been suspected. Soon after the discovery of the association of APOE with AD, numerous studies were published on the association of ε4 with PD, but unlike AD, results were underwhelming and inconsistent [http://www.pdgene.org/]. Like AD, PD is classified into early-onset and late-onset, but the cut-off is usually placed at age 50 years. In our dataset, we found no evidence for association between ε4 and risk of PD (reference: ε3, OR=0.97, 95% CI=0.85-1.09, p=0.60), which is consistent with all published studies combined [http://www.pdgene.org/]. Separate analysis of early- and late-onset PD revealed slightly higher ε4 frequency in early-onset PD than age-matched controls (OR=1.14, 95% CI=0.89-1.47, p=0.30), and slightly lower ε4 frequency in late-onset PD than age-matched controls (OR=0.91, 95% CI 0.79-1.05, p=0.19). Average age at onset was 2.2 years earlier in ε4-carriers than non-ε4-carriers (56.6 ± 12.3 vs. 58.8 ± 12.1, p=0.0002). A modest but significant association between ε4 and age at onset of PD has been noted previously [Pankratz et al., 2006; Zareparsi et al., 2002].
When analyzed with MAP (Figure 2B) the trend is, at best, consistent with Model C in Figure 1, suggesting an age at onset effect. A cursory glance at the MAPs side by side gives an insight into how strikingly dissimilar the ε4 effect is in AD vs. PD, both in pattern and magnitude. The MAP of ε4 and PD is an example that demonstrates how an age at onset effect could lead to inconsistent association findings. The shift in the frequency distribution caused by the age at onset effect leads to enrichment of the allele frequency in early onset cases and depletion in late onset cases. The larger is the effect on age at onset, the steeper the slope in patients. If one is unaware of this picture, and attempts a case-control association study for risk, depending on the age distribution of the subjects, one could find evidence for association with increased risk (if patients have early-onset), decreased risk (late-onset), or no association at all (mixed).
(III) No association
In Figure 3, as a negative control, we show the MAP for rs682705, near PARK10 (a PD-linked locus on 1p32), which was initially implicated as a PD risk factor in an early GWAS [Maraganore et al., 2005] but was subsequently ruled out [Elbaz et al., 2006]. In the present dataset, allelic OR is 1.02 (95% CI=0.91-1.14, p=0.74). MAP shows that the allele frequency distributions are flat (no age effect), and that the curves for patients and controls are superimposed and do not separate at any age (no association).
(IV) MAPT and PD
The H1H1 diplotype of MAPT is a risk factor for PD [Healy et al., 2004; Pankratz et al., 2008; Zabetian et al., 2007]. In the present dataset, we estimated OR=1.38 (95% CI=1.22-1.57, p=6x10⁻⁷) for H1H1 vs. H2H2+H1H2, which is consistent with the literature. There was no significant evidence for an age at onset effect (H1H1: 58.1 ± 12.2 vs H2-carriers: 59.1 ± 11.8, p=0.08). The MAP of H1H1 diplotype shows consistently higher frequency in PD patients than in control subjects (Figure 4 and Model A in Figure 1). The MAP of MAPT illustrates an association that is not age-specific, and has a modest effect size similar to those that have emerged from GWAS for many common disorders.
(V) Coffee and PD
Association of caffeinated coffee consumption with reduced risk of PD is well-established [Hernan et al., 2002; Powers et al., 2008]. Coffee consumption is measured as number of cups a person drinks per day, multiplied by the number of years of consumption. It is therefore cumulative over the lifetime. In our dataset [Powers et al., 2008], as well as published reports [Hernan et al., 2002], the association of PD with coffee is dose-dependent with risk decreasing with increasing consumption. When subjects were divided at the median coffee consumption, heavy-drinkers (above median) had 24%-35% lower PD risk than light-drinkers (unadjusted OR=0.76, 95% CI=0.64-0.91, p=0.002; age adjusted OR=0.72, 95% CI=0.60-0.85, p=0.0002; age, sex and recruitment site adjusted OR=0.65, 95% CI=0.54-0.78, p=4 × 10⁻⁶). In addition to this significant reduction in risk, we found a highly significant 5.7-year delay in age at onset for heavy vs. light coffee drinkers (55.9 ± 11.8 vs. 61.6 ±10.7, p<10−10). However, the average age was also significantly higher in heavy drinkers in both cases and controls; therefore, it was unclear if the age at onset effect was real or an artifact of the age effect.
We plotted MAP once using patients' age at onset and once using their age at questionnaire administration. Age and age at onset were highly correlated in our dataset, thus we only show the curves for age at questionnaire administration for both patients and controls (Figure 5). There are several points of interest: (i) The MAP for patients is consistently lower than the MAP for controls, as would be expected for an inverse association between coffee consumption and PD risk. (ii) The MAPs are not flat; rather they are sloped upward showing increased cumulative coffee consumption with increasing age. (iii) Patient and control MAPs are similarly sloped, run parallel, and do not cross over, which implies a strong age effect, but no age at onset effect. We conclude that the highly significant 5.7-year delay in onset is an artifact of increasing cumulative coffee consumption with age. We found similar results for the inverse association of cigarette smoking with PD risk [Powers et al., 2008], where the age-effect created by increasing cumulative exposure over time mimics an association between smoking and delayed onset of PD (data not shown).
(VI) SNCA REP1 and PD
α-synuclein (SNCA) mutations cause autosomal dominant PD [Polymeropoulos et al., 1996] and polymorphisms in the 5′ and 3′ regions affect risk of non-Mendelian PD [http://www.pdgene.org/; Kay et al., 2008; Pankratz et al., 2008]. Here we use REP1, a dinucleotide repeat polymorphism in the promoter region, for illustration. Association of REP1 with PD was not detected in every study [http://www.pdgene.org/]. It required large sample sizes via a meta-analysis [Maraganore et al., 2006] followed by analysis of the NGRC dataset [Kay et al., 2008] to establish a modest but significant association between allele length and PD risk. Using the RPE method, we showed that the REP1 contains both predisposing and protective alleles [Kay et al., 2008]. Compared to the neutral mid-size allele (denoted here as 259 base pairs), the shorter alleles (≤257 bp) are associated with lower risk (OR=0.86, 95%=0.78-0.95, p=0.003) and the longer alleles (≥261 bp) are associated with higher risk of PD (OR=1.20, 95%=1.01-1.42, p=0.037). Consistent with risk trend, age at onset shows a trend as a function of genotype, increasing incrementally from 54.8 for 261 homozygotes to 59.7 for 257 homozygotes. It is unknown if the association of REP1 with PD is uniform across the age spectrum or is limited to a certain age group. MAPs display two main features (Figure 6): (i) As expected, 257 is more common in controls, 259 is neutral, and 261 is more common in PD. (ii) The association is notable only in younger individuals. Prior studies did not publish individual-level data on age, thus we were unable to readily confirm or refute our observation. If confirmed, this age-specific association could explain the failure to reproduce this association consistently. This analysis demonstrates the utility of MAP as an exploratory, hypothesis generating analysis. A visual inspection will not only reveal the existence of an age-specific association, but it will show specifically the age range that should be targeted in follow up replication studies.
DISCUSSION
We recommend MAP as an adjunct tool to be used in addition to the standard statistical techniques for assessing marker-disease association. MAP is simple, intuitive, and can be applied to both genetic and epidemiological data. MAP is intended as a descriptive method, to complement the more rigorous statistical techniques, which allow for complex interactions and adjustments for covariates. The unique feature of MAP is that it provides a birds-eye view of the frequency distribution across the age spectrum. If there is age-related variation in the frequency of the marker in patients or in controls, the investigator will see them and can test them statistically. MAP can protect the investigator from over interpreting spurious associations that result from hidden age-related variation. If association exists but within only a subset of disease, MAP will show where it begins, where it peaks, and when it wanes.
Although we developed MAP specifically to investigate age patterns in late-onset disorders, the method is equally useful for visualizing disease associations with any quantitative variable. The R package listed in the Web Resources section can generate MAP plots of any qualitative trait versus any quantitative trait in a single or double population setting. It can also generate the odds ratio MAP with posterior bounds as described in the methods section.
Supplementary Material
ACKNOWLEDGEMENTS
Authors would like to thank Drs. Tatiana Foroud, Donald Higgins, Jeffrey Kaye, Patricia Kramer, Eric Molho, John Nutt, and colleagues at NeuroGenetics Research Consortium, Layton Aging & Alzheimer's Disease Center, University of Washington Alzheimer's Disease Research Center, and the National Cell Repository for Alzheimer's Disease for contributing data for analysis. This study was funded by a grant from National Institute for Neurological Disorders and Stroke (R01NS36960 Payami). Data collection was funded by Michael J. Fox Foundation Edmond J. Safra Global Genetics Consortia grant (Payami); National Institute for Neurological Disorders and Stroke (R01-NS36960 Payami, K08-NS044138 Zabetian); VA Merit Award (Zabetian); and National Institute of Aging (P30AG 08017 Kaye, U24AG021886 Foroud, P50AG05136 Schellenberg). The content is solely the responsibility of the authors and does not necessarily represent the official views of the funding agencies.
Footnotes
WEB RESOURCES
The MAP method is publically available at cran.r-project.org in an R package called freqMAP.
REFERENCES
- Bernardo J, Smith A. Bayesian Theory. John Wiley & Sons; Chichester, England: 2000. [Google Scholar]
- Elbaz A, Nelson LM, Payami H, Ioannidis JP, Fiske BK, Annesi G, Carmine Belin A, Factor SA, Ferrarese C, Hadjigeorgiou GM. Lack of replication of thirteen single-nucleotide polymorphisms implicated in Parkinson's disease: a large-scale international study. Lancet Neurol. 2006;5(11):917–23. doi: 10.1016/S1474-4422(06)70579-8. others. [DOI] [PMC free article] [PubMed] [Google Scholar]
- Healy DG, Abou-Sleiman PM, Lees AJ, Casas JP, Quinn N, Bhatia K, Hingorani AD, Wood NW. Tau gene and Parkinson's disease: a case-control study and meta-analysis. J Neurol Neurosurg Psychiatry. 2004;75(7):962–5. doi: 10.1136/jnnp.2003.026203. [DOI] [PMC free article] [PubMed] [Google Scholar]
- Hernan MA, Takkouche B, Caamano-Isorna F, Gestal-Otero JJ. A meta-analysis of coffee drinking, cigarette smoking, and the risk of Parkinson's disease. Ann Neurol. 2002;52(3):276–84. doi: 10.1002/ana.10277. [DOI] [PubMed] [Google Scholar]
- Hirschhorn JN, Lohmueller K, Byrne E, Hirschhorn K. A comprehensive review of genetic association studies. Genet Med. 2002;4(2):45–61. doi: 10.1097/00125817-200203000-00002. [DOI] [PubMed] [Google Scholar]
- http://ncrad.iu.edu/
- http://www.pdgene.org/
- Kay DM, Factor SA, Samii A, Higgins DS, Griffith A, Roberts JW, Leis BC, Nutt JG, Montimurro JS, Keefe RG. Genetic association between alpha-synuclein and idiopathic Parkinson's disease. Am J Med Genet B Neuropsychiatr Genet. 2008;147B(7):1222–30. doi: 10.1002/ajmg.b.30758. others. [DOI] [PubMed] [Google Scholar]
- Lasky-Su J, Lyon HN, Emilsson V, Heid IM, Molony C, Raby BA, Lazarus R, Klanderman B, Soto-Quiros ME, Avila L. On the replication of genetic associations: timing can be everything! Am J Hum Genet. 2008;82(4):849–58. doi: 10.1016/j.ajhg.2008.01.018. others. [DOI] [PMC free article] [PubMed] [Google Scholar]
- Maraganore DM, de Andrade M, Elbaz A, Farrer MJ, Ioannidis JP, Kruger R, Rocca WA, Schneider NK, Lesnick TG, Lincoln SJ. Collaborative analysis of alpha-synuclein gene promoter variability and Parkinson disease. JAMA. 2006;296(6):661–70. doi: 10.1001/jama.296.6.661. others. [DOI] [PubMed] [Google Scholar]
- Maraganore DM, de Andrade M, Lesnick TG, Strain KJ, Farrer MJ, Rocca WA, Pant PV, Frazer KA, Cox DR, Ballinger DG. High-resolution whole-genome association study of Parkinson disease. Am J Hum Genet. 2005;77(5):685–93. doi: 10.1086/496902. [DOI] [PMC free article] [PubMed] [Google Scholar]
- McCulloch CC, Kay DM, Factor SA, Samii A, Nutt JG, Higgins DS, Griffith A, Roberts JW, Leis BC, Montimurro JS. Exploring gene-environment interactions in Parkinson's disease. Hum Genet. 2008;123(3):257–65. doi: 10.1007/s00439-008-0466-z. others. [DOI] [PubMed] [Google Scholar]
- Pankratz N, Byder L, Halter C, Rudolph A, Shults CW, Conneally PM, Foroud T, Nichols WC. Presence of an APOE4 allele results in significantly earlier onset of Parkinson's disease and a higher risk with dementia. Mov Disord. 2006;21(1):45–9. doi: 10.1002/mds.20663. [DOI] [PubMed] [Google Scholar]
- Pankratz N, Wilk J, Latourelle J, Destefano A, Haletr C, Pugh E, Doheny K, Gusella J, Nichols W, Foroud T. Genomewide association study for susceptibility genes contributing to familial Parkinson's disease. Hum Genet. 2008 doi: 10.1007/s00439-008-0582-9. others. [Epub ahead of print] [DOI] [PMC free article] [PubMed] [Google Scholar]
- Payami H, Joe S, Farid NR, Stenszki V, Chan SH, Thomson G. Relative predispositional effects (RPE's) of marker alleles with disease: HLA-DR and autoimmune thyroid disease. Am J Hum Genet. 1989;45:541–546. [PMC free article] [PubMed] [Google Scholar]
- Payami H, Kaye J, Heston LL, Bird TD, Schellenberg GD. Apolipoprotein E genotypes and Alzheimer's disease. Lancet. 1993;342(8873):738. [PubMed] [Google Scholar]
- Payami H, Zhu M, Montimurro J, Keefe R, McCulloch CC, Moses L. One step closer to fixing association studies: evidence for age- and gender-specific allele frequency variations and deviations from Hardy-Weinberg expectations in controls. Hum Genet. 2005;118(3-4):322–30. doi: 10.1007/s00439-005-0057-1. [DOI] [PubMed] [Google Scholar]
- Polymeropoulos MH, Higgins JJ, Golbe LI, Johnson WG, Ide SE, Di lorio G, Sanges G, Stenroos ES, Pho LT, Schaffer AA. Mapping of a gene for Parkinson's disease to chromosome 4q21-q23. Science. 1996;274:1197–1199. doi: 10.1126/science.274.5290.1197. others. [DOI] [PubMed] [Google Scholar]
- Powers K, Kay D, Factor S, Zabetian C, Higgins D, Samii A, Nutt J, Griffith A, Leis B, Roberts J. Combined effects of smoking, coffee and NSAIDs on Parkinson's disease risk. Mov Disord. 2008;23(1):88–95. doi: 10.1002/mds.21782. others. [DOI] [PubMed] [Google Scholar]
- Yu CE, Seltman H, Peskind ER, Galloway N, Zhou PX, Rosenthal E, Wijsman EM, Tsuang DW, Devlin B, Schellenberg GD. Comprehensive analysis of APOE and selected proximate markers for late-onset Alzheimer's disease: patterns of linkage disequilibrium and disease/marker association. Genomics. 2007;89(6):655–65. doi: 10.1016/j.ygeno.2007.02.002. [DOI] [PMC free article] [PubMed] [Google Scholar]
- Zabetian CP, Hutter CM, Factor SA, Nutt JG, Higgins DS, Griffith A, Roberts JW, Leis BC, Kay DM, Yearout D. Association analysis of MAPT H1 haplotype and subhaplotypes in Parkinson's disease. Ann Neurol. 2007;62:137–144. doi: 10.1002/ana.21157. others. [DOI] [PMC free article] [PubMed] [Google Scholar]
- Zareparsi S, Camicioli R, Sexton G, Bird T, Swanson P, Kaye J, Nutt J, Payami H. Age at onset of Parkinson disease and apolipoprotein E genotypes. Am J Med Genet. 2002;107(2):156–61. doi: 10.1002/ajmg.10111. [DOI] [PubMed] [Google Scholar]
Associated Data
This section collects any data citations, data availability statements, or supplementary materials included in this article.


