Abstract
Understanding how mammalian cells function requires a dynamic perspective. However, due to the complexity of signalling networks these non-linear systems can easily elude human intuition. The central aim of systems biology is to improve our understanding of the temporal complexity of cell signalling pathways, using a combination of experimental and computational approaches. Live cell imaging and computational modelling are compatible techniques which allow quantitative analysis of cell signalling pathway dynamics. Non-invasive imaging techniques, based on the use of various luciferases and fluorescent proteins, trace cellular events such as gene expression, protein-protein interactions and protein localisation in cells. By employing a number of markers in a single assay, multiple parameters can be measured simultaneously in the same cell. Following acquisition using specialised microscopy, analysis of multi-parameter time-lapse images facilitates the identification of important qualitative and quantitative relationships – linking intracellular signalling, gene expression and cell fate. Improvements in reporter genes coupled with significant advances in detector technologies, are now allowing us to image gene expression non-invasively in individual living cells. These methods are providing remarkable insights into the dynamics of gene expression during complex processes, such as the cell cycle and the responses of cells to hormones, growth factors and nutrients. On a larger scale, dynamics of gene expression may also be monitored in living organisms. This new technology will greatly assist attempts to decipher the complex behaviours exhibited by biological signalling networks, for instance the ability to integrate multiple input signals over time, and generate specific outputs.
Introduction - Role of single cell imaging in systems biology
The eukaryotic cell receives a multitude of signals from the extra cellular environment which it must interpret and respond to in an appropriate manner. These signals are transmitted within the cell using multiple pathways, which frequently involve protein translocation and the modification of signalling molecules. The resulting change in the activity of target proteins like transcription factors, then modulate the expression of a specific set of genes. Years of research have helped to elucidate individual molecular interactions within many signalling pathways. However, these signalling cascades, often drawn in isolation as static linear pathways, are complex inter-connected signalling networks within cells, built up through integration of multiple pathways. One particular external signal may result in the simultaneous activation of many signalling pathways within the cell. Additionally, because cells are very rarely stimulated by just one isolated signal in vivo, the complexity of cellular signalling networks becomes vast.
Understanding the molecular mechanisms controlling these activities across the whole network requires a simpler way to portray the system complexity. The pathway output of transcription factor activity most likely results in the expression of genes encoding other signalling molecules. The understanding of pathway inputs and outputs becomes extremely complex when the expressed protein can in turn interact with the pathway, establishing non-linear feedback structures within the network. When considering system dynamics, the specific ordering and timing of individual processes become vital to determining the overall behaviour of the integrated signalling system. It is now important to define where and how pathways interact, and to examine the functional effects of these interactions. The non-intuitive nature of non-linear systems is exhibited by a wide range of dynamical properties including bistability, adaptation and oscillations [1]. This requires data from single cells and mathematical approaches to help comprehend their behaviour.
There are many instances in biology where the same activating signal can lead to quite different cellular responses in different cells or in the same cells at different times or under different conditions. This is achieved by specific interactions between signalling molecules, making the cellular environment critical for the correct interpretation of incoming signals. As cell populations are heterogeneous, the ability to acquire spatial and temporal information in a single cell is fundamental, requiring non-invasive methods of measuring cellular processes in the same cell over time. The visualisation of cellular processes in vivo enables the investigation of important biological questions such as understanding the function of genes and gene products, and how they regulate cellular processes through complex signalling networks.
Live cell imaging
Fluorescence imaging and reporter gene technology allow the non-invasive measurement of biological processes in live cells. When coupled with time-lapse imaging, processes can be followed over both spatial and temporal scales. The output presents multi-dimensional quantitative information about the biological assay in question. Conventional microscopy methods have limitations in the dynamic analysis of processes, mainly since cells require chemical fixing and therefore observations are snapshots at single time points in non-physiological conditions, resulting in population-based rather than single cell data[2].
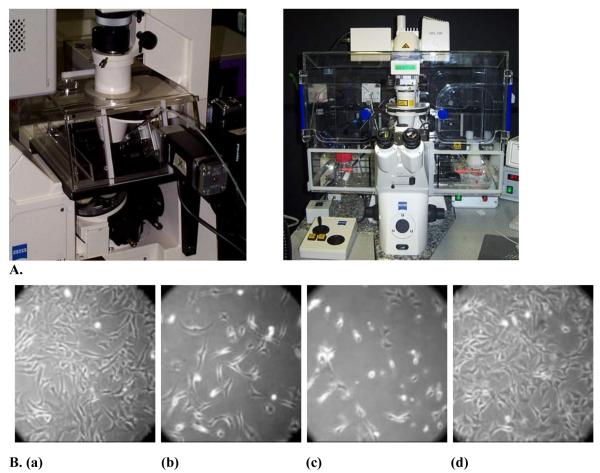
Time lapse fluorescence imaging facilitates the quantitative measurements of the dynamics of cellular processes with both high spatial and temporal resolution, and enables the real-time dynamics of biological processes to be observed. The precise control of environmental factors is essential for the efficient functioning of physiological processes. For example, temperature can considerably affect reaction kinetics. Microscope incubators maintain optimal conditions for cells to survive by closely regulating temperature, C02 concentration and humidity.
In laser scanning confocal microscopy a pinhole aperture enables an optical section of narrow depth to be imaged by only allowing fluorescent light from the focal plane to reach the detectors (whereas a traditional widefield microscope also acquires information from outside the plane of focus) [3]. Wider pinholes enable a thicker slice to be imaged. Lasers are used to excite the fluorophores in a sample at a particular wavelength. The images generated are multi-dimensional, each single timeframe can be composed of multiple optical slices in the z-plane and generally include a transmission image plus an image for each different fluorescence compound used (greater than one for multi-parameter studies) for each time point. Thus, data may be collected in the X.Y.Z planes and at multiple wavelengths over time. There are likely to be many cells per field (20-50 with a 40x magnification objective lens – dependent on cell type), typical data extracted from a single cell in these images includes the cytoplasmic mean fluorescence and nuclear mean fluorescence. Other variables can also be derived from this, for example relative fluorescence in the form of nuclear to cytoplasmic mean fluorescence ratio, which is useful for comparing cytoplasmic to nuclear translocation dynamics between cells with differing absolute levels of fluorescence.
Luminescent reporters and imaging techniques
Reporter gene technologies allow the detection and quantification of gene expression. The promoter region of a gene can be used to regulate the expression of a reporter gene whose activity can be readily quantified, for example the luciferase gene from the firefly Photinus pyralis or the sea pansy Renilla reniformis. Through the addition of the luciferase substrate (luciferin or coelenterazine respectively), light is generated. The number of photons emitted is proportional to the luciferase expression level and the promoter activity can be detected using a highly sensitive low-light CCD (Charged Coupled Device) camera [4].
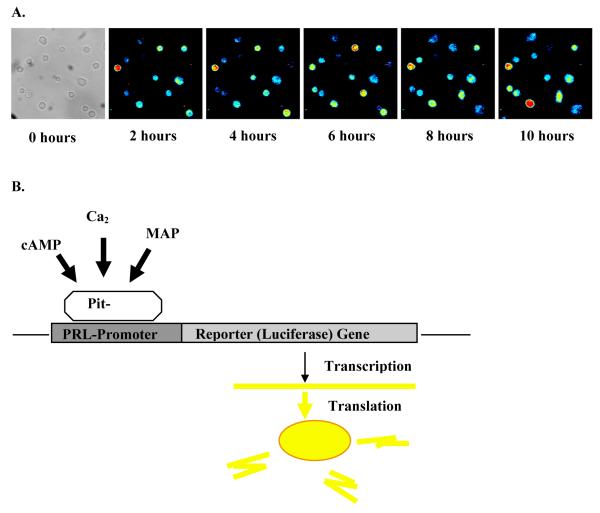
Luminescence imaging is extremely sensitive and enables the detection of promoter activity (figure 2). However, relatively long integration times between of 15-30 minutes are required to observe significant levels of luminescence from individual cells. Relative to changes in gene expression this is less of a problem than would be the case for more dynamic processes such as protein movement.
Figure 2.
Live cell luminescence microscopy. A) Tracking human prolactin transcription over time following stimulation with 5 μM forskolin. Time lapse microscopy images of GH3 cells, transfected with a 13kd human prolactin promoter luciferase reporter construct. B) Diagramatic representation of live cell luminescence microscopy. Activation of prolactin is visualised as light production resulting from the transcription of the reporter (luciferase) gene.
The promoter-luciferase reporter may be introduced into cells in culture by microinjection, transient or stable transfection of cells, or by generation of transgenic animals. Additionally, infection using a viral vector such as an adenovirus [5] has also proven successful. Bioluminescence imaging is a highly sensitive, non-toxic analytical technique that is particularly well suited to long-term, longitudinal studies in cultured cells and living organisms [6]. It has had a notable impact in studies of tumour progression in living mice [7] and circadian rhythmicity at the level of whole organisms [8], explanted tissues and single cells [9].
Fluorescent reporters and imaging techniques
The most common technique for studying and acquiring data on dynamic cellular processes is perhaps live cell fluorescence microscopy [10]. The advent of fluorescent protein markers has enabled the visualisation, tracking and quantification of molecules in living cells. This is achieved using recombinant fluorescent protein technology [11]. DNA encoding the protein of interest and DNA encoding for a fluorescent protein, e.g. Green Fluorescent Protein (GFP), originally isolated from the jellyfish Aequorea victoria [12], are inserted into a plasmid expression vector (circular DNA) which is then introduced into cells by transfection or microinjection. The expression of this vector within the host cell consequently results in the synthesis of the fluorescently tagged protein of interest. On activation of the pathway, the resulting behaviour of the fusion protein can be tracked over time, and the dynamics of this molecule at particular time points can be compared with respect to the mode of activation of the pathway.
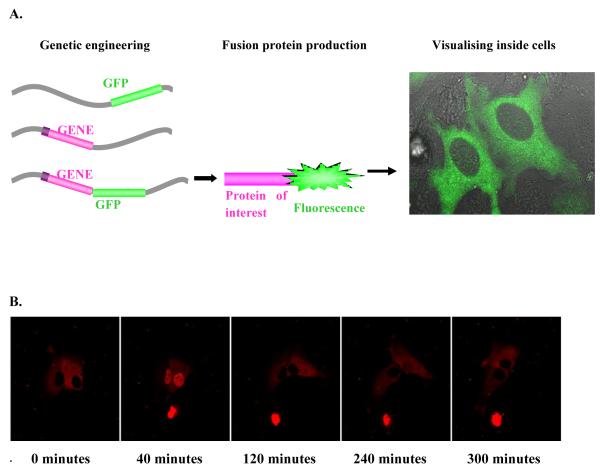
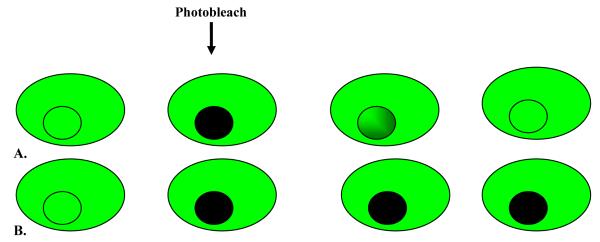
Using a fluorescent protein (FP) as a protein tag has the advantage that it allows the study of the dynamics of a protein’s localisation (figure 3). It can also be used to study the dynamic compartmentalisation of the GFP-tagged protein within cells by fluorescence recovery after photobleaching (FRAP) [13]
Figure 3.
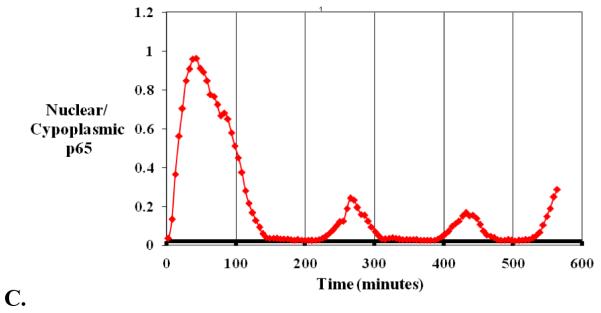
Live cell fluorescence confocal microscopy. A) Diagramatic version of fusion protein formation. Integrating the fluorescence gene next to the gene of interest in the chosen cell, formation of a fusion protein and visualisation of the protein of interest by the attached fluorescent tag using a microscope. B) Time lapse confocal fluorescence microscopic images of SK-N-AS neuroblastoma cells transfected with a p65-dsred xp expression vector following TNFα stimulation. C) Quantification of protein translocation as nuclear/cytoplasmic fluorescence from the same cell.
Fluorescence imaging requires a finite time for fluorophore maturation following its synthesis [4]. However, fluorescence detection requires only very short integration times of the order of milliseconds to seconds per frame. This enables the measurement of highly dynamic processes since time intervals between images can be fractions of a second. The limitations are dependent on the capabilities of the microscopy system, for example the sensitivity of the detectors used for acquiring individual images and the number of variables measured.
A potential disadvantage of using any FP as a reporter protein is that it may be critical to which end of the protein it is fused. For instance, N-terminal tagging may inactivate signal sequences and C-terminal tagging may affect C-terminal localisation signals and interfere with the localisation of those proteins which rely on the proper targeting of their transcripts [14]. Simpson et al. [15] proposed a strategy to include both N- and C-terminal FP fusions to largely circumvent the danger of missing or misinterpreting entire classes of proteins due to misplacement of the FP tag and any aberrant effects that the FP may have had on targeting signals of the protein.
Several key properties of fluorescent proteins include their solubility, folding rate and spectral properties (e.g., quantum yield, extinction coefficient, absorption and emission spectra). For GFP, the gene has been altered by mutagenesis to produce a range of novel fluorophores such as EGFP, EYFP and ECFP [16-18]. More recently, various GFP homologues have been identified in the Anthozoan reef corals [19]. Examples include AmCyan, ZsYellow, DsRed and HcRed. As with GFP, the cDNA sequence for each of these proteins has been codon-optimised and mutated to produce a further set of fluorescent proteins with different spectral characteristics and/or other enhancements.
Fluorescence imaging is non-invasive if longer wavelength and lower intensity excitation is used. However, transient expression of fluorescent fusion proteins may result in higher than normal levels of a particular protein, and this may have an unexpected aberrant affect on the function of the fluorescent fusion protein or on the overall dynamic behaviour of the endogenous system. Control experiments including biochemical analysis of both endogenous and exogenously expressed proteins are important to identify any changes in behaviour. The generation of a stable cell line, in which the fusion protein is integrated into the genome and stably expressed, can result in relatively lower and defined levels of fluorescent fusion protein gene expression [3]. With transient transfection, the number of plasmid DNA expression vectors taken up by each individual cell cannot be controlled, therefore cells within a single experiment may have a wide range of expression levels depending on the plasmid copy number per cell.
Advanced imaging techniques using fluorescent proteins
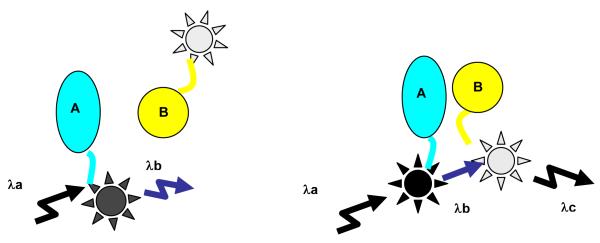
A number of different fluorescent proteins can be used in the same assay to investigate controlled relationships between variables, including co-localisation studies and protein-protein interactions – which can be analysed by a technique called Förster (sometimes also called fluorescence) resonance energy transfer (FRET)(figure 4). One advantage of transient transfection is the ability to observe a range of expression levels between individual cells; in addition, varying expression levels of multiple fluorescent fusions can provide an insight into the relative concentration dependence on the functioning of the proteins of interest. In vitro fluorescent microscopy enables the quantitative analysis of biochemical signalling pathways (and networks), since dynamic imaging techniques can measure molecular biophysical properties and the dynamics of cell processes. There are a number of techniques such as fluorescence recovery after photobleaching (FRAP) (figure 5) which can provide quantitative measurements of molecular mobility from which a diffusion coefficient can be calculated. Fluorescence Correlation Spectroscopy (FCS) can also measure molecular movement across a small defined volume by using a focused laser (single molecule detection, however the data may not be strictly representative of individual molecules due to artefacts) [2]. The availability of these parameters can help develop better and more accurate dynamic models of the system. The integration of the quantitative data extracted through image analysis allows complex relationships to be identified. Imaging techniques such as FRAP, inverse-FRAP (i-FRAP) and fluorescence loss in photobleaching (FLIP) can provide insights into the kinetics and translocations of subsets of proteins of interest, and their accessibility to different cellular compartments [20]. This provides information on the overall mobility of molecules and allows for the detection of sequential translocation of factors from one compartment to another [21]. More recently, fibred confocal fluorescence microscopy (FCFM) has been used to image in situ gene expression using EGFP in cells of living animals [22].
Figure 4.
Diagrammatic representation of FRET. FRET describes an energy transfer mechanism between two chromophores. A donor chromophore in its excited state can transfer energy to an acceptor chromophore in close proximity (typically <10 nm). For monitoring the complex formation between two molecules, one of them is labeled with a donor and the other with an acceptor, and these fluorophore-labeled molecules are mixed. When they are dissociated, the donor emission is detected upon the donor excitation. On the other hand, when the donor and acceptor are closer (<10 nm), the acceptor takes the energy from the donor and emit photons of different color.
Figure 5.
Diagrammatic representation of FRAP. A fluophore (eg, GFP) is covalently attached to the molecule of interest. The fluorescently tagged molecules are visualised using a microscope and photobleached. Now there is a black area filled with photobleached molecules surrounded by fluorescently tagged molecules that have not been photobleached. If these molecules are able to diffuse, this will cause the fluorescent area to become a little less bright, and the blackened area will gradually increase in brightness as fluorescent molecules migrate into this area. A) GFP tagged molecules from outside the marked area moving in after photobleaching of selected area. B) No movement of GFP tagged molecules into selected region after initial photobleach.
The growing complexity of signalling networks is such that a multi-disciplinary effort is required. As the properties of complex systems become non-intuitive, biologists, systems biologists and mathematicians are now beginning to work together to try to make sense of it all [1, 23-25]. An ideal example of the study of how complex behaviour might result from the combinatorial function of multiple network motifs is the Nuclear Factor kappa B (NF-κB) pathway.
NF-κB signalling pathway
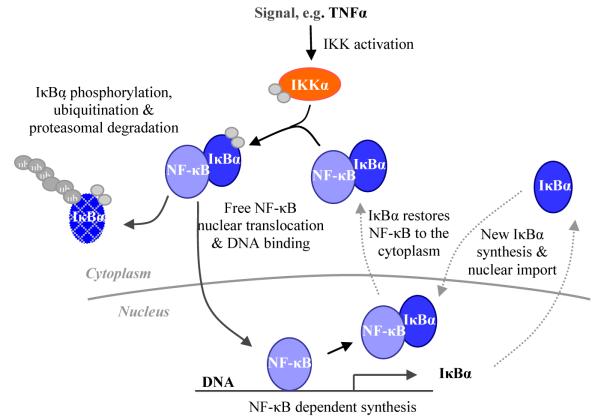
NF-κB is a well studied family of inducible dimeric transcription factors which differentially regulate cell fate (apoptosis, cell division, differentiation). NF-κB modulates the activity of ~300 different genes. In common with many other signalling (and metabolic) pathways it is activated via a variety of cell surface receptor-mediated pathways. NF-κB signalling is highly regulated in both space and time, where the two properties are intricately linked and essential for understanding NF-κB function. The delicate balance maintained in both the resting and activated system, through various protein-protein interactions, transport mechanisms and protein modification, reveal the complexity inherent within this system. NF-κB dimers are sequestered in the cytoplasm of unstimulated cells by binding to Inhibitor kappa B (IκB) proteins which block NF-κB nuclear translocation. A wide range of stimuli activate the Inhibitor kappa B Kinase (IKK) signalosome, which phosphorylates IκB (at Ser32 and Ser36 on IκBα) and NF-κB proteins (e.g. at Ser536 in RelA). Phosphorylation of IκB proteins leads to their ubiquitination and proteasomal degradation, liberating free NF-κB dimers which translocate to the nucleus and regulate target gene transcription. The recently observed oscillations in NF-κB localisation [26] and DNA-binding bring a novel view to the dynamic (self-) regulation of this system, which may be an essential property required to initiate appropriate patterns of gene expression. IκBα is a transcriptional target of NF-κB, and it creates a delayed negative feedback loop leading to oscillations in the system (figure 6), similar to those of the circadian clock and other ultradian oscillators such as p53 [27].We have used iterative real-time single cell imaging and mathematical modelling to show that the NF-κB system is oscillatory and uses delayed negative feedback to direct nuclear to cytoplasmic cycling of transcription factor(s) that regulate gene expression.
Figure 6.
Simplified diagrammatic representation of the NF-κB pathway. A signal (e.g. TNFα) activates IKK which phosphorylates IκBα, resulting in its phosphorylation and degradation. This releases active NF-κB to translocate to the nucleus and regulate target genes including IκBα. New IκBα forms a negative feedback loop which restores NF-κB to the cytoplasm.
We have seen that (i) only live single-cell measurements can allow visualisation of these properties, as averaging cells that are out of phase can mask oscillations, and (ii) the oscillations can be characterised in terms of their amplitude, as well as their timing and their frequency. We have suggested that the frequency or maintenance of oscillations may be responsible for determining the downstream events. Experimental and theoretical analyses suggest that modulations within the NF-κB pathway differentially affect the amplitude, timing and frequency of the oscillations.
Conclusions
Timelapse single cell imaging facilitates the quantitative measurements of the dynamics of cellular processes with both high spatial and temporal resolution. The number of signalling reactions investigated in a single assay will continue to increase, as new fluorophores and dyes are developed, incorporating as many as possible to allow parallel investigation [28]. These result in high-throughput, high-content screening assays. The main problem inherent in this scale-up of data acquisition is the ability to derive biological information and understanding. The problem is not only due to the vast quantity of multi-parameter data, but because of the multi-dimensional complexity integrated therein. As new and improved microscopy techniques arise, large amounts of time lapse imaging data are being produced. One current aim is to automate analysis of intracellular protein localisation and dynamics. This will require novel computing techniques; initially to extract this data from images (via time-series image analysis) [29-31], then integrate this quantitative information (by computational modelling), thereby building a quantitative view of cellular processes.
Dynamic experiments have the ability to reveal new and useful information about inherently complex biological control systems. However, understanding how this information fits together and how perturbations affect system dynamics can be a complex task, especially when considering the regulatory mechanisms of observed oscillatory phenomena which can behave in non-intuitive ways. Here, mathematical models will be required, due to the large number of molecules and feedback processes necessary to generate oscillatory behaviour [32]. The NF-κB signalling system exemplifies some of the complexities faced. The development of computational models, addressing all or part of cell signalling systems, can provide biologists with the ability to reintegrate the data to look at signalling pathways in a holistic manner without having to sacrifice molecular details [33]. Understanding the dynamics and context of the information known within classical static networks are major challenges for current biology, therefore single cell imaging and data analysis, and complementary computational modelling, is becoming a vital tool for biological research. Model testing in parallel with experiments will allow iterative refinement of models, and help to constrain uncertain parameters. However, some of the most interesting cases occur when the model can no longer fit the data irrespective of the set of parameter values. This means new hypotheses about the system need to be defined. In the case where the model is consistent with experimental data, subsequent model analysis techniques enable quantitative hypothesis testing in a controlled manner (and are economical in both cost and time). Within a laboratory environment an iterative cycle of modelling and experiments can assist in new knowledge discovery and productive experimental design.
Summary.
Fluorescence imaging and reporter gene technology allow the non-invasive measurement of biological processes in individual live cells over time.
Timelapse single cell imaging facilitates the observation and recording of the cellular processes with both high spatial and temporal resolution.
Live cell imaging enables the real-time dynamics of biological processes to be observed.
Single cell imaging, analysis and complementary computational modelling are vital tools in quantitative biological research.
Figure 1.
A) Two examples of incubators attached to microscopes for maintaining the temperature at 37° C and CO2 concentration at 5 %. B) The effect of temperature on Swiss 3T3 cells in culture: (a) Grown in a conventional incubator at 37°C, for 72 hours, or on a microscope at actual temperatures of (b) 35°C (c) 39°C or (d) 37°C.
Acknowledgements
We thank Claire Harper, Dave Spiller and David Turner for providing pictures and biological images. DM is supported by an MRC clinical research training fellowship. CH is a post doctoral research associate at the Centre for Cell Imaging. CDW is an associate researcher at the Universidad Nacional Autónoma de México. MRHW is Professor of Cell Imaging at the University of Liverpool.
References
- 1.Tyson JJ, Chen KC, Novak B. Sniffers, buzzers, toggles and blinkers: dynamics of regulatory and signaling pathways in the cell. Curr Opin Cell Biol. 2003;15(2):221–31. doi: 10.1016/s0955-0674(03)00017-6. [DOI] [PubMed] [Google Scholar]
- 2.Phair RD, Misteli T. Kinetic modelling approaches to in vivo imaging. Nat Rev Mol Cell Biol. 2001;2(12):898–907. doi: 10.1038/35103000. [DOI] [PubMed] [Google Scholar]
- 3.Goldman RD, Spector DL, editors. Live Cell Imaging: A laboratory manual. Cold Spring Harbour Laboratory Press; 2005. [Google Scholar]
- 4.Rutter GA, et al. Real-time imaging of gene expression in single living cells. Chem Biol. 1998;5(11):R285–90. doi: 10.1016/s1074-5521(98)90287-3. [DOI] [PubMed] [Google Scholar]
- 5.Stirland JA, et al. Real-time imaging of gene promoter activity using an adenoviral reporter construct demonstrates transcriptional dynamics in normal anterior pituitary cells. J Endocrinol. 2003;178(1):61–9. doi: 10.1677/joe.0.1780061. [DOI] [PubMed] [Google Scholar]
- 6.Welsh DK, Kay SA. Bioluminescence imaging in living organisms. Curr Opin Biotechnol. 2005;16(1):73–8. doi: 10.1016/j.copbio.2004.12.006. [DOI] [PubMed] [Google Scholar]
- 7.Choy G, Choyke P, Libutti SK. Current advances in molecular imaging: noninvasive in vivo bioluminescent and fluorescent optical imaging in cancer research. Mol Imaging. 2003;2(4):303–12. doi: 10.1162/15353500200303142. [DOI] [PubMed] [Google Scholar]
- 8.Veleri S, Wulbeck C. Unique self-sustaining circadian oscillators within the brain of Drosophila melanogaster. Chronobiol Int. 2004;21(3):329–42. doi: 10.1081/cbi-120038597. [DOI] [PubMed] [Google Scholar]
- 9.Yamaguchi S, et al. Synchronization of cellular clocks in the suprachiasmatic nucleus. Science. 2003;302(5649):1408–12. doi: 10.1126/science.1089287. [DOI] [PubMed] [Google Scholar]
- 10.Stephens DJ, Allan VJ. Light microscopy techniques for live cell imaging. Science. 2003;300(5616):82–6. doi: 10.1126/science.1082160. [DOI] [PubMed] [Google Scholar]
- 11.Chalfie M, et al. Green fluorescent protein as a marker for gene expression. Science. 1994;263(5148):802–5. doi: 10.1126/science.8303295. [DOI] [PubMed] [Google Scholar]
- 12.Shimomura O, Johnson FH, Saiga Y. Extraction, purification and properties of aequorin, a bioluminescent protein from the luminous hydromedusan, Aequorea. J Cell Comp Physiol. 1962;59:223–39. doi: 10.1002/jcp.1030590302. [DOI] [PubMed] [Google Scholar]
- 13.White J, Stelzer E. Photobleaching GFP reveals protein dynamics inside live cells. Trends Cell Biol. 1999;9(2):61–5. doi: 10.1016/s0962-8924(98)01433-0. [DOI] [PubMed] [Google Scholar]
- 14.Kislauskis EH, Singer RH. Determinants of mRNA localization. Curr Opin Cell Biol. 1992;4(6):975–8. doi: 10.1016/0955-0674(92)90128-y. [DOI] [PubMed] [Google Scholar]
- 15.Simpson JC, et al. Systematic subcellular localization of novel proteins identified by large-scale cDNA sequencing. EMBO Rep. 2000;1(3):287–92. doi: 10.1093/embo-reports/kvd058. [DOI] [PMC free article] [PubMed] [Google Scholar]
- 16.Heim R, Prasher DC, Tsien RY. Wavelength mutations and posttranslational autoxidation of green fluorescent protein. Proc Natl Acad Sci U S A. 1994;91(26):12501–4. doi: 10.1073/pnas.91.26.12501. [DOI] [PMC free article] [PubMed] [Google Scholar]
- 17.Heim R, Tsien RY. Engineering green fluorescent protein for improved brightness, longer wavelengths and fluorescence resonance energy transfer. Curr Biol. 1996;6(2):178–82. doi: 10.1016/s0960-9822(02)00450-5. [DOI] [PubMed] [Google Scholar]
- 18.Tsien RY. Breeding molecules to spy on cells. Harvey Lect. 2003;99:77–93. [PubMed] [Google Scholar]
- 19.Matz MV, et al. Fluorescent proteins from nonbioluminescent Anthozoa species. Nat Biotechnol. 1999;17(10):969–73. doi: 10.1038/13657. [DOI] [PubMed] [Google Scholar]
- 20.Shav-Tal Y, Singer RH, Darzacq X. Imaging gene expression in single living cells. Nat Rev Mol Cell Biol. 2004;5(10):855–61. doi: 10.1038/nrm1494. [DOI] [PMC free article] [PubMed] [Google Scholar]
- 21.Lippincott-Schwartz J, Snapp E, Kenworthy A. Studying protein dynamics in living cells. Nat Rev Mol Cell Biol. 2001;2(6):444–56. doi: 10.1038/35073068. [DOI] [PubMed] [Google Scholar]
- 22.Al-Gubory KH, Houdebine LM. In vivo imaging of green fluorescent protein-expressing cells in transgenic animals using fibred confocal fluorescence microscopy. Eur J Cell Biol. 2006;85(8):837–45. doi: 10.1016/j.ejcb.2006.03.007. [DOI] [PubMed] [Google Scholar]
- 23.Monk NA. Unravelling Nature’s networks. Biochem Soc Trans. 2003;31(Pt 6):1457–61. doi: 10.1042/bst0311457. [DOI] [PubMed] [Google Scholar]
- 24.Bouwmeester T, et al. A physical and functional map of the human TNF-alpha/NF-kappa B signal transduction pathway. Nat Cell Biol. 2004;6(2):97–105. doi: 10.1038/ncb1086. [DOI] [PubMed] [Google Scholar]
- 25.Barabasi AL, Oltvai ZN. Network biology: understanding the cell’s functional organization. Nat Rev Genet. 2004;5(2):101–13. doi: 10.1038/nrg1272. [DOI] [PubMed] [Google Scholar]
- 26.Nelson DE, et al. Oscillations in NF-kappaB signaling control the dynamics of gene expression. Science. 2004;306(5696):704–8. doi: 10.1126/science.1099962. [DOI] [PubMed] [Google Scholar]
- 27.Lahav G, et al. Dynamics of the p53-Mdm2 feedback loop in individual cells. Nat Genet. 2004;36(2):147–50. doi: 10.1038/ng1293. [DOI] [PubMed] [Google Scholar]
- 28.Weijer CJ. Visualizing signals moving in cells. Science. 2003;300(5616):96–100. doi: 10.1126/science.1082830. [DOI] [PubMed] [Google Scholar]
- 29.Shen HL, et al. Automatic tracking of biological cells and compartments using particle filters and active contours. Chemometrics and Intelligent Laboratory Systems. 2006;82(1-2):276–282. [Google Scholar]
- 30.Shen HL, et al. Automated tracking of gene expression in individual cells and cell compartments. J. R. Soc. Interface. 2006;3:787–794. doi: 10.1098/rsif.2006.0137. [DOI] [PMC free article] [PubMed] [Google Scholar]
- 31.Tvarusko W, et al. Time-resolved analysis and visualization of dynamic processes in living cells. Proc Natl Acad Sci U S A. 1999;96(14):7950–5. doi: 10.1073/pnas.96.14.7950. [DOI] [PMC free article] [PubMed] [Google Scholar]
- 32.Goldbeter A. Computational approaches to cellular rhythms. Nature. 2002;420(6912):238–45. doi: 10.1038/nature01259. [DOI] [PubMed] [Google Scholar]
- 33.Mellman I, Misteli T. Computational cell biology. The Journal of Cell Biology. 2003;161(3):463–464. doi: 10.1083/jcb.200303202. [DOI] [PMC free article] [PubMed] [Google Scholar]


