

Abstract
Hypothalamic histaminergic tuberomammillary (TM) neurons express nicotinic acetylcholine receptors (nAChRs) with kinetic and pharmacological properties resembling those of highly Ca2+ permeable α7 nAChRs. However, the Ca2+ permeability of TM nAChR channels has not been determined. To directly evaluate the Ca2+ permeability of TM nAChRs, patch-clamp recordings were conducted using non-cultured acutely dissociated TM neurons and external solutions containing low (2 mM) and high (20 mM) concentrations of Ca2+. A shift in the reversal potentials was determined from the current–voltage relationships and the permeability ratio, PCa/PNa, was estimated within the Goldman-Hodgkin-Katz constant field approximation. TM nAChRs were found to be highly Ca2+ permeable with the permeability ratio, PCa/PNa(nAChR) being ∼5.9 and the fractional Ca2+ current, Pf(nAChR) being ∼10.1% at −60 mV. As a positive control for the applied methods and analysis, the permeability ratio, PCa/PNa(NMDAR) being ∼8.3 and the fractional Ca2+ current, Pf(NMDAR) being ∼13.6% at −60 mV for NMDA receptors were determined using non-cultured acutely dissociated hippocampal pyramidal neurons and found similar to previously reported values. Therefore, these results demonstrate that native TM nAChRs are highly Ca2+ permeable, but ∼1.4 fold less permeable to Ca2+ than native hippocampal pyramidal NMDA receptors.
Keywords: alpha7, nAChR, hypothalamic, permeability, calcium
Introduction
Nicotinic acetylcholine receptors (nAChRs) are cation-selective channel complexes. The highest permeability ratio of Ca2+ over Na+ (PCa/PNa) is attributed to homomeric α7 nAChRs [1–8]. The high Ca2+ permeability of α7 nAChRs suggests important roles for these receptors in modulation of neurotransmitter release, gene expression, neuroprotection, and neurotoxicity [9–11].
Neurons of the tuberomammillary (TM) nucleus of the posterior hypothalamus express high densities of nAChRs whose kinetic and pharmacological properties are similar to those of homomeric α7 nAChRs [12–14]. In addition, pharmacological studies have indicated the lack of expression of functional non-α7 nAChRs in the TM [12,13,15]. Therefore, TM nAChRs have been used as an effective model of native α7-containing (i.e. α7*) nAChRs. Previous experiments utilizing fluorescent Ca2+ imaging techniques combined with patch-clamp electrophysiological recordings have shown that a direct influx of Ca2+ through somatic TM nAChRs was insufficient for elevation of cytosolic Ca2+ concentrations ([Ca2+]i) to detectable levels (∼14 nM) when high-threshold voltage-activated Ca2+ channels (HVAC) were blocked by 200 µM Cd2+ [16]. These observations suggested that TM α7-like nAChRs may not be highly permeable to Ca2+.
In this study, patch-clamp electrophysiological recordings were conducted to directly estimate the Ca2+ permeability of TM nAChRs using non-cultured acutely dissociated TM neurons and the Goldman-Hodgkin-Katz (GHK) constant field approximation. The reversal potentials of TM nAChR-mediated currents in artificial cerebral-spinal fluid (ACSF) with high and low [Ca2+]o (HACSF and LACSF, respectively) were measured to determine the permeability ratio, PCa/PNa(nAChR), and to estimate the fractional Ca2+ current, Pf(nAChR), of native TM nAChRs. As a positive control for applied methods and analysis, the Ca2+ permeability of NMDA receptors (NMDARs) was determined and found similar to the values reported elsewhere. In these experiments, non-cultured acutely dissociated hippocampal CA1 pyramidal neurons were used and the same experimental approach, tissue preparation, solutions, and analysis were applied as those used for the estimation of TM nAChR Ca2+ permeability. NMDARs have been shown to be highly permeable to Ca2+ [1,17–21] with the permeability ratio, PCa/PNa(NMDAR), estimated to range between 3.6 (hippocampal brain slices; [19]) and 14.3 (hippocampal cultured neurons; [21]). The wide discrepancy in values may reflect differences in NMDAR subunits expressed in different tissues [22] and errors in estimates of ionic activities and liquid junction potentials.
Materials and Methods
Animals
Young adult Sprague–Dawley rats (P22-30) were used in experiments. Animal care was in accordance with the Guide for the Care and Use of Laboratory Animals (NIH 865-23, Bethesda, USA) and was approved by the Animal Care and Use Committee at Southern Illinois University School of Medicine.
Dissociation of neurons from brain slices
The tissue preparation was similar to that described previously [12,13]. In brief, three or four coronal whole-brain slices of 280 µm thickness, containing both the hippocampus and the hypothalamic tuberomammillary nuclei, were cut in a sucrose-rich solution containing 250 mM sucrose, 3 mM KCl, 1.23 mM NaH2PO4, 5 mM MgCl2, 0.5 mM CaCl2, 26 mM NaHCO3, 10 mM glucose, pH 7.4, when bubbled with carbogen (95% O2+5% CO2) at 3°C using Vibratom-1000+ (Vibratom, St. Louis, USA). Slices were maintained for 30 min at room temperature in an oxygenated ACSF consisting of 125 mM NaCl, 3 mM KCl, 1.23 mM NaH2PO4, 1 mM MgCl2, 2 mM CaCl2, 26 mM NaHCO3, 10 mM glucose, pH 7.4. Slices were then transferred into 40 ml beaker containing 25 ml of ACSF constantly bubbled with carbogen and 0.4 mg/ml papain in crude form (Sigma-Aldrich, St. Louis, USA) was added to the beaker without stirring. After 35–40 min of treatment with papain, slices were transferred back into the storage chamber and maintained at room temperature for up to 10 h bubbled with carbogen. TM and hippocampal CA1 neurons were manually dissociated from slices using polished recording pipettes. Completely or partially dissociated cells were located visually through a Nikon TMS microscope.
Electrophysiology
The permeability to Ca2+ of nAChRs and NMDARs in acutely dissociated TM and hippocampal CA1 pyramidal neurons, respectively, were determined using the same pool of coronal whole-brain slices and identical experimental techniques, solutions, and analysis, because large parts of the hippocampus and the hypothalamic TM nuclei lay within the same coronal plane. For patch-clamp experiments, slices were transferred into the recording chamber filled with LACSF (ACSF containing 2 mM Ca2+) and individual neurons were dissociated mechanically using polished patch electrodes [23,24]. Recordings from dissociated neurons were made using a MultiClamp-700B amplifier equipped with Digidata-1400 A/D converter. Data were sampled at 20 kHz, filtered at 1 kHz and 2 kHz for NMDAR- and nAChR-mediated responses, respectively, and stored on a personal computer for analysis. Patch pipettes were pulled using a Sutter P-97 horizontal puller (Sutter Instruments, Novato, USA) and tips were polished using Narishige microforge MF-9 (Narishige International USA, Inc, East Meadow, USA. The final tip diameter was ∼1–2 µm, corresponding to a resistance of ∼0.9–1.5 MΩ when pipettes were filled with the internal solution. After formation of a stable gigaseal (>2 GΩ), the whole-cell voltage-clamp configuration was established. The mean input resistance, access resistance and neuronal capacitance were routinely measured before recordings using Clampex-10 software tools and were found to be: 468 ± 191 MΩ; 2.5 ± 1.9 MΩ, and 29.5 ± 5.4 pF, respectively, for TM neurons (n = 7) and 223 ± 84 MΩ; 2.4 ± 0.9 MΩ, and 22.9 ± 9.1 pF, respectively, for hippocampal CA1 neurons (n = 5).
Agonist administration
Choline, a low potency selective agonist of α7 nAChRs (EC50 being 0.5–1.6 mM) [25–28], was dissolved either in LACSF or HACSF and rapidly (<400 ms) delivered to selected neurons via a picospritzer (Parker Hannifin Instrumentation, Cleveland, USA). Acutely dissociated TM neurons were perfused with the corresponding bath solutions (i.e. LACSF or HACSF) at a rate of 1 ml/min using a 2232 Microperpex S peristaltic pump (LK.B, Upsalla, Sweden). In the initial series of experiments, the application pipettes (8–20 MΩ when filled with the intracellular solution) were filled with various concentrations of choline (5–40 mM) and NMDA (100–200 µM) to determine the minimal amount of choline/NMDA in the application pipette necessary to evoke stable detectable responses. In these experiments, due to diffusion, the effective concentrations of choline/NMDA near the recorded acutely dissociated neurons were expected to be considerably lower than the original concentration of drugs in the application pipette. These tests indicated that only a small fraction of the applied concentrations were reaching the recorded neuron during applications. For example, during brief applications of drugs via a picospritzer in brain slices, the dilution factor had been evaluated elsewhere to be 30 fold resulting in the effective concentration as low as 3% of the original concentration in the application pipette [29]. In this study, when the application pipette was filled with 30–40 mM choline, responses of TM α7* nAChRs were stable and readily detectable; however, the effective concentration of choline near the recorded neurons was not known and was likely variable from experiment to experiment. Nevertheless, the effective concentrations of choline near the acutely dissociated recorded neurons were very stable from application to application in each given experiment evidenced by stable responses. This assurance of stability was adequate for building current–voltage relationships necessary for determining permeability ratios. Similarly, when 200 µM NMDA plus 20 µM glycine were used, stable NMDAR-mediated responses were obtained in experiments with hippocampal neurons. In experiments with NMDA, 20 µM glycine was always present in ACSF.
To eliminate the inward rectification of current–voltage relationships of α7* nAChR-mediated currents reported previously [12,30,31], the Mg2+-free internal solution contained 90 mM F−, a powerful chelator of Mg2+. I–V relationships were built for LACSF and HACSF and fit with the second-order polynomial function, y = ax2 + bx + c. Polynomial fit provides a greater precision of the fit if the I–V curve slightly deviates from a line and yet, does not reduce the precision of the fit if the I–V curve is a straight line. The parameters a, b, c were determined from the fit and reversal potentials (i.e. solutions of the equation, ax2 + bx + c = 0) were found numerically using Mathematica software package (Wolfram Inc., Boston, USA).
Solutions
In the initial set of experiments, Cs+-based extracellular solutions were used. Recordings in Cs+-based solutions were found to be relatively unstable and short lived and therefore, all final experiments were conducted using Na+-based solutions (Table 1). The osmolarities of LACSF, HACSF and internal solutions were 320, 330, and 310 mOsm/kg, respectively. Junction potentials for LACSF and HACSF were determined using the JPCalc software (http://web.med.unsw.edu.au/phbsoft/) from Dr Peter H. Barry (The University of New South Wales). The reference electrode was filled with LACSF containing 6% agar. Junction potentials were 6.7 and 8.6 mV for LACSF and HACSF, respectively, and were subtracted from reversal potentials during analysis.
Table 1.
External and internal solutions used in experiments
| Solution | Component (mM) |
||||||||
|---|---|---|---|---|---|---|---|---|---|
| Na+ | Ca2+ | Cl− | OH− | HEPES− | Cs+ | F− | Sucrose | ||
| External | LACSF | 155.95 | 2 | 154 | 5.95 | 4.05a | – | – | 54 |
| HACSF | 156 | 20 | 190 | 6 | 4a | – | – | – | |
| Internal | – | – | 90 | 3.5 | 6.5a | 183.5 | 90 | – | |
aThe total concentration of HEPES added to solutions was 10 mM. These values are estimates of HEPES concentrations after balancing the pH to 7.38 by NaOH and CsOH for external and internal solutions, respectively.
The GHK equation
To calculate the permeability ratios of Ca2+ over Na+ (PCa/PNa) for TM nACh and CA1 NMDA receptors, reversal potential (Vrev) of TM nAChR- and CA1 NMDAR-mediated responses were estimated from current–voltage relationships. Responses of TM nAChR to choline (an endogenous selective agonist of α7 nAChRs) and hippocampal CA1 NMDARs to NMDA (a selective NMDAR agonist) plus glycine (an allosteric modulator of NMDAR activity) were obtained in voltage-clamp patch-clamp experiments using acutely dissociated TM and hippocampal CA1 pyramidal neurons, respectively. Two external solutions were used containing low (2 mM) or high (20 mM) Ca2+ (see ‘Materials and Methods’). TM nAChRs and CA1 NMDARs were assumed to be cation-selective ion channels totally impermeable to HEPES, sucrose, Cl−, and F− [1]. The ionic flux (Ji) of the ith cation was defined within the GHK approximation [32,33]:
 |
1 |
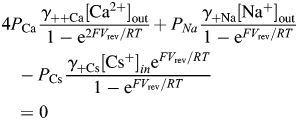
where, Pi, is the channel permeability for the ith cation; [ai]out and [ai]in, activities of the ith cation outside and inside of the cell, respectively; V (mV), the membrane voltage, which at equilibrium becomes reversal potential, Vrev; R = 8.31 J·K−1·mol−1, the gas constant; T = 298 K, the absolute temperature; RT/F = 25.58 mV−1, Ii = ziFJi, the current component generated by the ith cation; Ji, the flux generated by the ith cation; zi, the charge of the jth cation; F = 96,485 C·mol−1; and the Faraday constant. The equilibrium among monovalent and divalent cationic flows is defined by the absence of net current through the channel at the reversal potential:
| 2 |
Substituting Equation 1 into Equation 2 for each cation at equilibrium gives Equation 3:
 |
3 |
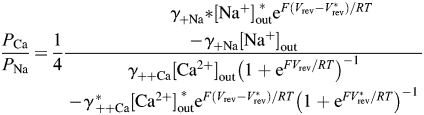
where γ++i is the individual activity coefficient for the ith cation(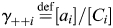 ); [Ci] is the concentration of the ith cation and [Ca2+]in = [Na+]in = [CS+]out = 0. To eliminate dependence on the internal solution, Equation 3 can be written for each of the two external solutions containing different concentrations of Ca2+ (e.g. 2 and 20 mM), giving a system of two algebraic equations with the unique solution for PCa/PNa that does not contain PCs (Equation 4):
 |
4 |
where parameters marked by * correspond to the external solution containing 20 mM Ca2+. Equation 4 describes the permeability ratio of Ca2+ over Na+ within standard assumptions of independent ionic fluxes driven by electro-diffusion in a constant electric field in a non-saturating ion channel pore [32,33].
Calculation of individual activity coefficients for monovalent and divalent cations
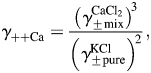
Since PCa/PNa does not involve parameters of the internal solution (Equation 4), only four mean activity coefficients, γ±, need to be estimated, i.e. for Na+ and Ca2+ in external solutions containing 2 and 20 mM Ca2+. The mean activity coefficients for Na+ or Ca2+ in a mixed aqueous solution containing both Na+ and Ca2+, γ±mix, can be estimated from the mean activity coefficients of corresponding pure solutions of equal ionic strengths (i.e. containing only Na+ or only Ca2+), γ±pure, and Equations 5(a,b) [34]:
| 5a |
| 5b |
where α12 is a constant (slope) reflecting the effect of CaCl2 on  in a mixed NaCl–CaCl2 solution of a given total ionic strength, μtotal1; α21 is a constant (slope) reflecting the effect of NaCl on
 in a mixed CaCl2–NaCl solution of a given total ionic strength, μtotal2; μ1 is the ionic strength of NaCl in the CaCl2–NaCl mixture and μ2 is the ionic strength of CaCl2 in the NaCl–CaCl2 mixture. The parameters related to the mean activity coefficients of solutions employed in this study were estimated from previously published experimental data obtained from mixed NaCl–CaCl2 aqueous solutions [35,36] and are given in Table 2. The total ionic strengths of external solutions containing 2 mM Ca2+ (LACSF) or 20 mM Ca2+ (HACSF) were 0.161 or 0.215 M (Table 2).
Table 2.
Parameters used for calculations of the individual activity coefficients (γ++/+)
| Cations/parameters | μtotal (M) | γ±pure | γ±mix | α12 | μ2 | α21 | μ1 | γ++/+ |
|---|---|---|---|---|---|---|---|---|
| LACSF | 0.161 | |||||||
| Naa | 0.752a | ∼0.752 | ∼0.05c | 0.006 | 0.754 | |||
| Ca2+ | 0.564b | ∼0.536 | ∼0.14d | 0.16 | 0.274 | |||
| HACSF | 0.215 | |||||||
| Na+ | 0.735a | ∼0.731 | ∼0.036e | 0.06 | 0.742 | |||
| Ca2+ | 0.551b | ∼0.529 | ∼0.11d | 0.16 | 0.286 |
To determine the individual activity coefficients for Na+ and Ca2+ in LACSF (i.e.  and
and  , respectively) and HACSF (i.e.
  and
and  , respectively), the MacInnes assumption was applied [Equation 6(a,b), respectively]:
 |
6a |
 |
6b |
where the values of  were obtained from previously published experimental data [37]. For comparison, an alternative approach for evaluation of the individual activity coefficients for Ca2+,
  (the Guggenheim convention), was also tested.
Estimation of the surface potential (Ψ)
Net negative local surface charges would be expected near the pore of nAChR and NMDAR channels resulting in a shift of the total membrane potential sensed by charged ions passing through channels. These charges are accounted for in the GHK equation (Equation 4) [38,39]. To evaluate the surface potential created by these local charges, a simplified solution of the Poisson–Boltzmann equation has been proposed and used within the Gouy–Chapman approximation (modified from Grahame 1947):
 |
7 |
where σ is the charge density (e·nm−2); A = 77,912.9 e2·m4·C−2·nm−4, a unit conversion constant converting the bulk activity (m−3) to molar activity (M) and the charge density, σ, from C·m−2 to e·nm−2; ε = 78.3, the dielectric constant of water; >ε0 = 8.854 × 10⁻¹² (C2·N−1·m−2), the permittivity of free space; γi is the molar activity coefficient of the ith ion; ci is the bulk molar activity of the ith ion; Ψ is the surface potential; and R, T and F have the same meaning as in Equation 1. The surface and the bulk activities are related by the Boltzman equation:
| 8 |
where ai = γici is the appropriate activity of the ith ion.
Results
Pharmacology of TM nACh and hippocampal CA1 NMDA receptors
In this experiments, rapid application of choline, an endogenous selective α7 nAChR agonist, to acutely dissociated hypothalamic TM neurons voltage clamped at −60 mV evoked transient currents that were completely inhibited by 20 nM methyllycaconitine (MLA), a selective α7 nAChR antagonist [n = 4, Fig. 1(A)]. Similarly, the application of NMDA (a selective NMDAR agonist) plus glycine (an allosteric modulator of NMDAR) to acutely dissociated hippocampal CA1 pyramidal neurons evoked responses that were completely inhibited by 100 µM (2R)-amino-5-phosphonopentanoate (APV), a selective antagonist of NMDARs [n = 4, Fig. 1(B)]. In experiments with NMDARs, 20 µM glycine was also always present in ACSF. These results confirm that experimental protocols adopted for this study ensured whole-cell responses of TM nAChRs in hypothalamic TM neurons and NMDAR-mediated whole-cell responses in hippocampal CA1 pyramidal neurons as previously reported [12,23].
Figure 1.

Responses of native TM α7-like nAChRs and hippocampal CA1 NMDARs in acutely dissociated neurons (A) Responses to brief (100–400 ms, 8–20 psi) applications of choline to acutely dissociated hypothalamic TM neurons were completely and reversibly blocked by 20 nM MLA. (B) Similarly, applications of NMDA plus glycine to acutely dissociated hippocampal CA1 neurons elicited responses completely blocked by 100 µM APV. In experiments with NMDARs, 20 µM glycine was always present in ACSF. The membrane voltage was held at −60 mV in voltage clamp. These results confirm that the experimental protocol adopted in this study permits studying native TM nAChRs and CA1 NMDARs in acutely dissociated central neurons. The mean and standard deviation of shifts in reversal potentials of TM nAChR-mediated responses (C) and CA1 NMDAR-mediated responses (D) due to a switch from LACSF to HACSF.
Ca2+ permeability of TM nAChRs and the comparison with hippocampal NMDARs
The results obtained from eight TM and seven hippocampal CA1 acutely dissociated neurons are shown in Fig. 1(C,D). Statistically significant shifts in reversal potentials of TM nAChR- and NMDAR-mediated currents were observed upon replacing LACSF with HACSF. The reversal potential of TM α7* nAChR-mediated responses shifted from 4.9 ± 2.9 to 15.2 ± 3.0 mV (P < 0.0001), i.e. a shift of 10.4 ± 1.0 mV (data not shown), or a shift from −1.9 ± 2.9 to 6.8 ± 3.2 mV, i.e. a shift of 8.7 ± 1.0 mV [Fig. 1(C)], after correcting for the liquid junction potentials ( mV and
  mV). Similarly, reversal potential for CA1 NMDARs shifted from 0.4 ± 1.4 to 13.8 ± 1.3 mV (P < 0.0001), i.e. a shift of 13.4 ± 0.7 mV; or from −6.3 ± 1.4 to 5.2 ± 1.3 mV, i.e. a shift of 11.5 ± 0.7 mV [Fig. 1(D)], after correcting for the junction potentials. The permeability ratio, PCa/PNa, was then calculated using Equation 4 with the assumption of no surface charge: σ = 0, Ψ = Ψ* = 0,
  and
and  . The latter assumption was eased later (see below).
Under experimental conditions used in this study (i.e. 90 mM [F−]i, 0 mM [Mg2+]i and 0 mM [Mg2+]o), the I–V relationships of TM nAChR-mediated responses near the reversal potential did not exhibit significant rectification in LACSF and HACSF. However, the slope conductances of TM nAChR-mediated currents in LACSF and HACSF were different [Fig. 2(A,C)]. In HACSF, TM nAChR-mediated responses exhibited a significantly lower slope conductance near Vrev (0.9 ± 0.4 nS, n = 8) than that in LACSF (3.6 ± 3.2 nS, n = 8) (P < 0.05) [Fig. 2(A)]. By contrast, the slope conductance of NMDAR-mediated responses near Vrev in HACSF (36.6 ± 10.4 nS, n = 7) and in LACSF (27.1 ± 7.4 nS, n = 7) were not significantly different (P > 0.05) [Fig. 2(B)]. This reduction in TM nAChR-mediated whole-cell conductance in HACSF was not due to a current rundown because it was independent on the order of solution exchange. Fig. 2(C) demonstrates that TM nAChR-mediated currents were smaller in HACSF even when the recordings were first conducted in HACSF (the left three current traces) and then, in LACSF (the right three current traces). In seven experiments, TM nAChR-mediated responses were recorded first in HACSF, and then, in LACSF, at the membrane voltage −60 or −80 mV. The ratio of TM nAChR-mediated current amplitudes in HACSF (IHACSF) and LACSF (ILACSF) was: IHACSF/ILACSF = 50.5 ± 14.0%. Note that this value is an underestimation because of the positive shift in the reversal potential in HACSF not accounted for in this illustration. These results indicate that high concentrations of external Ca2+ inhibit whole-cell nAChR-, but not NMDAR-mediated responses.
Figure 2.

The slope conductance near the reversal potential The mean and standard deviation of the slope conductance near Vrev built for (A) TM nAChR- and (B) CA1 NMDAR-mediated responses. A significant decrease in the slope conductance of TM α7* nAChR- (P < 0.033), but not hippocampal CA1 NMDAR-mediated responses (P > 0.07) was observed. This decrease was not due to a current rundown, because it persisted in experiments where HACSF was used before LACSF (C). Inserts to (A) and (B) show changes in the slope conductances observed in individual neurons [TM in (A) and CA1 in (B)].
Native nAChRs in acutely dissociated hypothalamic TM neurons
Whole-cell responses of acutely dissociated TM neurons to applications of choline via a picospritzer (100–400 ms duration at 8–20 psi pressure) were measured in voltage clamp at various membrane voltages. In the beginning of each experiment, the stability of TM nAChR-mediated responses was tested by at least three applications of choline every 30 s at the membrane voltage of −60 mV [Fig. 3(A,B)]. If the variability of response amplitudes was greater than 10%, the position of the application pipette was changed and the stability test was repeated. Upon successful completion of the stability test, TM nAChR-mediated responses to choline were recorded at various positive and negative membrane voltages in ACSF containing low (2 mM, i.e. LACSF) or high (20 mM, i.e. HACSF) [Ca2+]i [Fig. 3(C,D)]. Recordings were accepted as successful only if TM nAChR-mediated responses in both LACSF and HACSF were obtained from the same neuron. If a neuron was lost before complete I–V relationships were obtained in both LACSF and HACSF, the corresponding data were discarded. In both LACSF and HACSF, the I–V relationships of TM nAChR-mediated currents near reversal potentials were nearly linear and did not exhibit rectification, thus permitting determination of reversal potentials [Fig. 3(E)]. Native TM nAChRs were found to be highly permeable to Ca2+ with the permeability ratio, PCa/PNa (nAChR) = 5.9 ± 1.0 (n = 8). This value translates into the fractional Ca2+ current  , at −60 mV as described elsewhere [56].
Figure 3.

Current–voltage relationships of native TM α7-like nAChRs in ACSF with low and high [Ca2+]o Stability tests were always performed before (A) and after (B) each I–V experimental protocol. At least three applications of choline were made via a picospritzer pipette filled with choline. The interval between consequent applications of choline was 30 s. The test was considered successful only if the response variability was less than 10%, but typically, the response variability was significantly lower (A,B). Examples of traces obtained by applications of choline at various positive and negative membrane voltages in voltage clamp in LACSF [2 mM Ca2+; (C)] and HACSF [20 mM Ca2+; (D)]. The whole-cell conductance of TM nAChR channels in HACSF was always lower than that in LACSF, presumably due to a Ca2+-dependent block of monovalent ion permeation. (E) The current–voltage relationship for responses illustrated in (C) and (D). No considerable current rectification was observed owing to Mg2+-free external and internal solutions and the presence of F− in the internal solution. The I–V curves were fitted with second-order polynomial equations. All figures illustrate data obtained from the same acutely dissociated TM neuron.
Native NMDARs in acutely dissociated hippocampal CA1 pyramidal neurons
As a positive control for applied methods and analysis, the Ca2+ permeability of hippocampal CA1 NMDARs was determined using the same experimental approach, tissue preparation, solutions, and analysis as those used for the estimation of TM nAChR Ca2+ permeability. Whole-cell responses of acutely dissociated non-cultured hippocampal CA1 pyramidal neurons to applications of NMDA were measured in voltage clamp at various membrane voltages. The stability of NMDAR-mediated responses was always tested in the beginning of each experiment, by at least three applications of NMDA plus glycine every 30 s at the membrane voltage of −60 mV [Fig. 4(A,B)]. Neurons that passed the stability test were used for applications of NMDA via a picospritzer and NMDAR-mediated currents were recorded at various positive and negative membrane voltages in LACSF and HACSF [Fig. 4(C–E)]. Similar to experiments involving TM nAChRs, only the complete sets of data (i.e. from both LACSF and HACSF) were stored for off-line analysis. If a neuron was lost before complete I–V relationships were obtained, the corresponding data were discarded. The permeability ratio of native NMDARs in acutely dissociated hippocampal CA1 pyramidal neurons, PCa/PNa (NMDAR) = 8.3 ± 0.8 (n = 7), was determined using the same pool of whole-brain coronal slices, preparation and experimental techniques and solutions as those used for the estimation of TM nAChR Ca2+ permeability and found to be significantly greater (P < 0.002) than PCa/PNa (nAChR). The fractional Ca2+ current for native hippocampal NMDAR-mediated currents was  , at −60 mV [56].
Figure 4.

Current–voltage relationships of native hippocampal CA1 NMDARs in ACSF with low and high [Ca2+]o The experimental protocol and analysis used for evaluation of shifts in reversal potentials of TM nAChR-mediated responses and CA1 NMDARs (this figure) were identical. Stability tests were always performed before (A) and after (B) each I–V experimental protocol using at least three applications of NMDA plus glycine. NMDA plus glycine were pressure-applied every 30 s. Examples of traces obtained by applications of NMDA plus glycine at various positive and negative membrane voltages in voltage clamp in LACSF [2 mM Ca2+; (C)] and HACSF [20 mM Ca2+; (D)]. (E) The current–voltage relationship for responses illustrated in (C) and (D). The whole-cell conductance of NMDAR channels in HACSF was similar to that in LACSF, indicating a lack of significant Ca2+-dependent block of monovalent permeation. The I–V curves were fitted with second-order polynomial equations. All figures illustrate data obtained from the same acutely dissociated hippocampal CA1 neuron.
The effects of surface potentials on the Ca2+ permeability
The initial analysis of the Ca2+ permeabilities of TM nAChR and CA1 NMDAR channels was conducted within the assumption of no local surface charges near nAChRs and NMDARs: σ = 0, Ψ = Ψ* = 0,  and
and  (Equations 7, 8). The latter assumption was then eased and the effects of surface potentials Ψ(LACSF) and Ψ* (HACSF) on the permeability ratio were evaluated by introducing a negative surface charge, σ (e/nm2), [40]. A negative surface charge on the outer surface of the neuronal membrane generates a negative surface potential as described by Equation 7 [38,41]. The magnitude of this surface potential varies depending on the composition of experimental solutions and may significantly alter ion channel current–voltage relationships [40]. External cations, particularly divalent, attracted by negative surface potential, form a thin diffuse double ionic layer near the membrane surface which acts as an electric screen reducing the originating surface potential [40]. The effects of surface potentials on the Ca2+ permeability of TM nAChRs and CA1 NMDARs were evaluated. Fig. 5(A) illustrates that surface potentials calculated for LACSF (open circles) and HACSF (closed circles) were quite similar despite the broad range of surface charges used, i.e. between σ = 0 and σ = 0.32 (e/nm2). As predicted from the general theory [38,40,41], the surface potential was smaller in HACSF than in LACSF. However, those differences were considerable only for large surface charges [Fig. 5(A)].
Figure 5.

Estimates of the effects of local surface charges on the Ca2+ permeability (A) The relationship between the surface charge and potential built for LACSF (open circles) and HACSF (closed circles) using Equation 7. The estimated values of surface potentials in LASCF and HACSF are very similar up until larger surface charges (>0.1 e/nm2), where the surface potential in HACSF becomes smaller due to charge screening by Ca2+. (B) The effects of surface charges on the Ca2+ permeability. The negative surface charge reduces PCa/PNa ratios for both TM nAChRs (open circles) and CA1 NMDARs (closed circles). The mean values of reversal potentials of TM nAChR- and CA1 NMDAR-mediated currents in LACSF and HACSF were used for calculations of PCa/PNa ratios for different surface charge densities. Calculations of the individual activity coefficients of divalent and monovalent ions were made within the MacInnes approximation. Dashed and solid lines show similar relationships calculated within Guggenheim approximation for TM α7* nAChRs and hippocampal CA1 NMDARs, respectively.
The effects of surface potentials on the Ca2+ permeability of TM nAChR and CA1 NMDAR channels were then evaluated using Equation 4, where the membrane potentials, V and V*, were replaced by V − Ψ and V* − Ψ*, respectively, and the bulk activities of ions were replaced by surface activities calculated using Equation 8 and assuming that the bulk and surface activity coefficients are unchanged. This analysis revealed that the surface charges reduce the Ca2+ permeability of TM nAChR and CA1 NMDAR channels [Fig. 5(B)]. To estimate the individual activity coefficients of ions, two common approximations were used (see below): the MacInnes [open and closed circles; Fig. 5(B)] and the Guggenheim [solid and dashed lines; Fig. 5(B)]. Both approaches gave similar results with slight quantitative differences clearly seen in Fig. 5(B). The data illustrated in Fig. 5(B) predict that the Ca2+ permeability of both TM nAChRs and CA1 NMDARs drops ∼27% as a result of the surface charge of ∼0.16 e/nm2. These results are similar to those reported for α7-like nAChRs and NMDARs in cultured hippocampal neurons [1] where a similar range of surface charge values were tested, i.e. 0.02–0.2 e/nm2. Although the surface charge near native α7* nAChRs is presently unknown, in various models proposed for Na+, K+, and Ca2+ voltage-gated channels, values between 0.2 and 0.8 e/nm2 have been used [42–44], which are within the range evaluated in the present study.
Discussion
This study reveals that TM α7* nAChRs are highly permeable to Ca2+. The GHK-based analysis demonstrated that the permeability ratio estimated for TM nAChRs, PCa/PNa(nAChR) ∼5.9, is significantly smaller than the permeability ratio estimated for hippocampal NMDARs, PCa/PNa(NMDAR) ∼8.3. This value is similar to that reported for putative α7-like nAChRs expressed in hippocampal cultured neurons [1], but is smaller than what was reported elsewhere for recombinant α7 nAChRs (PCa/PNa ∼10–20; [2–4,6]). The permeability ratio PCa/PNa(nAChR) ∼5.9 determined in this study for native hypothalamic TM α7* nAChRs corresponds to the fractional current Pf(nAChR) ∼10.1%. This value is similar to the values obtained for human α7 nAChRs (∼11.4; [45]) and somewhat larger than Pf of rat α7 nAChRs in transfected GH4C1 cells (∼8.8; [45] and ∼8.0; [46]). These results support the hypothesis that α7* nAChRs maintain a high degree of functional homology, including Ca2+ permeability, across species and preparations [45,47]. Therefore, the results of this study may be applicable to α7* nAChRs expressed in other brain regions and heterologous systems.
To evaluate PCa/PNa (nAChR) ratios for TM nAChRs and hippocampal NMDARs the same pool of coronal whole-brain slices and identical experimental techniques, solutions, and analysis were used. As expected, hippocampal CA1 NMDARs were found to be highly Ca2+ permeable [PCa/PNa(NMDAR) ∼ 8.3;  , at −60 mV] consistent with previous reports (PCa/PNa ∼10; [1,18,20]). Therefore, the present analysis indicates that native CA1 NMDARs are ∼1.4 fold more permeable to Ca2+ than native TM α7* nAChRs. This estimate is comparable to the value obtained from cultured hippocampal neurons (∼1.7; [1]); but is somewhat lower than the value determined by fluorescent imaging using hippocampal CA1 interneurons (∼2.2; [7]).
Evaluation of individual activity coefficients of ions
The values of PCa/PNa(nAChR) and PCa/PNa(NMDAR) are highly sensitive to estimated parameters of electrolyte solutions, such as the individual activity coefficients of ions. In solutions that are not infinitely diluted, such as ACSF, there is an electrical interaction among ions which can be accounted for by using activities of ions, aj = cjγj, instead of concentrations, cj [36]. The parameter γj = γ++j < 1 is the activity coefficient of the jth ion. Individual activity coefficients cannot be determined experimentally because solutions that contain only coions cannot be created and the presence of counterions must be accounted for. However, the individual activity coefficients γ++ can be evaluated from the mean activity coefficients of contributing salts, γ±. Therefore, although using activities instead of concentrations is rationally appropriate for any real solution, there is an intrinsic potential for an error in estimating activities. The two most common assumptions used for evaluation of individual activity coefficients are the MacInnes [Equation 6(a,b)] and the Guggenheim [ ] conventions. The MacInnes assumption was adopted in the present study, but the Guggenheim assumption was also tested and the results are shown in Fig. 5. A detailed comparison of these and other assumptions has been given previously [48] and is not discussed here. The values of individual activity coefficients used in this study (
 ,
,  ,
,  , and
, and  ) were derived specifically for LACSF and HACSF from empirical data obtained from analysis of mixed NaCl–CaCl2 aqueous solutions (Theory and Methods [35–37]). These values are similar to those used in previous studies, although for experimental solutions with different compositions [1,17,19,20].
Equation 4 allows a simple evaluation of the sensitivity of PCa/PNa to  ,
,  ,
,  , and
, and  . Therefore, the dependence of PCa/PNa(nAChR) and PCa/PNa(NMDAR) on
  and
and  [Fig. 6(A,C), respectively] and
  and
and  [Fig. 6(B,D), respectively] were evaluated within the MacInnes assumption using Equation 4 and assuming that all other parameters were unchanged. This analysis showed that there is a relatively weak dependence of PCa/PNa(nAChR) and PCa/PNa(NMDAR) on the activity coefficient in LACSF,
  , [black hyperbolic lines, Fig. 6(A,C), respectively] and that dependence of PCa/PNa(nAChR) and PCa/PNa(NMDAR) on activity coefficient in HACSF,
  , is significantly stronger [grey hyperbolic lines, Fig. 6(A,C), respectively]. Therefore, deviations in estimates of
  affect the estimates of PCa/PNa(nAChR) and PCa/PNa(NMDAR) to a greater degree than those of
  . The dependence of PCa/PNa(nAChR) and PCa/PNa(NMDAR) on
  [black lines, Fig. 6(B,D), respectively] and
  [grey lines, Fig. 6(B,D), respectively] are linear, as predicted by Equation 4, and are of approximately equal strength for the experimental solutions used. In this section, all estimates of PCa/PNa were made within the assumption of no surface charge.
Figure 6.

The effects of individual activity coefficients on the Ca2+ permeability The Ca2+ permeability of TM α7* nAChRs was evaluated as the function of individual activity coefficients of Ca2+ (γ++Ca,  ) (A) and Na+ (γ+Na,
  ) (B) ions. The values of individual activity coefficients of Ca2+ and Na+ varied between 0.2 and 0.3 (A) and 0.7 and 0.8 (B), respectively. The PCa/PNa was found to be strongly dependent on
  (gray lines built for three values of γ++Ca) and weakly on γ++Ca (black lines built for three values of
  ). The horizontal scale was assumed to be
  for gray lines and γ++Ca for black lines. The dependence of PCa/PNa on γ+Na and
  were of approximately equal strength. Similar relationships were observed for hippocampal CA1 NMDARs (C,D).
The effects of external Ca2+ on the whole-cell conductance of TM nAChRs and hippocampal NMDARs
The whole-cell conductance of TM nAChR-mediated responses measured the near reversal potential was significantly greater (P < 0.05) in LACSF ([Ca2+]o = 2 mM) than in HACSF ([Ca2+]o = 20 mM) [Fig. 2(A,C,E)]. A similar effect of [Ca2+]o on the whole-cell conductance of α7-like nAChR channels has been observed in cultured hippocampal neurons, although quantitative analysis was not provided [1]. These observations are consistent with the Ca2+-dependent decrease in the single-channel conductance reported for non-α7 nAChRs in various preparations [49–51], presumably due to a direct block and/or screening of the channel pore by Ca2+. A recent detailed analysis of divalent and monovalent permeations of non-desensitizing α7 nAChRs suggests that surface and fixed charges do not significantly contribute to the Ca2+-dependent inhibition of α7 nAChR-mediated responses, and instead, low-affinity (∼1–2 mM) binding sites in the channel pore are responsible for both the Ca2+ permeability and the Ca2+-dependent block of monovalent permeation of α7 nAChR channels [52]. In several preparations, the whole-cell conductance of non-α7 nAChRs has also been shown to decrease with an increase in [Ca2+]o [51,53]. However, in medial habenula neurons, potentiation of whole-cell nAChRs by [Ca2+]o has been found to co-exist with a decrease in the single-channel conductance and this discrepancy was attributed to an increase in the frequency of ion channel openings [54,55].
By contrast, a 10-fold increase in [Ca2+]o from 2 to 20 mM did not significantly reduce the whole-cell conductance of NMDAR-mediated responses near their reversal potential in acutely dissociated hippocampal CA1 neurons (P > 0.07) [Fig. 2(B)]. Similar observations have been made in single-channel [56] and whole-cell [1,21] experiments in cultured hippocampal neurons. However, a 67-fold increase in [Ca2+]o from 0.3 to 20 mM has been reported to reduce the whole-cell conductance of NMDAR-mediated currents by 32% in cultured spinal cord and hippocampal neurons [20]. These differences in Ca2+ sensitivity of α7 nAChR and NMDAR channels may reflect different affinities with which Ca2+ block monovalent permeation [51], and/or a potential Ca2+-dependent modulation of α7 nAChR-channel kinetics and/or binding.
Limitations and advantages of the experimental approach employed
In this study, the Ca2+ permeability of TM nAChR and CA1 NMDAR channels were evaluated using measurements of shifts in current reversal potentials (i.e. the Vrev approach). This is a basic approach which uses the GHK constant field approximation within the assumption of ion independence. It allows quantitative evaluations of the effects of surface charge and activity coefficients on PCa/PNa. An alternative approach (i.e. the Pf approach) employs simultaneous direct fluorescent measurements of Ca2+ influx and corresponding currents to determine the fractional Ca2+ current,  [57]. The main advantage of the Pf approach is that it does not require theoretical assumptions (e.g. the absence of ionic interactions in the channel pore), nor does it require accurate estimates of the individual activity coefficients of ions. However, the Pf approach presents several key challenges when applied to neurons. First, the Pf approach requires a flawless voltage clamp and ‘uniform fluorescent detection efficiency’ over the entire cell volume [57]. Second, it requires the absence of other sources and sinks of Ca2+, such as internal Ca2+ stores, Na+/Ca2+ exchangers, Ca2+ATPase, Ca2+ buffering and diffusion [2]. Third, it requires the absence of secondary conductances (e.g. Ca2+-dependent K+ conductance) which would be expected to decrease the inward current net charge and thus, cause an overestimation of Pf. Activation of NMDARs has been reported to give rise to Ca2+-dependent K+ conductance in central neurons [58–60]. Preliminary data from this laboratory indicate that activation of α7-like nAChRs in brainstem neurons of the nucleus of the solitary tract of C57BL/6J mice gives rise to a bi-phasic response: a rapid transient inward current followed by a slow outward current which can be attributed to a Ca2+-dependent outward conductance (V. Uteshev, unpublished). Finally, the Pf approach assumes the absence of intracellular Ca2+-binding domains that may restrict the access of Ca2+ to fluorescent dye [7,16]. All of these factors may be quite important when dealing with neurons and would require adjustments to the otherwise straightforward Pf approach. The same factors, however, are less relevant to the Vrev approach.
When both approaches were applied simultaneously to evaluate the Ca2+ permeability of recombinant GluR channels expressed in HEK-293 cells, discrepancies in results were revealed [22]. These may be related to some of the factors discussed above. In addition, a presumed negative surface charge near nAChR or NMDAR channel pores would be expected to decrease PCa/PM [Fig. 5(B)] and thus, decrease  estimated from PCa/PM (Equation 1 in [22]). Therefore, disregarding surface charges may overestimate
  relative to
  . However, the effects of surface charges on α7-like nAChR function are likely to be minimal [52]. There may be more general causes of discrepancy. For example, ionic permeabilities and permeability ratios may be voltage dependent. Nevertheless, the experimental conditions and analysis adopted in the present study appear to minimize the disagreements between the two methods even within the assumption of no surface charge: for native NMDARs in acutely dissociated hippocampal CA1 neurons the present analysis arrives at the value (
 ) very similar to
  measured in the same neuronal population by the Pf approach in other studies: 13.4% ([Ca2+]o = 1.8 mM [22],); 12.4% ([Ca2+]o = 2.5 mM, [60]); 10.7% ([Ca2+]o = 1.6 mM [18]).
Funding
This study was supported by the NIH grant DA021216 to VU.
Acknowledgements
We thank Dr Peter Barry for advice on the junction-potential compensation, Dr William Tandy Grubbs for proofing the calculations of individual activity coefficients of ions and Ms Heather Kardell for editorial assistance.
References
- 1.Castro NG, Albuquerque EX. a-Bungarotoxin-sensitive hippocampal nicotinic receptor channel has a high calcium permeability. Biophys J. 1995;68:516–524. doi: 10.1016/S0006-3495(95)80213-4. [DOI] [PMC free article] [PubMed] [Google Scholar]
- 2.Fucile S. Ca2+ permeability of nicotinic acetylcholine receptors. Cell Calcium. 2004;35:1–8. doi: 10.1016/j.ceca.2003.08.006. [DOI] [PubMed] [Google Scholar]
- 3.Seguela P, Wadiche J, Dinely-Miller K, Dani JA, Patrick JW. Molecular cloning, functional properties and distribution of rat brain alpha 7: a nicotinic cation channel highly permeable to calcium. J Neurosci. 1993;13:596–604. doi: 10.1523/JNEUROSCI.13-02-00596.1993. [DOI] [PMC free article] [PubMed] [Google Scholar]
- 4.Sands SB, Costa ACS, Patrick JW. Barium permeability of neuronal nicotinic acetylcholine receptor alpha 7 expressed in Xenopus oocytes. Biophys J. 1993;65:2614–2621. doi: 10.1016/S0006-3495(93)81296-7. [DOI] [PMC free article] [PubMed] [Google Scholar]
- 5.Vernino S, Amador M, Luetje CW, Patrick J, Dani JA. Calcium modulation and high calcium permeability of neuronal nicotinic acetylcholine receptors. Neuron. 1992;8:127–134. doi: 10.1016/0896-6273(92)90114-s. [DOI] [PubMed] [Google Scholar]
- 6.Bertrand D, Galzi JL, Devillers-Thiery A, Bertrand S. Mutations at two distinct sites within the channel domain M2 alter calcium permeability of neuronal alpha 7 nicotinic receptor. Proc Natl Acad Sci USA. 1993;90:6971–6975. doi: 10.1073/pnas.90.15.6971. [DOI] [PMC free article] [PubMed] [Google Scholar]
- 7.Fayuk D, Yakel JL. Ca2+ permeability of nicotinic acetylcholine receptors in rat hippocampal CA1 interneurones. J Physiol. 2005;566:759–768. doi: 10.1113/jphysiol.2005.089789. [DOI] [PMC free article] [PubMed] [Google Scholar]
- 8.Nutter TJ, Adams DJ. Monovalent and divalent cation permeability and block of neuronal nicotinic receptor channels in rat parasympathetic ganglia. J Gen Physiol. 1995;105:701–723. doi: 10.1085/jgp.105.6.701. [DOI] [PMC free article] [PubMed] [Google Scholar]
- 9.Meyer EM, Tay ET, Zoltewicz JA, Papke RL, Meyers C, King M, Fiebre CMd. Neuroprotective and memory-related actions of novel a7 nicotinic agents with different mixed agonist/antagonist properties. J Pharmacol Exp Ther. 1998;284:1026–1032. [PubMed] [Google Scholar]
- 10.Role L, Berg D. Nicotinic receptors in the development and modulation of CNS synapses. Neuron. 1996;16:1077–1085. doi: 10.1016/s0896-6273(00)80134-8. [DOI] [PubMed] [Google Scholar]
- 11.Dajas-Bailador F, Wonnacott S. Nicotinic acetylcholine receptors and the regulation of neuronal signalling. Trends Pharmacol Sci. 2004;25:317–324. doi: 10.1016/j.tips.2004.04.006. [DOI] [PubMed] [Google Scholar]
- 12.Uteshev VV, Stevens DR, Haas HL. Alpha-Bungarotoxin-sensitive nicotinic responses in rat tuberomammillary neurons. Pflugers Arch. 1996;432:607–613. doi: 10.1007/s004240050176. [DOI] [PubMed] [Google Scholar]
- 13.Uteshev VV, Meyer EM, Papke RL. Activation and inhibition of native neuronal alpha-bungarotoxin-sensitive nicotinic ACh receptors. Brain Res. 2002;948:33–46. doi: 10.1016/s0006-8993(02)02946-3. [DOI] [PubMed] [Google Scholar]
- 14.Uteshev VV, Meyer EM, Papke RL. Regulation of neuronal function by choline and 4OH-GTS-21 through alpha 7 nicotinic receptors. J Neurophysiol. 2003;89:1797–1806. doi: 10.1152/jn.00943.2002. [DOI] [PubMed] [Google Scholar]
- 15.Papke RL, Meyer E, Nutter T, Uteshev VV. Alpha 7 receptor-selective agonists and modes of alpha 7 receptor activation. Eur J Pharmacol. 2000;393:179–195. doi: 10.1016/s0014-2999(00)00009-1. [DOI] [PubMed] [Google Scholar]
- 16.Uteshev VV, Knot HJ. Somatic Ca(2+) dynamics in response to choline-mediated excitation in histaminergic tuberomammillary neurons. Neuroscience. 2005;134:133–143. doi: 10.1016/j.neuroscience.2005.03.013. [DOI] [PubMed] [Google Scholar]
- 17.Zarei MM, Dani JA. Ionic permeability characteristics of the N-methyl-D-aspartate receptor channel. J Gen Physiol. 1994;103:231–248. doi: 10.1085/jgp.103.2.231. [DOI] [PMC free article] [PubMed] [Google Scholar]
- 18.Garaschuk O, Schneggenburger R, Schirra C, Tempia F, Konnerth A. Fractional Ca2+ currents through somatic and dendritic glutamate receptor channels of rat hippocampal CA1 pyramidal neurones. J Physiol. 1996;491:757–772. doi: 10.1113/jphysiol.1996.sp021255. [DOI] [PMC free article] [PubMed] [Google Scholar]
- 19.Spruston N, Jonas P, Sakmann B. Dendritic glutamate receptor channels in rat hippocampal CA3 and CA1 pyramidal neurons. J Physiol. 1995;482:325–352. doi: 10.1113/jphysiol.1995.sp020521. [DOI] [PMC free article] [PubMed] [Google Scholar]
- 20.Mayer ML, Westbrook GL. Permeation and block of N-methyl-D-aspartic acid receptor channels by divalent cations in mouse cultured central neurons. J Physiol. 1987;394:501. doi: 10.1113/jphysiol.1987.sp016883. [DOI] [PMC free article] [PubMed] [Google Scholar]
- 21.IIno M, Ozawa S, Tsuzuki K. Permeation of calcium through excitatory amino acid receptor channels in cultured rat hippocampal neurons. J Physiol. 1990;424:151–165. doi: 10.1113/jphysiol.1990.sp018060. [DOI] [PMC free article] [PubMed] [Google Scholar]
- 22.Burnashev N, Zhou Z, Neher E, Sakmann B. Fractional calcium currents through recombinant GluR channels of the NMDA, AMPA and kainate receptor subtypes. J Physiol. 1995;485:403–418. doi: 10.1113/jphysiol.1995.sp020738. [DOI] [PMC free article] [PubMed] [Google Scholar]
- 23.Zilberter Y, Uteshev V, Sokolova S, Khodorov B. Desensitization of N-methyl-D-aspartate receptors in neurons dissociated from adult-rat hippocampus. Mol Pharmacol. 1991;40:337–341. [PubMed] [Google Scholar]
- 24.Uteshev V, Stevens DR, Haas HL. A persistent sodium current in acutely isolated histaminergic neurons from rat hypothalamus. Neuroscience. 1995;66:143–149. doi: 10.1016/0306-4522(94)00593-t. [DOI] [PubMed] [Google Scholar]
- 25.Alkondon M, Pereira EF, Cortes WS, Maelicke A, Albuquerque EX. Choline is a selective agonist of alpha7 nicotinic acetylcholine receptors in the rat brain neurons. Eur J Neurosci. 1997;9:2734–2742. doi: 10.1111/j.1460-9568.1997.tb01702.x. [DOI] [PubMed] [Google Scholar]
- 26.Kem WR, Mahnir VM, Papke RL, Lingle CJ. Anabaseine is a potent agonist on muscle and neuronal alpha-bungarotoxinsensitive nicotinic receptors. J Pharmacol Exp Ther. 1997;283:979–992. [PubMed] [Google Scholar]
- 27.Papke RL, Porter Papke JK. Comparative pharmacology of rat and human alpha7 nAChR conducted with net charge analysis. Br J Pharmacol. 2002;137:49–61. doi: 10.1038/sj.bjp.0704833. [DOI] [PMC free article] [PubMed] [Google Scholar]
- 28.Lopez-Hernandez G, Placzek AN, Thinschmidt JS, Lestage P, Trocme-Thibierge C, Morain P, Papke RL. Partial agonist and neuromodulatory activity of S 24795 for alpha7 nAChR responses of hippocampal interneurons. Neuropharmacology. 2007;53:134–144. doi: 10.1016/j.neuropharm.2007.04.007. [DOI] [PubMed] [Google Scholar]
- 29.Alkondon M, Reinhardt S, Lobron C, Hermsen B, Maelicke A, Albuquerque EX. Diversity of nicotinic acetylcholine receptors in rat hippocampal neurons. II. The rundown and inward rectification of agonist-elicited whole cell currents and identification of receptor subunits by in situ hybridization. J Phamacol Exp Ther. 1994;271:494–506. [PubMed] [Google Scholar]
- 30.Shao Z, Yakel JL. Single channel properties of neuronal nicotinic ACh receptors in stratum radiatum interneurons of rat hippocampal slices. J Physiol. 2000;527:507–513. doi: 10.1111/j.1469-7793.2000.00507.x. [DOI] [PMC free article] [PubMed] [Google Scholar]
- 31.Goldman DE. Potential impedance and rectification in membranes. J Gen Physiol. 1943;27:37–60. doi: 10.1085/jgp.27.1.37. [DOI] [PMC free article] [PubMed] [Google Scholar]
- 32.Hodgkin AL, Katz B. The effect of sodium ions on the electrical activity of giant axon of the squid. J Physiol. 1949;108:37–77. doi: 10.1113/jphysiol.1949.sp004310. [DOI] [PMC free article] [PubMed] [Google Scholar]
- 33.Harned, Owen . The Physical Chemistry of Electrolytic Solutions. New York: Reinhold; 1963. [Google Scholar]
- 34.Moore A, Ross M. NaCl and CaCl2 activity coefficients in mixed acqueous solutions. J Appl Physiol. 1965;20:1332–1336. [Google Scholar]
- 35.Robinson, Stokes . Electrolyte Solutions. Mineola, New York: Dover Publication, Inc; 2002. [Google Scholar]
- 36.Garrels, Christ . Solutions, Minerals and Equilibria. San Fransisco: Freeman, Cooper & Company; 1965. [Google Scholar]
- 37.Barber J. Membrane surface charges and potentials in relation to photosynthesis. Biochim Biophys Acta. 1980;594:253–308. doi: 10.1016/0304-4173(80)90003-8. [DOI] [PubMed] [Google Scholar]
- 38.Lewis CA. Ion-concentration dependence of the reversal potential and the single channel conductance of ion channels at the frog neuromuscular junction. J Physiol. 1979;286:417–445. doi: 10.1113/jphysiol.1979.sp012629. [DOI] [PMC free article] [PubMed] [Google Scholar]
- 39.Hille B, Woodhull AM, Shapiro BI. Negative surface charge near sodium channels of nerve: divalent ions, monovalent ions, and pH. Philos Trans R Soc Lond B Biol Sci. 1975;270:301–318. doi: 10.1098/rstb.1975.0011. [DOI] [PubMed] [Google Scholar]
- 40.Grahame The electrical double layer and the theory of electrocapillarity. Chem Rev. 1947;41:441–501. doi: 10.1021/cr60130a002. [DOI] [PubMed] [Google Scholar]
- 41.Muller RU, Finkelstein A. The electrostatic basis of Mg++ inhibition of transmitter release. Proc Natl Acad Sci USA. 1974;71:923–926. doi: 10.1073/pnas.71.3.923. [DOI] [PMC free article] [PubMed] [Google Scholar]
- 42.Hille B. Ionic Channels of Excitable Membranes. Sunderland: Sinauer Associates, Inc; 1992. [Google Scholar]
- 43.Gilbert DL, Ehrenstein G. Effect of divalent cations on potassium conductance of squid axons: determination of surface charge. Biophys J. 1969;9:447–463. doi: 10.1016/S0006-3495(69)86396-4. [DOI] [PMC free article] [PubMed] [Google Scholar]
- 44.Fucile S, Renzi M, Lax P, Eusebi R. Fractional Ca(2+) current through human neuronal alpha7 nicotinic acetylcholine receptors. Cell Calcium. 2003;34:205–209. doi: 10.1016/s0143-4160(03)00071-x. [DOI] [PubMed] [Google Scholar]
- 45.Placzek AN, Grassi F, Meyer EM, Papke RL. An alpha7 nicotinic acetylcholine receptor gain-of-function mutant that retains pharmacological fidelity. Mol Pharmacol. 2005;68:1863–1876. doi: 10.1124/mol.105.016402. [DOI] [PubMed] [Google Scholar]
- 46.Albuquerque EX, Pereira EF, Mike A, Eisenberg HM, Maelicke A, Alkondon M. Neuronal nicotinic receptors in synaptic functions in humans and rats: physiological and clinical relevance. Behav Brain Res. 2000;113:131–141. doi: 10.1016/s0166-4328(00)00208-4. [DOI] [PubMed] [Google Scholar]
- 47.Shatkay A. Individual activity of calcium ions in pure solutions of CaCl2 and in mixtures. Biophys J. 1968;8:912–919. doi: 10.1016/S0006-3495(68)86528-2. [DOI] [PMC free article] [PubMed] [Google Scholar]
- 48.Mulle C, Choquet D, Korn H, Changeux J-P. Calcium influx through nicotinic receptor in rat central neurons: its relevance to cellular regulation. Neuron. 1992;8:135–143. doi: 10.1016/0896-6273(92)90115-t. [DOI] [PubMed] [Google Scholar]
- 49.Decker ER, Dani JA. Calcium permeability of the nictoinic acetylcholine receptor: the single-channel calcium permeability is significant. J Neurosci. 1990;10:3413–3420. doi: 10.1523/JNEUROSCI.10-10-03413.1990. [DOI] [PMC free article] [PubMed] [Google Scholar]
- 50.Buisson B, Gopalakrishnan M, Arneric SP, Sullivan JP, Bertrand D. Human alpha4beta2 neuronal nicotinic acetylcholine receptor in HEK 293 cells: a patch-clamp study. J Neurosci. 1996;16:7880–7891. doi: 10.1523/JNEUROSCI.16-24-07880.1996. [DOI] [PMC free article] [PubMed] [Google Scholar]
- 51.Lyford LK, Lee JW, Rosenberg RL. Low-affinity Ca(2+) and Ba(2+) binding sites in the pore of alpha7 nicotinic acetylcholine receptors. Biochim Biophys Acta. 2002;1559:69–78. doi: 10.1016/s0005-2736(01)00437-0. [DOI] [PubMed] [Google Scholar]
- 52.Ragozzino D, Barabino B, Fucile S, Eusebi F. Ca2+ permeability of mouse and chick nicotinic acetylcholine receptors expressed in transiently transfected human cells. J Physiol. 1998;507:749–757. doi: 10.1111/j.1469-7793.1998.749bs.x. [DOI] [PMC free article] [PubMed] [Google Scholar]
- 53.Mulle C, Léna C, Changeux J-P. Potentiation of nicotinic receptor response by external clacium in rat central neurons. Neuron. 1992;8:937–945. doi: 10.1016/0896-6273(92)90208-u. [DOI] [PubMed] [Google Scholar]
- 54.Hicks JH, Dani JA, Lester RA. Regulation of the sensitivity of acetylcholine receptors to nicotine in rat habenula neurons. J Physiol. 2000;529:579–597. doi: 10.1111/j.1469-7793.2000.00579.x. [DOI] [PMC free article] [PubMed] [Google Scholar]
- 55.Jahr CE, Stevens CF. Calcium permeability of the N-methyl-D-aspartate receptor channel in hippocampal neurons in culture. Proc Natl Acad Sci USA. 1993;90:11573–11577. doi: 10.1073/pnas.90.24.11573. [DOI] [PMC free article] [PubMed] [Google Scholar]
- 56.Schneggenburger R, Zhou Z, Konnerth A, Neher E. Fractional contribution of calcium to the cation current through glutamate receptor channels. Neuron. 1993;11:133–143. doi: 10.1016/0896-6273(93)90277-x. [DOI] [PubMed] [Google Scholar]
- 57.Isaacson JS, Murphy GJ. Glutamate-mediated extrasynaptic inhibition: direct coupling of NMDA receptors to Ca(2+)-activated K+ channels. Neuron. 2001;31:1027–1034. doi: 10.1016/s0896-6273(01)00428-7. [DOI] [PubMed] [Google Scholar]
- 58.Murai Y, Ishibashi H, Koyama S, Akaike N. Ca2+-activated K+ currents in rat locus coeruleus neurons induced by experimental ischemia, anoxia, and hypoglycemia. J Neurophysiol. 1997;78:2674–2681. doi: 10.1152/jn.1997.78.5.2674. [DOI] [PubMed] [Google Scholar]
- 59.Shah MM, Haylett DG. K+ currents generated by NMDA receptor activation in rat hippocampal pyramidal neurons. J Neurophysiol. 2002;87:2983–2989. doi: 10.1152/jn.2002.87.6.2983. [DOI] [PubMed] [Google Scholar]
- 60.Rogers M, Dani JA. Comparison of quantitative calcium flux through NMDA, ATP and ACh receptor channels. Biophy J. 1995;68:501–506. doi: 10.1016/S0006-3495(95)80211-0. [DOI] [PMC free article] [PubMed] [Google Scholar]