
Figure 2. Comparative analysis of normal and Rho0 mitochondria.
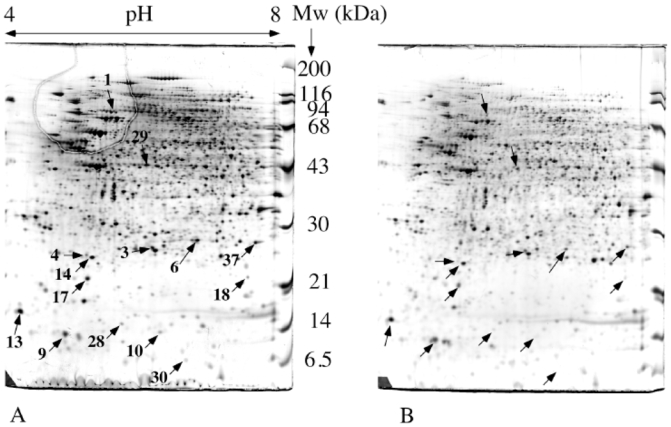
120 μg of mitochondrial proteins were separated by two-dimensional gel electrophoresis. Separation parameters: pH gradient: immobilized linear pH 4 to 8. Second dimension: 10% gel at pH 8.05 (taurine system). Reproducible differentially expressed spots are indicated by arrows and numbered according to table 1. A: normal mitochondria. B: Rho0 mitochondria