Abstract
While cancer is still an implacable disease, many cancers can be cured if they are diagnosed in an early stage. Recently, it was reported that the transformation from normal cells to cancer cells can change their mechanoelastic properties to become softer and more deformable. If some cancer cells are more deformable, then a progressive increase of the volume of softer cancer cells should be induced as an abrupt change in osmolarity is applied. Based on this hypothesis, we developed a sensor that can electronically monitor the volume increase of cancer cells under hyposmotic pressure. By this methodology, K:Molv NIH 3T3 cells, 786-O human kidney carcinoma cells, and MPSC-1 ovarian cancer cells were successfully detected within 30 minutes using on the order of 10 cells. These cancer cells could be detected with the same sensitivity even in the presence of a vast excess of the respective non-cancerous cells (NIH 3T3 cells, Human Embryonic Kidney (HEK) 293 cells, ovarian surface epithelial (OSE) cells). Since the proposed impedimetric sensor could be useful for detecting cancer cells fast and reliably, it could be further implemented in the screening of large populations of tissue samples and the detection of circulating tumor cells for point-of-care applications.
Introduction
In 2009 more than 500,000 people are expected to die of cancer in the U.S.1 This is certainly serious, and the best strategy to halt cancer’s progress is development of new diagnostic tools that allow one to detect the disease in an early stage.2 Currently, one of the most promising approaches is to detect biomarkers for particular cancers.3 In this strategy, alterations in the sequence or content of nucleic acids as well as variations in certain protein levels are mainly used as reporters of the disease. However, variations in genetic patterns among patients along with the difficulty of finding new biomarkers for certain cancer types are important issues to overcome for the broader application of these genomic and proteomic tools in cancer diagnostics.4 Moreover, although genomic and proteomic profiling are very informative about cancer development and treatment, these methodologies are often time-consuming and need to be performed in specialized facilities by experienced personnel. Therefore, it would be desirable to develop simple and robust detection systems without using biomarkers for a variety of tumor types regardless of its origin to screen large populations of samples before performing other tedious examinations. Recently, the mechanoelastic properties of cancer cells were studied with an atomic force microscope and cancer cells were reported to be softer than normal cells.5 Although the direct mechanical measurement of cells could be applied for label-free diagnosis of various types of cancer, the use of specialized equipment along with tedious measurement of one cell at a time might hamper the implementation of this approach in clinical applications. For practical uses, it would be desirable to detect the mechanical properties of cells with a simplified procedure and reduced assay time.6,7 For example, cells are observed to swell as hyposmotic stress is applied,8,9 and the volume changes induced by this internal pressure change could reflect their mechanoelastic property to differentiate cancer cells from non-cancer cells. Here, we develop a detection scheme that can quantify the swelling behavior of different types of cancer cells with impedimetric micro-transducers so that cancer cells can be selectively detected by their volume change under strong hyposmotic stress. The impedimetric transducer can detect variations of the volume of cells on the transducer sensitively; if the volume of cells bound on the transducer increases, the impedance at high frequency increases.10 Since cells swell in media with low electrolyte content by hyposmotic pressure,8,9 this impedimetric transducer could detect the resulting increase of the cell volume when the impedance is measured in real time. In this context, the more elastic nature of cancer cells5–7 could be responsible for larger volume changes before bursting (Fig. 1a), therefore resulting in larger impedance variations. By contrast, the less deformable nature of normal cells could yield smaller volume changes (Fig. 1b). Hence, if cancer and normal cells have different swelling properties, these cells could be distinguished by their volume changes impedimetrically as the hyposmotic pressure is applied. In this report an impedimetric silicon transducer was demonstrated to detect cancer cells such as K:Molv NIH 3T3 cells, 786-O human kidney carcinoma cells, and MPSC-1 ovarian cancer cells in less than 30 minutes even in the presence of an excess amount of the corresponding normal cells, therefore demonstrating the usefulness of this approach for the label-free detection of cancerous cells.
Figure 1.
Schematic representation of the swelling behaviors of K:Molv NIH 3T3 cancer cells (top) and NIH 3T3 normal cells (bottom) with time after the hyposmotic stress is applied.
Experimental
Cell culture
NIH 3T3 and K:Molv NIH 3T3 were used as models for normal and cancer cells, respectively.11 K:Molv NIH 3T3 were k-ras transformed; activation of Ras oncogene family transforms most cell lines to yield immortalized cell lines.12 Both cell lines were obtained from ATCC (NIH 3T3: ATCC# CRL-1658, K:Molv NIH 3T3: ATCC# CRL-6361) and maintained in DMEM (Dulbecco's Modified Eagle Medium) supplemented with 10% FCS (Fetal Calf Serum) at 37°C and 5% CO2. For the study of the model kidney cancer, Human Embryonic Kidney (HEK) 293 cells were used as the normal kidney cells and they were maintained in DMEM:Ham's F12 medium (1:1 mixture) supplemented with 2 mM L-glutamine and 10 % fetal bovine serum. The 786-O Human kidney carcinoma cell line was used as a model for kidney cancer cell and they were maintained in RPMI 1640 medium supplemented with 2 mM L-glutamine, 1 mM sodium pyruvate and 10 % fetal bovine serum at 37°C and 5 % CO2. Both cell types were kindly donated by Prof. David Foster at Hunter College. For the study of the model ovarian cancer, ovarian surface epithelial cells (OSE) were used as normal cells and MPSC-1 ovarian cancer cells were used as cancer cells. Both cell lines were kindly donated by Prof. Christopher M. Hale at Johns Hopkins University (Baltimore, MD). The ovarian cell lines were maintained in DMEM with 10% calf bovine serum and penicillin/streptomycin. All cell lines were subcultured by using a Trypsin-EDTA solution and the same solution was used to detach cells from the growth chambers prior to analysis. The number of cells was counted by a hemacytometer.
Inverted epifluorescence microscopy
To stain plasma membranes, Wheat Germ Agglutinin Conjugate (0.5 mg/ml, Invitrogen) was incubated in the complete medium solutions containing cells, whereas for the staining of the cytoplasm, the component calcein AM from the LIVE/DEAD ® Viability/Cytotoxicity Kit (4 µM, Invitrogen) was mixed with the same complete medium solutions. To image these cells, the single cells in the complete medium (5 µl, 106 cells/ml) were seeded in polylysine-modified cell culture plates for 20 minutes. Subsequently, the cells were carefully washed twice with deionized water, and then 50 µl of water were added to induce the hyposmotic stress. By counting the number of cells before and after this treatment, 80 ± 10 % cells were found to remain attached to the surface regardless of their cancerous nature or tissue of origin (n = 3). In addition, no cells were found to detach from the surface during the swelling process. The mean increase of the diameter was calculated by measuring 30 cells before and after applying the hyposmotic stress and the variability was obtained from the standard deviation. Optical images were obtained by a Nikon Eclipse TE 200 inverted epifluorescence microscope.
Impedimetric measurements
The impedimetric measurements were performed with polycrystalline silicon interdigitated electrodes with a digit width of 3 µm, a pitch of 6 µm, and a total interdigitated area of 2 mm2. The fabrication and the characterization of the interdigitated electrodes have been described elsewhere.13 After the incubation with polylysine (0.1 mg/ml, poly-D-lysine hydrobromide, Sigma) for 30 min, the electrodes were rinsed with deionized water and dried in streaming nitrogen. Subsequently, the electrodes were incubated with a suspension of single cells in the complete medium (1 µl) for 20 min and washed three times with deionized water. The impedance change due to the swelling of the remaining physisorbed cells was followed by measuring the impedance between the electrodes at 20 kHz in deionized water. In Fig. 4, the amount of cells is the number of cells contained in the 1 µl drop incubated with the electrodes.
Figure 4.
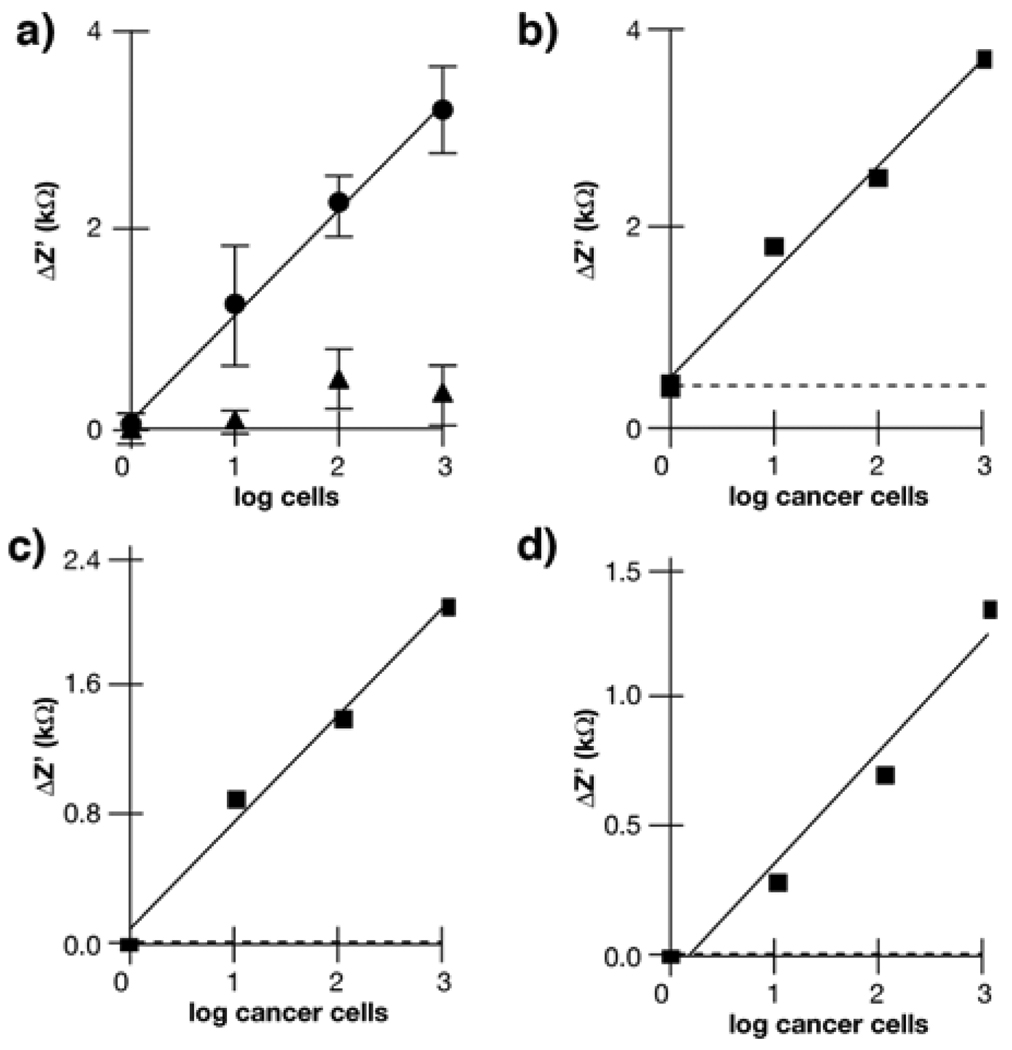
Variation of Z’ at t = 120 s with the number of cells deposited onto the electrodes; a) only K:Molv NIH 3T3 cells (cancer cells, circles), only NIH 3T3 cells (non-cancer cells, triangles). Error bars are the standard deviation (n = 3); b) K:Molv NIH 3T3 cells (cancer cells) spiked into samples containing 103 NIH 3T3 cells (non-cancer cells); c) 786-O Human kidney carcinoma cells (cancer cells) spiked into samples containing 103 HEK 293 cells (non-cancer cells); d) MPSC-1 ovarian cancer cells spiked into samples containing 103 OSE cells (non-cancer cells). Dotted lines in b), c) and d) show the background signal from the neat normal cells.
Results and Discussion
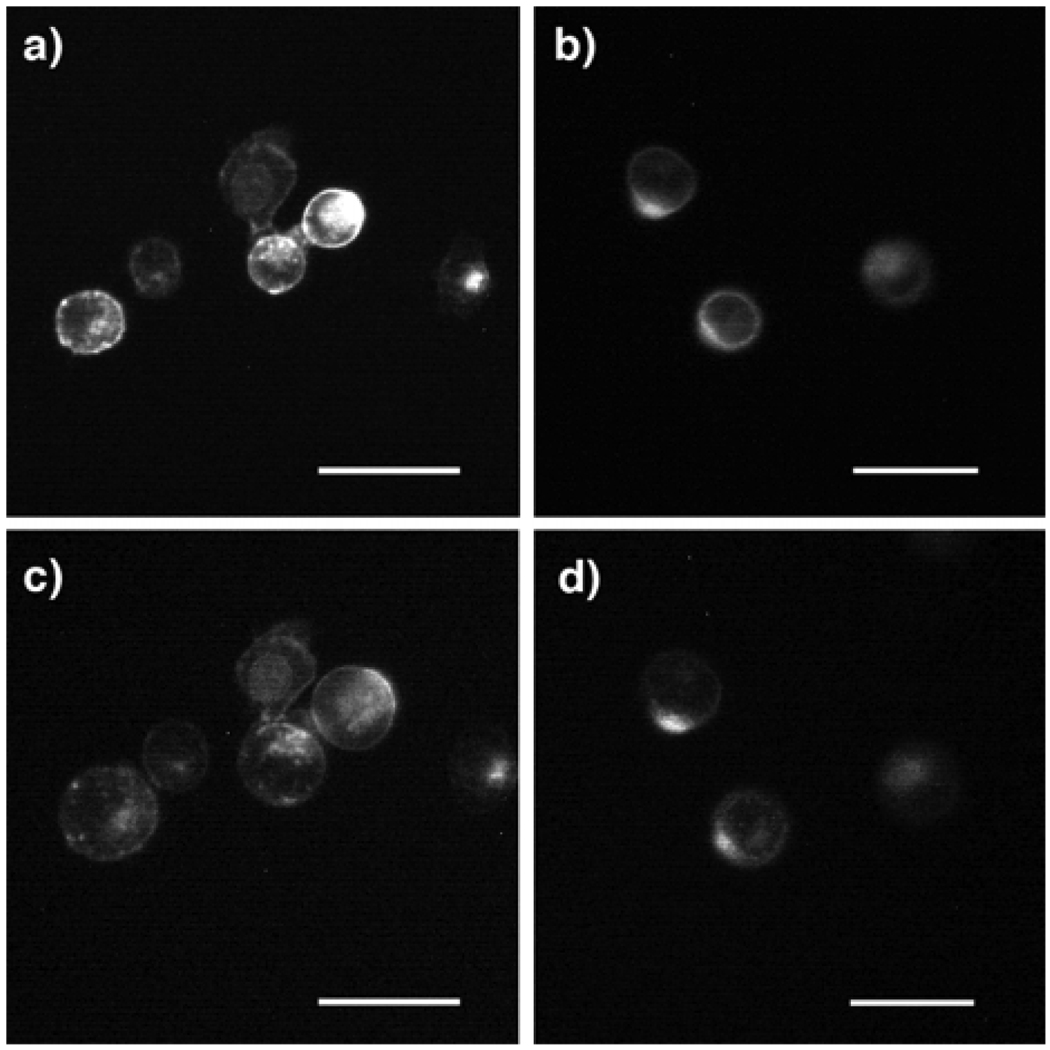
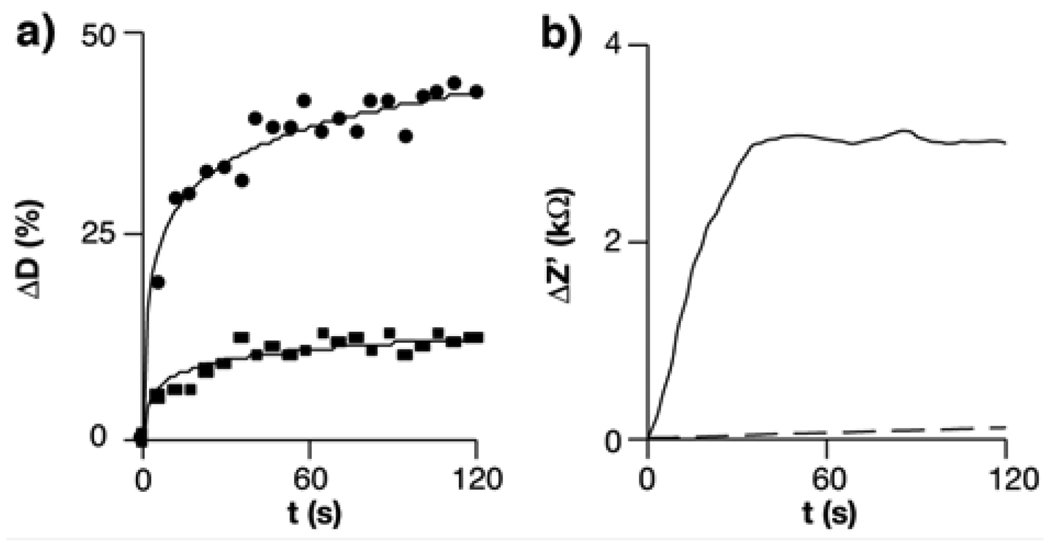
In the present detection configuration, the more deformable nature of cancer cells with larger volume changes under hyposmotic stress is essential to selectively detect cancerous samples by impedance measurements. To study the swelling of normal cells and cancer cells, plasma membranes of K:Molv NIH 3T3 and NIH 3T3 cells, widely accepted models to study cancer versus normal cells,11 were stained with a fluorescent dye, and the size of the cells physisorbed on polylysine-modified substrates was monitored with a fluorescence microscope after immersing them in deionized water to apply the hyposmotic stress. While these cells had similar physiognomy in physiological buffers, (Figs. 2a and 2b), the cancer cells were clearly swollen after this highly aggressive hyposmotic stress was applied (Fig. 2c), and the mean increase of cancer cell diameter was 40 ± 7 % at 120 s as compared to their original size (circles in Fig. 3a). As shown in Fig. 2d, the size of the non-cancer cells was almost constant with time and the increase of the mean diameter was only 14 ± 5 % from the size of cells in the non-stressed state (squares in Fig. 3a). This result indicates that cancer-like cells can undergo larger volume changes under the hyposmotic stress, and hence the impedimetric transducer could differentiate cancer cells from normal cells by probing their different swelling properties if they behaved similarly to K:Molv NIH 3T3 cells. To examine this hypothesis, we studied the impedance variation due to the presence of K:Molv NIH 3T3 cancer cells and NIH 3T3 normal cells on the impedimetric transducers with time. After 1 µl of a solution containing either the normal cells or the cancer cells was spotted on polylysine-modified interdigitated electrodes for 20 minutes, the impedance change at a proper frequency was measured as a function of time under the hyposmotic condition. In Figure 3b, the real part of the impedance (Z’) at 20 kHz increased with time when 103 cancer cells were immobilized on the electrodes. By contrast, the sensor containing the same number of the normal cells shows only a marginal impedance increase. This result indicates that the proposed transduction mechanism can differentiate cancer cells from non-cancer cells if the impedimetric measurement is performed at the point when their volume changes are significantly different.
Figure 2.
Fluorescence micrographs of stained plasma membranes of a) K:Molv NIH 3T3 cancer cells in the culture medium solution; b) NIH 3T3 normal cells in the culture medium solution; c) K:Molv NIH 3T3 cancer cells in deionized water for 120 s; d) NIH 3T3 normal cells in deionized water for 120 s. Scale bar = 25 µm.
Figure 3.
a) Percent variation of the diameter (D) of K:Molv NIH 3T3 cancer cells (circles) and NIH 3T3 normal cells (squares) when imaging their membranes in the hyposmotic solution (n = 30); b) Variation of the real part of the impedance (Z’) at 20 kHz with time induced by cell swelling in the hyposmotic solution. The microelectrodes were incubated with 103 K:Molv NIH 3T3 cancer cells (solid line) or NIH 3T3 normal cells (dotted line) for 20 minutes.
To demonstrate whether this transducer can distinguish these cancer cells from the normal cells by impedance measurements at a fixed time, the same experiment was repeated to measure Z’ with various cancer cell concentrations at t = 120 s. A plot of Z’ versus the number of K:Molv NIH 3T3 cancer cells shows that Z’ increases linearly as the number of the cancer cells increases (circles in Fig. 4a, y = 1.1x + 0.1, r2 = 0.99), and the limit of detection, as two times the standard deviation of the blank signal, was two cancer cells. By the same detection procedure, normal NIH 3T3 cells show no linear response even at high concentrations compared to the cancer cells (triangles in Fig. 4a). These results suggest that K:Molv NIH 3T3 cancer cells can be easily differentiated from NIH 3T3 normal cells on this sensing platform. Moreover, due to significant difference in the impedimetric signal between these cancer cells and normal cells, it should be possible to detect the cancer cells in samples containing both cancer and normal cells. Indeed, in practical medical conditions real tissue samples contain both normal and cancer cells, and the detection of a small number of cancer cells in the presence of an excess of normal cells can be critical for cancer diagnosis, especially at an early stage. To examine the capability of detecting cancer cells in samples containing an excess number of normal cells, samples of K:Molv NIH 3T3 cancer cells were spiked into 103 normal NIH 3T3 cells and examined by the impedimetric transducer. In Figure 4b, the Z’ plot of the cancer cells with an excess of the normal cells resulted in a linear fit (y = 1.1x + 0.5, r2 = 0.99) with the same sensitivity (1.1 kΩ/cell) as the one obtained in the plot for the neat cancer cell detection. The dotted line in this figure shows the background signal contributed from the neat normal cells, which is negligible compared to the impedimetric signal of the cancer cells. This result indicates that cancer cells can be selectively detected in a sample containing normal cells by comparing the signals of suspicious and normal tissue samples.
Since this detection system succeeded in detecting the model cancer cells, we expanded the concept to the detection of real cancer cells from tissues of different origins. To demonstrate this possibility, spiked samples containing normal and cancerous kidney cells as well as spiked samples containing normal and cancerous ovarian cells were measured by the impedimetric transducer after the hyposmotic stress was applied. In Figure 4c, the presence of kidney cancer cells is clearly distinguished from the 103 normal cells in a wide range of cancer cell concentrations, and the linear relation between Z’ and the number of kidney cancer cells is fitted as y = 0.7x + 0.0, r2 = 0.99. In Figure 4d, ovarian cancer cells are also differentiated from 103 normal cells, and the linear fit between Z’ and the number of ovarian cancer cells is y = 0.5x + 0.0, r2 = 0.96. In both cases, the dotted lines, the background signal contributed from the neat normal cells, are also negligible as compared to the impedimetric signals of the cancer cells, as observed in the case of K:Molv NIH 3T3 cancer cells. These results suggest that the proposed detection system measuring the impedance change of swelling cancer cells between the electrodes has potential to identify different types of cancer cells regardless of the tissues of origins, therefore circumventing the need for finding specific biomarkers to diagnose cancer types.
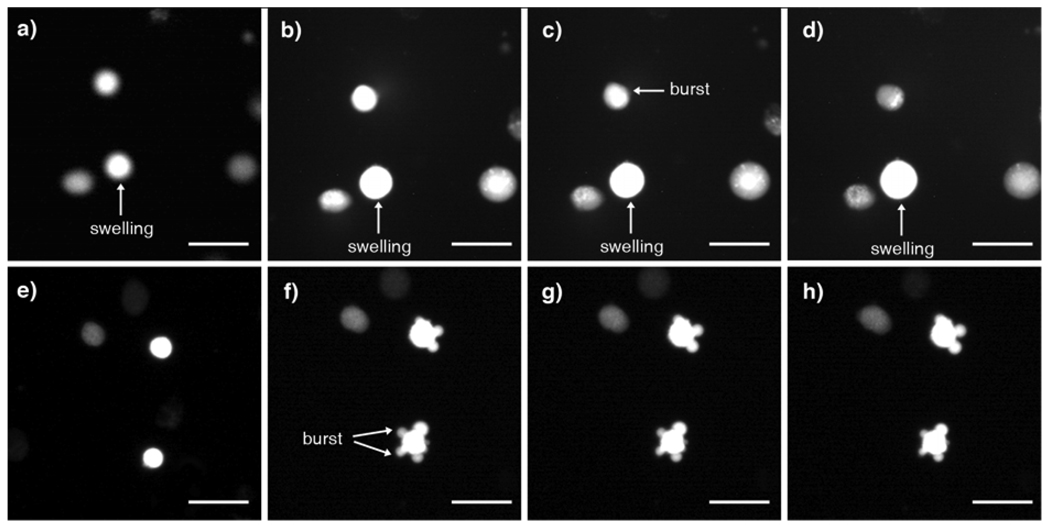
In Figure 2, the membranes of K:Molv NIH 3T3 cancer cells were observed to increase their volume more rapidly than NIH 3T3 normal cells in response to the hyposmotic stress. To further investigate the swelling mechanism of these cancer cells, the volume change of the cells was monitored by optical imaging when the cytoplasms were stained. In Figures 5a – 5d, after washing with deionized water the bright field images show that the cell diameter increased, thus suggesting that the volume of the cancer cells increased. A cell above the swelling cell has burst already and it lost contrast with time by liberating the diluted content of the cytoplasm in all directions. In comparison, for normal cells the cytoplasms were extruded outwards through breaking points of the membrane but the cell size was maintained (Figs. 5e – 5h). This observation is consistent with the previous observation that normal cells are less elastic5 since stiff or brittle materials tend to crack without swelling under high hyposmotic stress. Although cells could form blebs in response to the hyposmotic stress by deforming and rupturing the plasma membrane from the cytoskeleton to form protuberances,14 Figure 2 shows no deformation of stained membranes for both K:Molv NIH 3T3 cancer cells and NIH 3T3 normal cells. Blebbing was not detected in our systems probably due to the aggressive changes in osmolarity induced by switching the medium to deionized water abruptly. Under this condition, cells burst without blebbing in Figures 5f – 5h, thus maintaining the same size during the measurement.
Figure 5.
Fluorescence micrographs of stained cytoplasms of the cancer cells and the normal cells after applying the hyposmotic pressure by substituting the culture medium solution for deionized water; Swelling of K:Molv NIH 3T3 cancer cells after a) 0 s, b) 5 s, c) 10 s, d) 30 s: A constant size of NIH 3T3 normal cells after e) 0 s, f) 5 s, g) 10 s, h) 30 s. Scale bar = 25 µm.
It is well accepted that the dielectric properties of cells can be modeled by considering them as an electrolyte solution (cytoplasm) confined by a dielectric shell (plasma membrane).15 In this single-shell model, cells are considered as purely insulating particles upon the application of an AC field of frequencies up to ca. 1 MHz,16 and the presence of the cells on the interdigitated electrodes deviates the paths of the currents and electric field, thus increasing the electrode cell constant based on the relation:17
k = Rsol/ρ
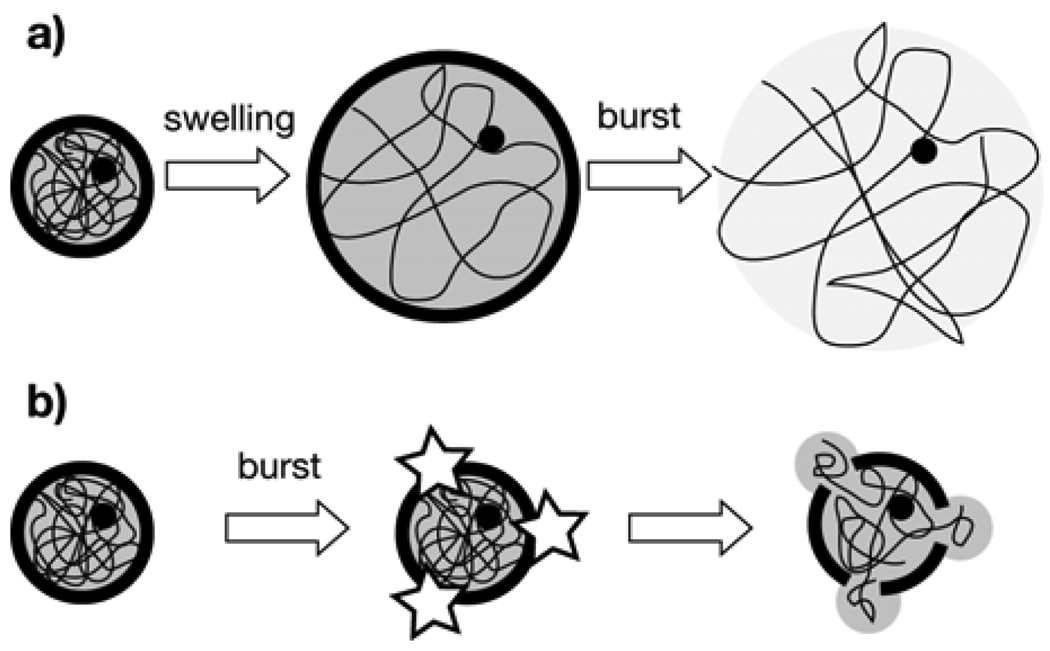
where k is the electrode cell constant, Rsol is the resistance of the solution between the electrodes, and ρ is the resistivity of the solution. When the impedance is measured at 20 kHz, the interdigitated electrodes used here mainly monitor the resistance of the solution13 and cells can be considered insulating objects. Under this condition the variation of the impedance is mainly due to the size and the surface coverage of cells.10 If the hyposmotic stress induces the swelling of K:Molv NIH 3T3 cancer cells and their volumes increase as observed in Figure 3a (circles), it is consistent with the proposed transduction mechanism that the resistance of the solution increases with time, as shown in Figure 3b. It should be noted that the impedance decrease due to the release of intercellular ions is marginal as compared to the increase of the impedance due to volume expansion because the major release of ions via swelling should have decreased the impedance, which is contrary to the observed trend. By contrast, normal NIH 3T3 cells quickly burst under hypoosmotic pressure due to their less deformable nature (Figs. 5e – 5f) with less significant volume change (squares in Fig. 3a). The AC field can penetrate the burst cell and a residual signal that is difficult to differentiate from the ambient noise is observed in Fig. 3b. Furthermore, this large difference between the signal generated by cancer and normal cells makes it possible to detect the cancer cells in spiked samples in Figures 4b – d. As stated above, the cancer cells examined in this report seem to be more elastic than the normal cells5–7 and this elasticity helps these cancer cells withstand the increased internal pressure by swelling, as summarized in Figure 6a. On the other hand, the stiffer normal cells cannot adjust their cell volume against the internal pressure change as an abrupt decrease in the ion content of the medium is applied, as shown in Figure 6b. It is noteworthy that three different types of cancer cells with very different morphology, origin, and genetic profile behaved in a similar way against the high hyposmotic stress, and all these cells could be assayed by the impedimetric transducer (Figs. 4b – 4d). However, the difference in the sensitivities of the assays among these cells is unclear due to the large differences in cellular structure, and further investigation is underway to grasp insight into these phenomena.
Figure 6.
Scheme of the physiological changes of cancer and non-cancer cells examined in this work in deionized water; a) elastic cancer cells first swell and then burst, thus liberating the diluted content of the cytoplasm in all directions; b) stiff normal cells burst quickly and the cytoplasm is expelled out slowly through the membrane cracks as a viscous, non-diluted hydrogel.
Conclusions
In summary, the impedimetric transducer could detect K:Molv NIH 3T3 cells, 786-O human kidney carcinoma cells, and MPSC-1 ovarian cancer cells by measuring their dynamic volume increases under the hyposmotic stress with the impedance change between interdigitated electrodes at high frequency. When these cells are exposed to pure water, the internal pressure swells soft cancer cells progressively without bursting in a 2-min time frame, whereas the stiffer normal cells cannot change their volume because their membranes are quickly damaged without swelling. The proposed label-free sensing methodology of cancer cells could be applicable to the fast and reliable detection of circulating tumor cells,18,19 or the screening of large populations of tissue samples before performing time-consuming genomic and proteomic profiling protocols. It should be noted that the electrodes used as transducers are compatible with established silicon microfabrication technologies, and thus this transducer can be mass-scale produced and implemented in complex circuits and microprocessors.13
Acknowledgements
This work was supported by the National Science Foundation (sensor fabrication, biological materials) under Award No. ECCS-082390 and by the U.S. Department of Energy (AC impedance analysis) under Award No. DE-FG-02-01ER45935. Hunter College infrastructure is supported by the National Institutes of Health, the RCMI program (G12-RR003037-245476). We thank Jerry S. H. Lee and Christopher M. Hale for the donation of OSE and MPSC-1 cells and David Foster for the donation of HEK 293 and 786-O cells. R.R. acknowledges a post-doctoral scholarship from the Spanish Ministerio de Ciencia en Innovación and Fundación Española para la Ciencia y la Tecnología. ST acknowledges support form the Cornell CTSC UL1-RR024996.
References
- 1. Data obtained from the American Cancer Society at http://www.cancer.org/docroot/home/index.asp.
- 2.Wulfkuhle JD, Liotta LA, Petricoin EF. Nat. Rev. Cancer. 2003;3:267–275. doi: 10.1038/nrc1043. [DOI] [PubMed] [Google Scholar]
- 3.Perkel JM. Science. 2008;319:1853–1855. [Google Scholar]
- 4.Sawyers CL. Nature. 2008;452:548–552. doi: 10.1038/nature06913. [DOI] [PubMed] [Google Scholar]
- 5.Cross SE, Jin YS, Rao J, Gimzewski JK. Nat. Nanotechnol. 2007;2:780–783. doi: 10.1038/nnano.2007.388. [DOI] [PubMed] [Google Scholar]
- 6.Bao L, Zhan Y, Lu C. Anal. Chem. 2008;80:7714–7719. doi: 10.1021/ac801060t. [DOI] [PubMed] [Google Scholar]
- 7.Guck J, Schinkinger S, Lincoln B, Wottawah F, Ebert S, Romeyke M, Lenz D, Erickson HM, Ananthakrishnan R, Mitchell D, Kas J, Ulvick S, Bilby C. Biophys. J. 2005;88:3689–3698. doi: 10.1529/biophysj.104.045476. [DOI] [PMC free article] [PubMed] [Google Scholar]
- 8.Spagnoli C, Beyder A, Besch S, Sachs F. Phys. Rev. E. 2008;78:031916. doi: 10.1103/PhysRevE.78.031916. [DOI] [PMC free article] [PubMed] [Google Scholar]
- 9.Kiesel M, Reuss R, Endter J, Zimmermann D, Zimmermann H, Shirakashi R, Bamberg E, Zimmermann U, Sukhorukov VL. Biophys. J. 2006;90:4720–4729. doi: 10.1529/biophysj.105.078725. [DOI] [PMC free article] [PubMed] [Google Scholar]
- 10.de la Rica R, Baldi A, Fernandez-Sanchez C, Matsui H. Anal. Chem. 2009;81:3830–3835. doi: 10.1021/ac9001854. [DOI] [PMC free article] [PubMed] [Google Scholar]
- 11.Gazin C, Wajapeyee N, Gobeil S, Virbasius CM, Green MR. Nature. 2007;449:1073–1077. doi: 10.1038/nature06251. [DOI] [PMC free article] [PubMed] [Google Scholar]
- 12.Giehl K. Biol. Chem. 2005;386:193–205. doi: 10.1515/BC.2005.025. [DOI] [PubMed] [Google Scholar]
- 13.de la Rica R, Fernandez-Sanchez C, Baldi A. Electrochem. Commun. 2006;8:1239–1244. [Google Scholar]
- 14.Charras GT, Yarrow JC, Horton MA, Mahadevan L, Mitchison TJ. Nature. 2005;435:365–369. doi: 10.1038/nature03550. [DOI] [PMC free article] [PubMed] [Google Scholar]
- 15.Markx GH, Davey CL. Enzyme Microb. Technol. 1999;25:161–171. [Google Scholar]
- 16.Cheung K, Gawad S, Renaud P. Cytometry A. 2005;65A:124–132. doi: 10.1002/cyto.a.20141. [DOI] [PubMed] [Google Scholar]
- 17.de la Rica R, Fernandez-Sanchez C, Baldi A. Appl. Phys. Lett. 2007;90:174104. [Google Scholar]
- 18.Nagrath S, Sequist LV, Maheswaran S, Bell DW, Irimia D, Ulkus L, Smith MR, Kwak EL, Digumarthy S, Muzikansky A, Ryan P, Balis UJ, Tompkins RG, Haber DA, Toner M. Nature. 2007;450:1235–1239. doi: 10.1038/nature06385. [DOI] [PMC free article] [PubMed] [Google Scholar]
- 19.Talasaz AH, Powell AA, Huber DE, Berbee JG, Roh KH, Yu W, Xiao WZ, Davis MM, Pease RF, Mindrinos MN, Jeffrey SS, Davis RW. Proc. Natl. Acad. Sci. USA. 2009;106:3970–3975. doi: 10.1073/pnas.0813188106. [DOI] [PMC free article] [PubMed] [Google Scholar]


