Abstract
Carbon-on-metal substrates consist of a surface plasmon-conducting metal substrate with a thin amorphous carbon overlayer. Recently, oligonucleotide arrays were in situ synthesized on carbon-on-gold substrates and DNA hybridization experiments were monitored with surface plasmon resonance (SPR) imaging. We describe here the thorough characterization of these substrates and arrays as they progress through the fabrication process. Two surface plasmon conducting metals, gold and silver, were utilized in the carbon-on-metal substrate preparation and their SPR responses compared. Oligonucleotide arrays synthesized on the carbon-on-metal substrates were analyzed with fluorescence- and SPR-based measurements. The stability of the carbon-on-metal substrates when exposed to prolonged incubations and/or serial hybridizations was also determined.
Introduction
Oligonucleotide arrays provide an efficient means of monitoring multiple hybridization-based reactions in a parallel and multiplexed manner on a single platform. The high-throughput nature of the oligonucleotide array format has afforded genome-wide studies of gene expression,1–3 methylation,4 and protein-DNA interactions,5,6 as well as large scale single nucleotide polymorphism genotyping. 7–9
When constructing an oligonucleotide array, it is important to select a substrate and attachment chemistry that is compatible with the fabrication and analysis requirements. A number of such systems have been utilized in oligonucleotide array fabrication: silanized glass, self-assembled monolayers on gold, and covalently modified silicon and carbon.10,11 Carbon-based materials such as nano-crystalline diamond, glassy carbon, and amorphous carbon thin films are desirable substrates as they exhibit superior chemical stability over their silicon, glass, and gold analogs.11–14 Amorphous carbon thin films are of particular interest as they are easily integrated with a wide variety of other materials, due to their room-temperature deposition process. Amorphous carbon thin films have recently been applied to electrodes,15,16 micromechanical devices,13 and surface plasmon resonance (SPR)-compatible gold films.17
Previously, carbon-on-metal films were fabricated and utilized in SPR imaging experiments.17 The carbon-on-metal substrates are a lamellar structure in which a thin layer of amorphous carbon is deposited onto a surface plasmon-active metal thin film. This report focuses on the chemical and optical properties of the carbon-on-metal substrates, and is presented in the following three segments: chemical characterization of the carbon-on-metal substrates during preparation, evaluation of oligonucleotide arrays prepared on the carbon-on-metal substrates for fluorescence-based experiments, and optical characterization and optimization of the carbon-on-metal substrates for surface plasmon resonance detection.
The carbon-on-metal substrates were monitored with X-ray photoelectron (XP) and infrared measurements prior to any modification and after each of the preparation steps: hydrogen plasma treatment and functionalization of the surface with terminal hydroxyl groups. Hydroxyl groups are needed for in situ oligonucleotide synthesis and thus were quantified at each step in the preparation process.
Oligonucleotide arrays were synthesized on carbon-on-metal and glass substrates, hybridized with their fluorescently labeled complements, and fluorescence images obtained. The average feature fluorescence, the average background fluorescence, and the fluorescence uniformity of the features were determined from the fluorescence images. The average hybridization density of each array was also determined. The stabilities of oligonucleotide arrays synthesized on carbon-on-metal and glass substrates were also determined under prolonged incubation at elevated temperatures or when exposed to multiple hybridization and dehybridization cycles.
The carbon-on-metal substrates were also evaluated with surface plasmon resonance imaging techniques. A series of theoretical calculations were performed to determine the maximum SPR sensitivity for carbon-on-metal substrates when the underlying metal was gold or silver. This model guided the fabrication and experimental confirmation of the sensitivity attainable with carbon-on-gold and carbon-on-silver substrates. Lastly, oligonucleotide arrays were synthesized on the carbon-on-gold and carbon-on-silver substrates and hybridization monitored with SPR imaging.
Materials and Methods
Substrate Preparation
The fabrication and preparation of the carbon-on-metal substrates for the in situ synthesis of oligonucleotide arrays has been previously described in detail,17 and is outlined in Scheme 1.
Scheme 1.
Carbon-on-Metal Fabrication
Briefly, a 44.0nm gold film with a 2.0nm chromium underlayer or a 41.0nm silver film with a 2.0nm chromium underlayer was deposited onto high index glass (SF10, Schott Glass) substrates using an Angstrom Engineering Åmod metal evaporator. Next, 7.5nm of amorphous carbon was dc-magnetron sputtered (Denton Vacuum) onto the substrates. Prior to oligonucleotide array fabrication, the carbon-on-metal substrates were chemically functionalized, using previously reported methods.12,17 Each substrate was hydrogen-terminated, 9-decen-1-ol molecules were attached to the substrate via a UV photochemical reaction, the substrates were thoroughly rinsed with ethanol and deionized (DI) water, dried under nitrogen and stored in a desiccator until needed.
The preparation of the hydroxyl-terminated glass substrates used in this work has been previously described in detail.12 ArrayIt SMC Superclean glass slides (Telechem International, Inc) were silanized in an ethanol solution containing 0.1% acetic acid and 2% (v/v) N-(3-triethoxysilylpropyl)-4-hydroxy-butyramide (Gelest Inc) for four hours. The slides were rinsed, dipped in diethyl ether, and cured under vacuum overnight before usage.
Substrate Characterization
The carbon-on-metal substrates were characterized using several surface and optical techniques to determine the chemical composition and the optical properties of the substrate.
Polarization-modulation Fourier transform infrared reflection-absorption (PM-FTIRRAS) 18 spectra were obtained on a Bruker PMA50 spectrometer equipped with real-time interferogram sampling electronics (GWC Technologies, Inc). Spectra were collected at 85° from surface normal with a 4cm−1 resolution. PM-FTIRRAS spectra are the average of measurements made on at least three separate amorphous carbon substrates.
XP spectra were collected on a Perkin Elmer PHI5400 ESCA spectrometer with a magnesium Kα (1253.6 eV) source 45° from the surface normal at a 10−9 Torr base pressure. Atomic area ratios were determined with CASA XPS software by fitting the raw data to Voigt functions after Shirley baseline correction19 and applying predetermined atomic sensitivity factors.20 Reported atomic composition values are the average of measurements made on at least three separate amorphous carbon substrates.
Surface plasmon resonance (SPR) images were obtained on a SPR Imager II (GWC Technologies). Here, collimated p-polarized light from a white light source is passed through a flow cell/carbon-on-metal substrate/prism assembly at a fixed angle. The light reflected from this assembly is collected through an 830 nm narrow band-pass filter onto a CCD camera. Data obtained from this instrument was analyzed with the V++ software package (Digital Optics). A detailed description of the SPR imager can be found elsewhere.21 SPR imaging reflectivity data are the average of measurements made on at least three separate amorphous carbon substrates.
Hydroxyl Derivatization
Trifluoroacetyl esters of surface hydroxyl groups were formed and quantified using a modification of a previously reported procedure.22 Trifluoroacetic anhydride (TFAA) was purchased from Sigma Aldrich and used without further purification. The carbon-on-metal substrates and 200μL of TFAA were placed in a 1 dram glass container and sealed. The substrates were placed in the glass container such that they never came in contact with liquid TFAA. The glass container was then heated to 45°C, allowing the TFAA to enter the gas phase and form trifluoroacetyl esters with the surface hydroxyl groups. After 12 hours of reaction time the substrates were removed from their container and placed under vacuum for 4 hours, removing any excess TFAA.
Oligonucleotide Array Fabrication
Oligonucleotide arrays were fabricated using a previously described light-directed photographic synthesis method, which utilizes maskless array synthesis (MAS) technology and allows each oligonucleotide sequence to be synthesized in a base-by-base manner. Syntheses were performed with oligonucleotide bases modified with a photolabile 3′-nitrophenylpropyloxycarbonyl (NPPOC)-protecting group and a digital micromirror based Biological Exposure and Synthesis System connected to a Perspective Biosystems Expedite Nucleic Acid Synthesis System.23 A detailed description of the synthesis conditions utilized in this work has been described previously.12,17
The probe oligonucleotide sequences used in this work are summarized in Table 1. Each probe oligonucleotide is separated from the surface by a 10 thymidine (dT) spacer, increasing hybridization efficiency.24
Table 1.
Oligonucleotides
| Sequence (5′ → 3′) | |
|---|---|
| Probe 1 | CCACTGTTGCAAAGTTATT (T)10--| |
| Probe 2 | CGCTTCTGTATCTATATCATCA (T)10--| |
| Complement 1 | AATAACTTTGCAACAGTGG- |
| AATAACTTTGCAACAGTGG | |
| Complement 2 | TGATGAATATAGATACAGAAGCG- |
| TGATGAATATAGATACAGAAGCG |
Probe oligonucleotides used in this work were synthesized directly onto hydroxyl-terminated substrates (3′ → 5′ direction) using NPPOC-protected phosphoramidite bases and in situ maskless array synthetic methods. Each probe oligonucleotide is separated from the surface (–|) by 10 thymidine (dT) residues. Complement oligonucleotides were synthesized using standard phosphoramidite chemistries. Complement oligonucleotides with 3′-fluorophore modifications were used in fluorescence-based experiments and complement oligonucleotides without 3′-modifications were used in SPR-based experiments. Complement 1 is modified with a 3′-fluorescein moiety and Complement 2 with a 3′-Cy5 moiety.
Oligonucleotide Array Analysis
Complementary oligonucleotides were synthesized by Integrated DNA Technologies using standard phosphoramidite chemistries (Complement 1 and 2, Table 1). Oligonucleotide sequences with a 3′-fluorophore were used in fluorescence-based experiments while those with no 3′-modification were used in SPR experiments. Complement 1 is modified with a 3′-fluorescein (36-FAM) moiety and Complement 2 with a 3′-Cy5 (3Cy5Sp) moiety.
Fluorescence analysis
Oligonucleotide arrays were hybridized by placing 40 μL of the fluorescently labeled complement in 1×SSPE buffer (2μM total oligonucleotide concentration, 1xSSPE buffer contains 150mM NaCl, 10mM NaH2PO4, 1mM EDTA) on the surface, covering with a glass coverslip, and incubating the surface at room temperature for 30 minutes in a humid chamber. Non-specifically bound complementary oligonucleotides were removed by incubating the surface in 1xSSPE buffer for five minutes at 37°C. Once hybridized each surface was imaged in a GeneTAC UC4×4 Scanner (Genomic Solutions). Arrays were dehybridized by incubating the surface in 8M urea at room temperature for 30 minutes.
The hybridization density of each array was determined using a previously published wash-off method.25 Oligonucleotide arrays were hybridized with fluorescently labeled complement, the non-specifically bound oligonucleotides removed, and then each array dehybridized by incubation in 2mL of 8M urea. The fluorescence intensity of the urea solutions are compared to calibration (10−11–10−8 M) solutions and the hybridization densities calculated from these values.
SPR imaging analysis
Oligonucleotides arrays were exposed to a 1×SSPE solution and a reference image was collected before exposing the arrays to the complementary oligonucleotides (Complement 1and 2 in 1×SSPE buffer, Table 1). After hybridization, images were acquired and then subtracted from the reference image. Intensity changes in these images are reported in units of Δ%R, which corresponds to the percent reflectivity change.
Substrate Stability Experiments
The thermal stability and reusability of oligonucleotide arrays synthesized on carbon-on-gold and glass substrates was evaluated. Thermal stability was determined by incubating the oligonucleotide arrays in 40mL of pre-warmed (37°C or 60°C) 1×SSPE buffer in a 50mL Falcon tube fitted with a stir vane. Prior to incubation, fluorescence images were obtained. The oligonucleotide arrays were removed at various time points over an 18-hour period, rehybridized with fluorescently labeled complement, and a fluorescence image obtained.
Oligonucleotide array reusability was determined through a series of 15 hybridization/dehybridization cycles. Here, the oligonucleotide array was hybridized with fluorescently labeled complement, rinsed, a fluorescence image obtained, and the array was then dehybridized in 8M urea. Complete dehybridization was determined by obtaining a fluorescence image of the array after each incubation in 8M urea.
The oligonucleotide arrays used in the incubation and hybridization experiments are composed of 36 features of Probe 1 (Table 1). The data presented for the 37°C incubation, 60°C incubation and serial hybridization experiments are the average fluorescence of all 36 features on three separate arrays.
Results and Discussion
Carbon-on-metal Preparation and Characterization
The chemical composition of the amorphous carbon overlayer of carbon-on-gold substrates was characterized throughout the preparation process (Scheme 1) with XP (survey and high resolution) and infrared measurements. Each substrate was characterized (1) directly after the amorphous carbon overlayer was applied, (2) directly after hydrogen plasma treatment, and (3) after 9-decen-1-ol was attached to the substrate and thoroughly washed to remove unreacted/non-specifically bound alkene molecules. These three time points will be henceforth referred to as (1) untreated, (2) hydrogen-treated, and (3) hydroxyl-terminated. The XP and infrared spectra afford a quantitative measure of the oxygen content, a means of identifying the oxygen-containing functional groups, and a quantitative measure of the amount of hydroxyl groups present on the surface at each step in the preparation process.
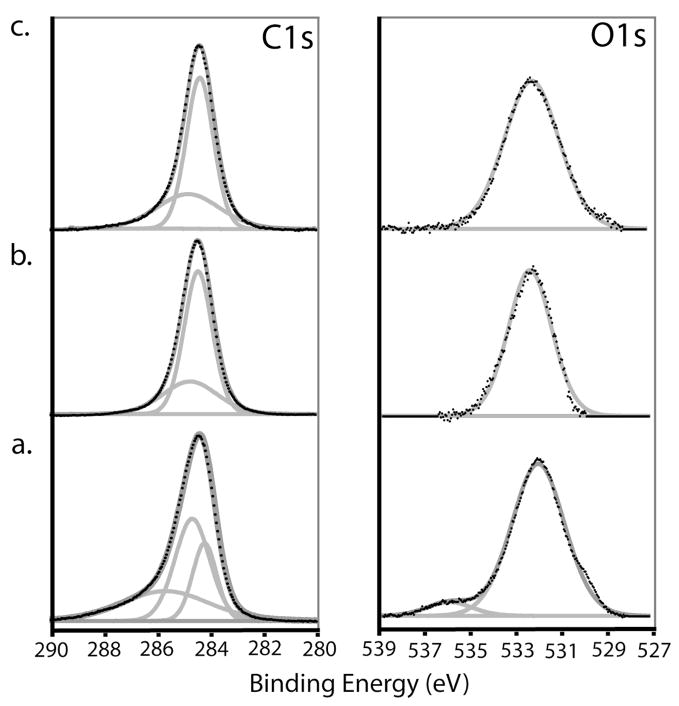
Carbon-on-metal substrates are prepared by depositing a layer of amorphous carbon onto an SPR-active substrate containing either a gold or silver underlayer. The amorphous carbon films were deposited by dc-magnetron sputtering a graphite source under vacuum, with a base pressure of no greater than 5×10⁻⁶ Torr. The composition of the amorphous carbon films is highly dependent on the chamber’s base pressure at the time of deposition, as pressure differences introduce varying amounts of nitrogen and oxygen into the film. XP survey and high-resolution spectra of the C1s and O1s were obtained. Four carbon-on-gold substrates prepared at different times were analyzed and found to contain oxygen-to-carbon and nitrogen-to-carbon ratios of 0.156 ± 0.028 and 0.015 ± 0.005, respectively. Figure 1 contains representative C1s and O1s high-resolution XP spectra. The C1s peak was fitted with three components (Figure 1a, gray lines) at 284.6, 285.1, and 286.2 eV. The first peak is attributed to C-C bonds and is consistent with those found in other amorphous carbon samples.26,27 The higher binding energy components are attributed to carbon-oxygen bonds of oxidized carbon species. The O1s peak was fitted with two components at 532.4 and 536.7eV, which were attributed to O-C and O=C bonds.28,29
Figure 1.
High-resolution XP spectra of the C1s and O1s region of an (a) untreated carbon-on-gold substrate, (b) after hydrogen plasma treatment, and (c) after hydroxyl termination with 9-decen-1-ol.
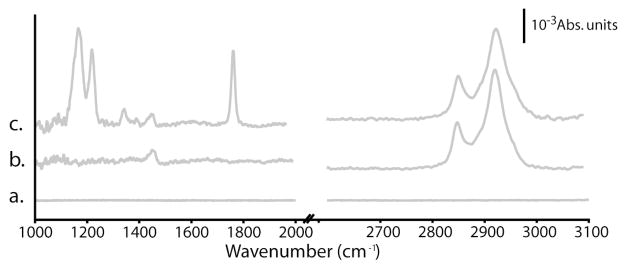
Infrared spectroscopic methods are also very useful for evaluating the functional groups present on a surface. Here, PM-FTIRRAS methods were utilized as they are capable of detecting sub-monolayer coverage.18 A weak carbonyl (~1740 cm−1) peak is sometimes detected on the carbon-on-metal substrates, and is attributed to variable oxygen levels present in the sputtering chamber at the time of carbon deposition. The four amorphous carbon substrates used in this study did not contain any initial carbonyl signatures.
The carbon-on-metal substrates are then treated in a RF-generated hydrogen plasma, which not only hydrogen-terminates the carbon films but also reduces the heterogeneity between films prepared at different times. XP survey spectra revealed that hydrogen treatment reduced the oxygen content by half (oxygen-to-carbon ratio of 0.067 ± 0.010) and removed any detectable nitrogen. Hydrogen-treatment reduced the number of components in the C1s high-resolution XP spectra (Figure 1b), indicating the surface contains C-C and C-O bonds (284.8 and 285.2 eV). The O1s peak of the H-treated films contains a 532.1eV component indicating the hydrogen plasma either removed and/or reduced surface-bound carbonyl groups. PM-FTIRRAS measurements revealed no functional groups for the hydrogen-treated carbon-on-metal substrates (Figure 2a).
Figure 2.
PM-FTIRRAS spectra of carbon-on-gold substrates after (a) hydrogen plasma treatment, (b) hydroxyl termination via the reaction of 9-decen-1-ol, and (c) labeling of the hydroxyl groups with TFAA.
It should be noted that removing the oxygen species from the amorphous carbon thin films does have its consequences. Colavita et al have recently shown that the photochemical attachment of alkene-containing molecules is greatly influenced by the oxidation state of the surface.30 Oxidized carbon species reduce the surface’s overall electron affinity, promoting attachment of the alkene-containing molecules to the substrate and decreases the overall time needed for surface modification. In the present study hydrogen treatment was employed in spite of the somewhat decreased reaction kinetics, as it afforded a higher level of reproducibility.
After hydrogen plasma treatment, the carbon-on-metal substrates are chemically functionalized to contain hydroxyl groups. Here, 9-decen-1-ol was attached to the surface through an ultraviolet (UV) light-assisted reaction. The UV light is thought to promote a photo-mediated electron ejection from the surface, which in turn generates a surface-bound radical that reacts with the alkene functional group.31,32 Alkene-containing molecules have also been attached to amorphous carbon substrates via a thermally-mediated reaction.33 Both photo- and thermal-mediated attachment processes result in the formation of a carbon-carbon bond between the alkene molecule and the amorphous carbon surface.
XP survey spectra of the hydroxyl-terminated substrates showed increased oxygen-to-carbon ratio of 0.134 ± 0.012. Figure 1c is the XP high resolution spectra for C1s and O1s. The PM-FTIRRAS spectra contain two very strong peaks at 2928 and 2854 cm−1 (Figure 2b), which are attributed to the symmetric and asymmetric methylene stretches of the newly-attached monolayer. A smaller peak at 1454 cm−1, arising from methylene scissoring, is also observed. A peak corresponding to the O-H stretch of the hydroxyl group was not observed, as is often the case in surface-based infrared techniques.
The above XP and infrared data provide limited insight into the chemical functional groups present on the amorphous carbon substrates. Previous studies on carbon-based materials have identified a variety of oxygen-containing functional (hydroxyl, ether, anhydride, and lactone) groups22,28,34 with O-C bond energies centered around 532 eV,28 which is the major component of the O1s high resolution XP spectra for the untreated, H-treated, and OH-terminated carbon-on-metal substrates. The number of hydroxyl groups on the surface is of particular interest, as this is the functional group utilized in phosphoramidite-based oligonucleotide synthesis. Hydroxyl groups on the amorphous carbon surface are the point of attachment for the first nucleotide.
One strategy to identify and quantify surface functional groups is to introduce an easily detectable moiety via chemical derivatization. In the fluorescence labeling of surface species (FLOSS) technique a fluorophore is introduced onto the surface, allowing for quantification via fluorescence intensity.35,36 Langley et al have developed a series of reactions that introduce fluorine to the surface, providing quantitative XP information to determine the number of hydroxyl, carbonyl, and carboxylic acid groups on the surface.22
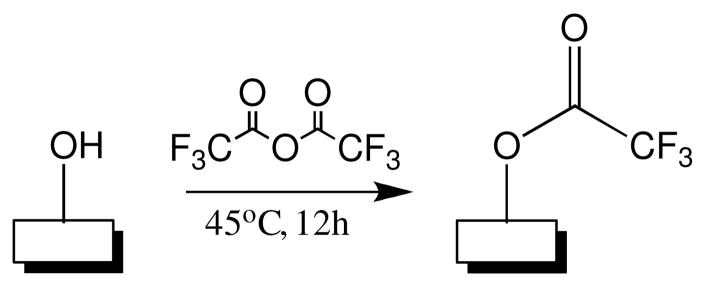
The hydroxyl groups on carbon-on-metal substrates were derivatized with trifluoroacetic anhydride (TFAA) and then analyzed with XP methods (Scheme 1). Untreated, hydrogen-treated, and hydroxyl-terminated substrates (four of each) were exposed to TFAA vapors for a period of 12 hours and then placed under vacuum for 4 additional hours to remove any non-specifically adsorbed TFAA molecules. As a negative control, bare gold substrates were similarly exposed to the TFAA vapor and analyzed.
Figure 2c shows a representative PM-FTIRRAS spectrum for a hydroxyl-terminated carbon-on-gold substrate after TFAA labeling. In addition to the methylene peaks observed in the hydroxyl-terminated substrates, four strong peaks are observed at 1788, 1352, 1222, and 1170 cm−1. The 1788 cm−1 peak is assigned to the carbonyl stretch of trifluoroester while the other three peaks are attributed to C–F stretching modes. The bare gold substrates contained no comparable infrared signatures nor was any fluorine detected in XP survey spectra.
The percent of hydroxyl groups present on each of the substrates was determined with the following equation developed by Langley, which is further explained in reference 22:
Here the percent of hydroxyl groups present (%O0,OH) on the surface is determined by comparing the fractional coverage of fluorine (θF) after the derivatization reaction to the carbon (θC0), oxygen (θO0), and fluorine (θF0) before the reaction. The θC0, θO0, and θF0 values were determined with an XP survey spectrum. θF0 is zero prior to derivatization. After the derivatization reaction the θF is determined with a second XP survey spectrum, and is directly related to the number of number of hydroxyl groups on the surface. The reaction efficiency (e) is equal to 1, which was previously determined.22
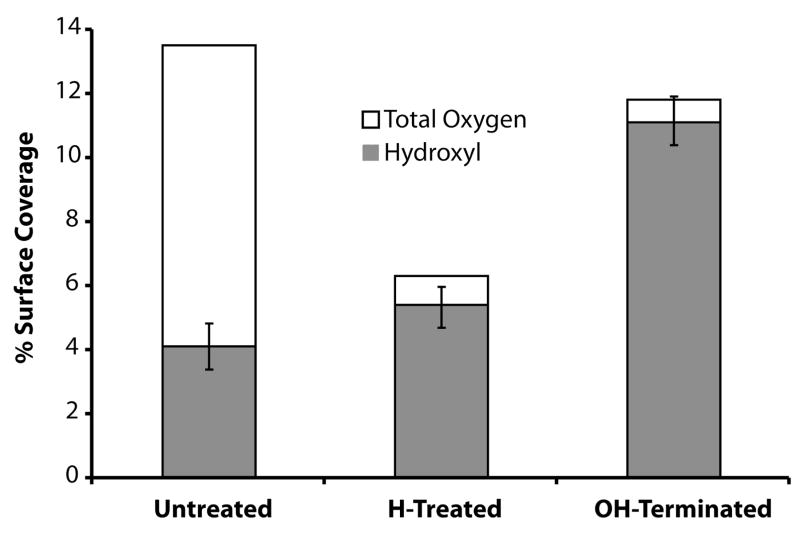
Figure 3 contains the results of the derivatization experiment. Untreated carbon-on-metal substrates contain 13.8 ± 0.8% oxygen, with the hydroxyl groups accounting for 4.13 ± 0.7% of the total surface content. Hydrogen-treatment decreases the overall amount of oxygen in the carbon film to 6.2 ± 0.9% and also marginally increases the total surface hydroxyl groups to 5.4 ± 0.7%. Functionalizing the carbon-on-metal substrate with 9-decen-1-ol greatly increases the oxygen and hydroxyl groups present on the surface to 11.8 ± 1.1 % and 11.1 ± 1.0%, respectively.
Figure 3.
Percentage of hydroxyl groups for untreated, hydrogen plasma treated, and hydroxyl terminated carbon-on-metal substrates. The surface concentration of hydroxyl groups was determined by reacting each substrate with TFAA, forming a trifluoroester on the surface. The shaded bars are the percentage of hydroxyl groups present on each substrate. The total height of each bar corresponds to the percent of oxygen present on each substrate, while the unshaded regions correspond to the percentage of oxygen that is not a hydroxyl group. The error bars were left off the percent total oxygen to simplify the figure and can be found within the text.
Oligonucleotide Array Fluorescence Comparison
Oligonucleotide arrays were synthesized in a base-by-base manner directly onto hydroxyl-terminated glass and carbon-on-metal substrates using MAS technology.23 Oligonucleotide arrays are usually synthesized on silanized glass slides and analyzed with fluorescence-based readouts.37 Hybridization-based fluorescence assays were thus chosen to compare the carbon-on-metal substrates with their glass analogs.
Figure 4 shows a section of an 88-feature array with an equal number of two different oligonucleotide sequences (Probe 1 and Probe 2, Table 1). The arrays were hybridized with fluorescently labeled complement oligonucleotides, Probe 1 features with its fluorescein-labeled complement (Complement 1) and Probe 2 features with its Cy5-labeled complement (Complement 2). Figure 4a is a computer-generated image of the array, indicating the identity of each feature. Once hybridized, a fluorescence image of the oligonucleotide array on the carbon-on-gold (Figure 4b), carbon-on-silver (Figure 4c) and glass (Figure 4d) substrates were obtained and compared. The same imaging parameters were used to image each of the arrays.
Figure 4.
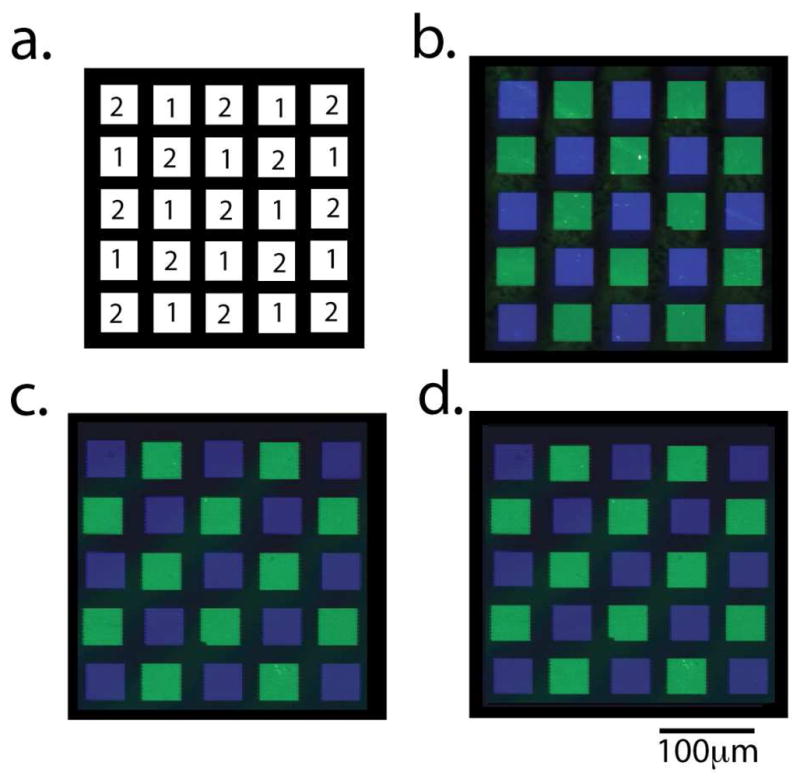
Fluorescence images of oligonucleotide arrays hybridized with their fluorescently labeled complementary oligonucleotides. (a) Computer-generated image of the array. The array contains 12 features of Probe 1 hybridized with fluorescein-labeled Complement 1 and 13 features of Probe 2 hybridized with Cy5-labeled Complement 2. Fluorescence images of the oligonucleotide arrays fabricated on (b) carbon-on-gold, (c) carbon-on-silver, and (d) glass substrates.
A total of nine oligonucleotide arrays were synthesized (on three glass, on three carbon-on-gold and on three carbon-on-silver substrates). The fluorescence images of the oligonucleotide arrays were obtained and used to calculate the average hybridized feature fluorescence intensity, the average background fluorescence, the average signal-to-noise ratio, and the average uniformity of the hybridized features. The hybridization density of each array was also obtained. This information is summarized in Table 2.
Table 2.
Oligonucleotide Array Comparisona
| Substrate |
|||
|---|---|---|---|
| Glass | Carbon-on-Gold | Carbon-on-Silver | |
| Average Background Fluorescence (RFU) | 430 ± 95 | 295 ± 60 | 215 ± 70 |
| Average Fluorescein Feature Signal (RFU) | 11985 ± 1460 | 12135 ± 1120 | 12920 ± 1460 |
| S/N Ratio | 122 | 197 | 182 |
| Fluorescein Feature Uniformity for Array (% RSD) | 2.42 ± 0.85% | 2.14 ± 0.92% | 2.82 ± 0.86% |
| Average CY5 Feature Signal (RFU) | 16325 ± 1280 | 18460 ± 1240 | 18350 ± 1005 |
| S/N Ratio | 167 | 302 | 259 |
| CY5 Feature Uniformity for Array (%RSD) | 2.46 ± 0.75% | 2.26 ± 0.99% | 3.21 ± 0.78% |
| Average Hybridization Density (1012 molecules/cm2) | 1.58 ± 0.35 | 4.22 ± 0.10 | 3.20 ± 0.40 |
Oligonucleotide arrays were synthesized on hydroxyl-terminated glass, carbon-on-gold, and carbon-on-silver substrates. Each substrate was prepared in triplicate as discussed in the Materials and Methods section. The average background fluorescence signal was determined after the arrays were hybridized with fluorescently labeled complements and is the average signal obtained from areas not containing oligonucleotide features. The average fluorescence signal is the average of oligonucleotide features after hybridized with their fluorescently labeled complement. The signal-to-noise ratio is the (average feature fluorescence – average background fluorescence)/standard deviation of the background fluorescence. Feature uniformity is the relative standard deviation in the fluorescence of a given feature. The hybridization densities were obtained by collecting the hybridization complements and comparing their fluorescence intensities to a calibration curve in a 96-well plate.25
The average fluorescence background intensity was determined by averaging the fluorescence intensities of areas on the array that did not contain oligonucleotide features. High fluorescence background intensities are often caused by nonspecific interactions between the surface and the fluorescently labeled molecule of interest. The ability to prevent such unwanted interactions can lead to an overall higher sensitivity. The fluorescence background intensities for the carbon-on-metal substrates were similar in value, 295 ± 60 relative fluorescence units (RFU) for carbon-on-gold and 215 ± 70 for carbon-on-silver. The glass substrates had slightly higher fluorescence background intensities, 430 ± 95 RFU.
There were two oligonucleotide sequences on each array; those hybridized with fluorescein-modified complementary oligonucleotides (Complement 1) and those hybridized with Cy5-modified complements (Complement 2). The carbon-on-metal substrates had marginally higher fluorescence intensities than their glass counterpart for both fluorophore molecules: fluorescein fluorescence intensity for carbon-on-metal substrates was 1.04 ± 0.19 times higher than glass; Cy5 fluorescence intensity was 1.12 ± 0.12 times higher on the carbon-on-metal substrates. Increased fluorescence intensities and lower fluorescence background intensities provide greater signal-to-noise ratios for the carbon-on-metal substrates. When comparing fluorescein fluorescence intensities, the carbon-on-gold signal-to-noise ratio (197) surpasses that of the carbon-on-silver (182) and glass substrates (122). Likewise, a similar trend is observed when comparing the signal-to-noise ratios of the carbon-on-gold (302), carbon-on-silver (259) and glass (167) for the Cy5-labeled features. Signal-to-noise ratios were calculated using:
Oligonucleotide feature uniformity is the relative standard deviation of the fluorescence intensities within a given array feature. The values reported in Table 2 are the average relative standard deviation of the Probe 1 and Probe 2 features after hybridization. Array feature uniformity is often times compromised when spotting techniques are utilized, due to the “coffee ring” stains that occur during drying.38,39 The MAS setup exposes the array to liquid during the entire synthesis process, removing any drying effects. Changes in feature uniformity on the glass and carbon-on-metal substrate are thus a function of the substrate (roughness, incomplete functionalization, etc). The feature uniformity values of Probe 1 (fluorescein-labeled) and Probe 2 (Cy5-labeled) for the glass, carbon-on-gold, and carbon-on-silver substrates that are statistically equivalent.
The hybridization density of a given oligonucleotide feature is the number of oligonucleotides accessible to hybridization per unit area. Probe 1 was used to calculate the hybridization density for the carbon-on-gold, carbon-on-silver, and glass substrates. The carbon-on-gold hybridization density was 4.22±0.10×10¹² molecules/cm2, the carbon-on-silver 3.20 ±0.40 ×10¹² molecules/cm2, and the glass substrates 1.58±0.35 ×10¹² molecules/cm2. The significant difference in hybridization density (~2-fold) observed between the carbon-on-metal surfaces and glass surface is not evident from the average feature fluorescence obtained when the substrates are fluorescently imaged after hybridization (Table 2, row 2). One possible reason for this discrepancy is the reduction in the fluorescence yield from the hybridized fluorescently-tagged oligonucleotides is due to quenching by the metal surface.40
Substrate Stability
Thermal incubation stability
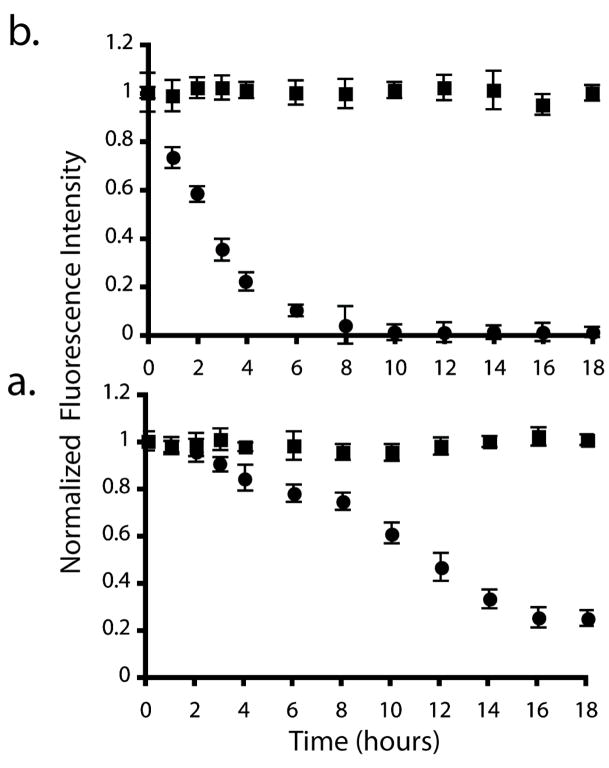
incubating oligonucleotide arrays at elevated temperatures increases hybridization specificity and also is necessary when performing enzymatic reactions on a surface. This is problematic for silanized glass substrates as increased temperatures promote siloxane bond hydrolysis,41,42 compromising the use of oligonucleotide arrays for assays requiring prolonged incubations at higher temperatures. To evaluate this issue, oligonucleotide arrays were incubated in 1×SSPE buffer for 18 hours at either 37°C or 60°C. The arrays were periodically removed from the buffer, rinsed with 1xSSPE buffer, hybridized with the fluorescein-labeled Complement 1, and imaged. Figure 5 shows normalized fluorescence intensities of the arrays incubated at 37°C (Figure 5a) and 60°C (Figure 5b). The fluorescence intensities were normalized to the initial fluorescence intensity obtained before incubation (time = 0 hours). The arrays prepared on the carbon-on-gold substrates exhibit greater stability for both conditions, similar to the results of in situ synthesized oligonucleotide arrays prepared on glassy carbon and diamond.12 After 18 hours of incubation the carbon-on-gold substrates retained 99.8% of their original fluorescence signal at both incubation temperatures. The glass substrates retained 24.8% and 0.01% of their original fluorescence when incubated for 18 hours at 37°C and 60°C, respectively. Glass substrates incubated at 60°C lost over 95% of their original fluorescence after 8 hours.
Figure 5.
Change in the normalized average feature fluorescence of oligonucleotide arrays prepared on glass (●) and carbon-on-gold (■) substrates upon incubation in 1×SSPE buffer at (a) 37°C and (b) 60°C. The fluorescence values are normalized to the initial fluorescence intensity at time = 0 hours. These data are the average of three substrates, each containing 36 features of Probe 1.
Serial hybridization stability
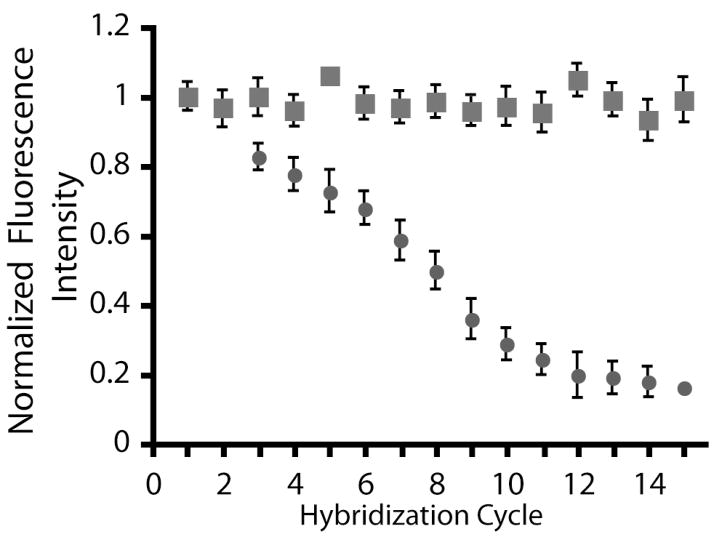
once an oligonucleotide array is hybridized, the complementary sequences are dehybridized thermally or with solutions containing high urea concentrations. The ability to reuse oligonucleotide arrays not only introduces cost-savings to the end user but also reduces array-to-array variance. The oligonucleotide arrays were subjected to the following cycle, which was repeated 15 times: arrays were hybridized with their fluorescence complement; a fluorescence image of the hybridized array was obtained; the array was incubated in an 8M urea solution for 20 minutes to remove the fluorescently-labeled complement; and a fluorescence image was obtained to ensure the array had been completely dehybridized. Figure 6 is the average normalized array fluorescence as a function of hybridization cycle. The fluorescence intensities are normalized to the fluorescence intensity at the first hybridization. The carbon-on-gold substrates retain 98.8% of their original fluorescence intensity after 15 hybridization cycles while the glass substrates only retain 24.8%. The stability of the in situ synthesized arrays on carbon-on-gold substrates agrees with that found by Sun et al for spotted oligonucleotide arrays.13
Figure 6.
Change in the average feature fluorescence of oligonucleotide arrays prepared on glass (●) and carbon-on-gold (■) substrates following multiple hybridization and dehybridization cycles. The fluorescence values are normalized to the initial hybridization. These data are the average of three substrates, each containing 36 features of Probe 1.
Surface Plasmon Resonance Applications
Carbon-on-gold substrates have been previously used to monitor DNA-DNA and DNA-protein interactions with SPR imaging techniques.17 The carbon-on-metal substrates provide the chemical robustness needed for in situ oligonucleotide synthesis. This increased stability comes with a cost, namely reduced sensitivity. Sputtered amorphous carbon thin film’s dielectric function reduces photon-plasmon coupling due to light absorption by the film in the visible region of the electromagnetic spectrum. It has been shown previously that a 7.5nm layer of carbon results in an overall 30% loss in sensitivity loss when compared to the bare gold analog. Silver has been proposed as a likely alternative metal as it has a higher reflectivity and lower absorption in the visible and near-infrared regions of the electromagnetic spectrum. These properties of silver reduce plasmon attenuation, improving sensitivity.41–45
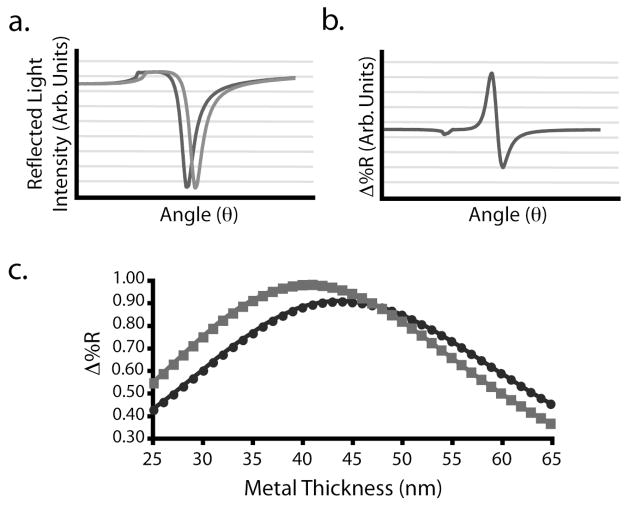
A series of n-phase Fresnel calculations were used to determine the optimal thickness of the gold and silver underlayers when a 7.5nm amorphous carbon overlayer and an 830nm light source are utilized.46 The 7.5nm amorphous carbon overlayer is the minimum thickness needed to consistently support in situ array synthesis. Thinner carbon layers often are delaminated. A wavelength of 830nm was chosen to match that used in our SPR imaging system. Figure 7a is an example of theoretical SPR response curves obtained for a carbon-on-gold substrate when exposed to a 0% and 1% (w/v) ethanol solution, corresponding to an index of refraction (nf) change of 0.0006. The difference of these two curves (Figure 7b) determines the angle corresponding to the maximum change in reflectivity. The relationship between metal thickness and reflectivity change are plotted in Figure 7c. This graph indicates that a 44.0nm thick gold film will provide the maximum change in reflectivity for a carbon-on-gold substrate and a 41.0nm thick silver film for a carbon-on-silver substrate. These optimum metal thicknesses were used for the carbon-on-metal substrates in this work, unless otherwise noted.
Figure 7.
SPR sensitivities were calculated for a 7.5 amorphous carbon layer over a variety of gold or silver thicknesses. (a) Scanning angle SPR reflectivity curves were calculated using n-phase Fresnel equations for carbon-on-metal substrates with 25 – 65nm of silver or gold under a 7.5nm amorphous carbon layer when exposed to a 0% and 1% (w/v) ethanol solution. The change in solutions corresponds to an index of refraction change (Δnf) of 0.0006. (b) The difference between reflectivity curves results in a plot of the change in reflectivity (Δ%R) as a function of angle. (c) Graph of the Δ%R attainable for various thicknesses of gold (●) and silver (■).
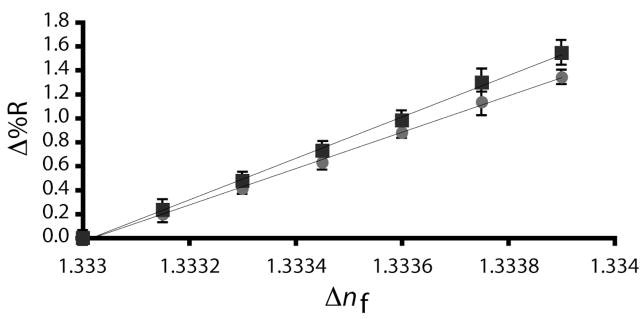
Carbon-on-gold and carbon-on-silver substrates with varying thicknesses of gold and silver (optimal thicknesses of 44.0 and 41.0nm, respectively, and ±5nm and ±10nm variations from these values) were prepared, exposed to solutions ranging from 0 – 1.5% (w/v) ethanol, the average change in reflectivity measured, and the results compared to the theoretical predictions.47 The theoretical and experimental values for an 0.0006 nf change matched, confirming that 44.0nm gold and 41.0nm silver films provided the maximum reflectivity change with 830nm light and a 7.5nm amorphous carbon thin film. Figure 8 is the experimentally obtained reflectivity change as a function of nf changes for carbon-on-metal substrates using the optimum gold and silver thickness. It should be noted that carbon-on-silver substrates are more sensitive than their gold counterparts, providing a 12 ± 0.8% larger reflectivity response for a 0.0006 nf change.
Figure 8.
Experimentally obtained changes in reflectivity (Δ%R) as a function of changing index of refraction (Δnf) for a carbon-on-gold substrate (●) with 7.5nm of amorphous carbon and 44.0nm of gold and a carbon-on-silver substrate (■) with 7.5nm of amorphous carbon and 41.0nm of silver.
The use of a silver underlayer unfortunately did not provide a sensitivity increase rivaling bare gold films. Another possible alternative would be to substitute the amorphous carbon thin film with a carbon overlayer that does not absorb light in the visible region. Nano-crystalline diamond and/or newer carbon materials such as graphene are likely alternatives, but were not explored in this work.
Oligonucleotide arrays composed of 36 features (18 features of Probe 1 and 18 features of Probe 2) were synthesized on carbon-on-gold and carbon-on-silver substrates of optimal metal thickness and hybridization was monitored with SPR imaging techniques. Figure 9 is a representative set of SPR images obtained from a carbon-on-silver substrate. Figure 9a is a schematic diagram of the oligonucleotide array and identifies each of the features. In these experiments a reference image of the array (Figure 9b) exposed to 1xSSPE buffer was obtained prior to hybridization. The array was exposed to a 500nM solution of Complement 1 in 1×SSPE for 1 minute and a second image obtained. A difference image (Figure 9c) was obtained by subtracting the reference image from the image after 1 minute of Complement 1 hybridization. Increases in reflectivity (i.e. brightness) indicate regions where DNA hybridization occurred. The array was then exposed to a 500nM solution of Complement 2 in 1×SSPE, an image was obtained after 1 minute of hybridization, and a difference image calculated by subtracting the image after Complement 1 hybridization from the image after Complement 2 hybridization (Figure 9d). SPR images were collected from arrays synthesized on three carbon-on-gold and three carbon-on-silver substrates. The average change in percent reflectivity (Δ%R) for 500nM of Complement 1 and Complement 2 is 0.58 ±0.03 for carbon on gold substrates and 0.69 ±0.02 for carbon on silver.
Figure 9.
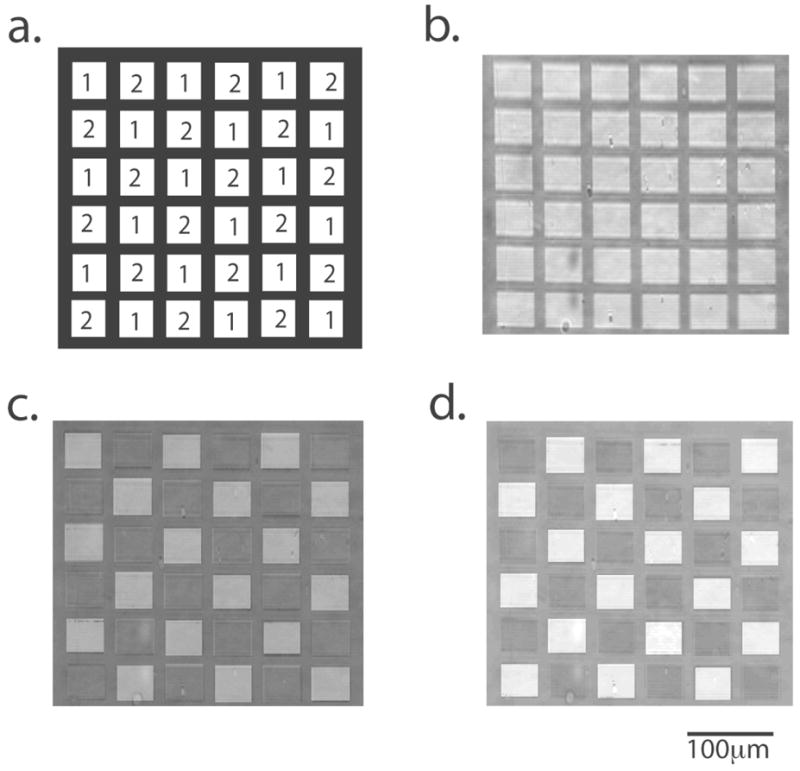
SPR images of an oligonucleotide array synthesized on a carbon-on-silver substrate. (a) Computer-generated image of the array. (b) SPR reference image of the array. (c) SPR image of the array after hybridization with Complement 1. This is a difference image, which is the image after hybridization of Complement 1 minus the reference image. (d) Difference image of the array after the hybridization of Complement 2 (minus figure 9c).
Conclusion
Carbon-on-metal substrates provide chemically robust material capable of supporting in situ oligonucleotide array synthesis that is compatible with both fluorescence- and SPR-based analysis methods. Carbon-on-metal substrates exhibit enhanced stability over their glass analogs upon prolonged incubations at elevated temperatures as well as when serially hybridized, affording a substrate compatible with a wider variety of chemical and enzymatic conditions. Oligonucleotide arrays prepared on carbon-on-metal substrates have both lower fluorescence background intensities and higher feature fluorescence intensities, providing an increased fluorescence signal-to-noise ratio over oligonucleotide arrays prepared on glass. Carbon-on-gold and carbon-on-silver substrates also support surface plasmons, enabling label-free detection of high-density oligonucleotide arrays. The addition of an amorphous carbon layer decreases the overall SPR sensitivity when compared to bare gold and/or silver substrates.
Scheme 2.
Hydroxyl Labeling Chemistry
Acknowledgments
The authors would like to thank Dr. Michael Shortreed and Justin Carlisle for their helpful suggestions and thoughtful conversations. The authors would like to thank Professor Robert Hamers for the use of his PM-FTIRRAS instrument, Dr. John Jacobs and the UW Materials Science Center for access to and usage of the XP spectrometer, and Professor Franco Cerrina for his ongoing support and assistance with MAS technology. This work was funded by NIH grant R01HG002298, NIH grant 5T32GM08349, and the University of Wisconsin Department of Chemistry. LMS has a financial interest in GWC Technologies.
References
- 1.Lucito R, Healy J, Alexander J, Reiner A, Esposito D, Chi MY, Rodgers L, Brady A, Sebat J, Troge J, West JA, Rostan S, Nguyen KCQ, Powers S, Ye KQ, Olshen A, Venkatraman E, Norton L, Wigler M. Genome Research. 2003;13(10):2291–2305. doi: 10.1101/gr.1349003. [DOI] [PMC free article] [PubMed] [Google Scholar]
- 2.Harrington CA, Rosenow C, Retief J. Current Opinion in Microbiology. 2000;3(3):281–291. doi: 10.1016/s1369-5274(00)00091-6. [DOI] [PubMed] [Google Scholar]
- 3.Schena M, Shalon D, Davis RW, Brown PO. Science. 1995;270(5235):461–470. doi: 10.1126/science.270.5235.467. [DOI] [PubMed] [Google Scholar]
- 4.Balog RP, de Souza YEP, Tang HM, DeMasellis GM, Gao B, Avila A, Gaban DJ, Mittelman D, Minna JD, Luebke KJ, Garner HR. Analytical Biochemistry. 2002;309(2):301–310. doi: 10.1016/s0003-2697(02)00294-4. [DOI] [PMC free article] [PubMed] [Google Scholar]
- 5.Bulyk ML, Gentalen E, Lockhart DJ, Church GM. Nature Biotechnology. 1999;17(6):571–577. doi: 10.1038/9878. [DOI] [PubMed] [Google Scholar]
- 6.Warren CL, Kratochvil NC, Hauschild KE, Foister S, Brezinski ML, Dervan PB, Phillips GN, Ansari AZ. Proceedings of the National Academy of Sciences of the United States of America. 2006;103(4):861–872. doi: 10.1073/pnas.0509843102. [DOI] [PMC free article] [PubMed] [Google Scholar]
- 7.Gunderson KL, Steemers FJ, Lee G, Mendoza LG, Chee MS. Nature Genetics. 2005;37(5):541–554. doi: 10.1038/ng1547. [DOI] [PubMed] [Google Scholar]
- 8.Chen Y, Shortreed MR, Olivier M, Smith LM. Analytical Chemistry. 2005;77(8):2401–2405. doi: 10.1021/ac0483825. [DOI] [PubMed] [Google Scholar]
- 9.Matsuzaki H, Loi H, Dong S, Tsai YY, Fang J, Law J, Di XJ, Liu WM, Yang G, Liu GY, Huang J, Kennedy GC, Ryder TB, Marcus GA, Walsh PS, Shriver MD, Puck JM, Jones KW, Mei R. Genome Research. 2004;14(3):411–425. doi: 10.1101/gr.2014904. [DOI] [PMC free article] [PubMed] [Google Scholar]
- 10.Topics In Current Chemistry: Immobilization of DNA on Chips I. Vol. 260 Springer Berlin; Heidelberg: 2005. [Google Scholar]
- 11.Topics In Current Chemistry: Immobilization of DNA on Chips II. Vol. 261 Springer Berlin; Heidelberg: 2005. [Google Scholar]
- 12.Phillips MF, Lockett MR, Rodesch MJ, Shortreed MR, Cerrina F, Smith LM. Nucleic Acids Research. 2008;36(1):e7. doi: 10.1093/nar/gkm1103. [DOI] [PMC free article] [PubMed] [Google Scholar]
- 13.Sun B, Colavita PE, Kim H, Lockett M, Marcus MS, Smith LM, Hamers RJ. Langmuir. 2006;22(23):9591–9605. doi: 10.1021/la061749b. [DOI] [PubMed] [Google Scholar]
- 14.Yang WS, Auciello O, Butler JE, Cai W, Carlisle JA, Gerbi J, Gruen DM, Knickerbocker T, Lasseter TL, Russell JN, Smith LM, Hamers RJ. Nature Materials. 2002;1(4):251–257. doi: 10.1038/nmat779. [DOI] [PubMed] [Google Scholar]
- 15.Hauert R. Diamond and Related Materials. 2003;12(1–7):581–589. [Google Scholar]
- 16.Luo JK, Fu YQ, Le HR, Williams JA, Spearing SM, Milne WI. Journal of Micromechanics and Microengineering. 2007;17(7):S147–S163. [Google Scholar]
- 17.Lockett MR, Weibel SC, Phillips MF, Shortreed MR, Sun B, Corn RM, Hamers RJ, Cerrina F, Smith LM. Journal of the American Chemical Society. 2008;130(27):8611–8613. doi: 10.1021/ja802454c. [DOI] [PMC free article] [PubMed] [Google Scholar]
- 18.Frey BL, Corn RM, Weibel SC. Sampling Techniques. Vol. 2 J. Wiley and Sons; New York: 2002. [Google Scholar]
- 19.Shirley DA. Physical Review B. 1972;5(12):4701–4714. [Google Scholar]
- 20.Moulder JF, Chastian J, Bomben KD, Stickle WF, King RC, Sobol PE. Handbook of X-Ray Photoelectron Spectroscopy. Physical Electronics: Eden Prairie. 1995 [Google Scholar]
- 21.Goodrich TT, Lee HJ, Corn RM. Analytical Chemistry. 2004;76(21):6171–6178. doi: 10.1021/ac0490898. [DOI] [PubMed] [Google Scholar]
- 22.Langley LA, Villanueva DE, Fairbrother DH. Chemistry of Materials. 2006;18(1):161–178. [Google Scholar]
- 23.Singh-Gasson S, Green RD, Yue YJ, Nelson C, Blattner F, Sussman MR, Cerrina F. Nature Biotechnology. 1999;17(10):971–978. doi: 10.1038/13664. [DOI] [PubMed] [Google Scholar]
- 24.Guo Z, Guilfoyle RA, Thiel AJ, Wang RF, Smith LM. Nucleic Acids Research. 1994;22(24):5451–5465. doi: 10.1093/nar/22.24.5456. [DOI] [PMC free article] [PubMed] [Google Scholar]
- 25.Lockett MR, Phillips MF, Jarecki JL, Peelen D, Smith LM. Langmuir. 2007;24(1):61–75. doi: 10.1021/la702493u. [DOI] [PMC free article] [PubMed] [Google Scholar]
- 26.Haerle R, Riedo E, Pasquarello A, Baldereschi A. Physical Review B. 2002;65(4):45101–9. [Google Scholar]
- 27.Jackson ST, Nuzzo RG. Applied Surface Science. 1995;90(2):191–203. [Google Scholar]
- 28.Figueiredo JL, Pereira MFR, Freitas MMA, Orfau JJM. Carbon. 1999;37:1371–1389. [Google Scholar]
- 29.Zhang J, Liu X, Blume R, Zhang A, Schloegl R, Su DS. Science. 2008;322(5898):71–77. doi: 10.1126/science.1161916. [DOI] [PubMed] [Google Scholar]
- 30.Colavita PE, Sun B, Wang XY, Hamers RJ. Journal of Physical Chemistry C. 2009;113(4):1521–1535. [Google Scholar]
- 31.Colavita PE, Sun B, Tse KY, Hamers RJ. Journal of the American Chemical Society. 2007;129(44):13551–13565. doi: 10.1021/ja073944y. [DOI] [PubMed] [Google Scholar]
- 32.Colavita PE, Streifer JA, Sun B, Wang XY, Warf P, Hamers RJ. Journal of Physical Chemistry C. 2008;112(13):5101–5112. [Google Scholar]
- 33.Ababou-Girard S, Sabbah H, Fabre B, Zellama K, Solal F, Godet C. Journal of Physical Chemistry C. 2007;111:3091–3108. [Google Scholar]
- 34.Lopez-Garzon FJ, Domingo-Garcia M, Perez-Mendoza M, Alvarez PM, Gomez-Serrano V. Langmuir. 2003;19:2831–2844. [Google Scholar]
- 35.Xing YJ, Dementev N, Borguet E. Current Opinion in Solid State & Materials Science. 2007;11(1–6):81–91. [Google Scholar]
- 36.McArthur EA, Ye T, Cross JP, Petoud S, Borguet E. Journal of the American Chemical Society. 2004;126(8):2261–2261. doi: 10.1021/ja038062n. [DOI] [PubMed] [Google Scholar]
- 37.Schena M. Microarray Analysis. Wiley-Liss; Hoboken, N. J: 2003. p. 630. [Google Scholar]
- 38.Deegan RD, Bakajin O, Dupont TF, Huber G, Nagel SR, Witten TA. Nature. 1997;389(6653):821–829. [Google Scholar]
- 39.Smalyukh II, Zribi OV, Butler JC, Lavrentovich OD, Wong GCL. Physical Review Letters. 2006;96(17) doi: 10.1103/PhysRevLett.96.177801. [DOI] [PubMed] [Google Scholar]
- 40.Dubertret D, Calame M, Libchaber AJ. Nature Biotechnology. 2001;19:361–370. doi: 10.1038/86762. [DOI] [PubMed] [Google Scholar]
- 41.Plueddemann EP. Silane Coupling Agents. 2. Plenum Press; New York: 1991. p. 253. [Google Scholar]
- 42.Pawlenko S. Organosilicon Chemistry. W. de Gruyter; Berlin: 1986. p. 186. [Google Scholar]
- 43.Weber WH, McCarthy SL. Physical Review B. 1975;12(12):5641–5650. [Google Scholar]
- 44.Sadowski JW, Lekkala J, Vikholm I. Biosensors & Bioelectronics. 1991;6(5):431–444. [Google Scholar]
- 45.Homola J, Yee SS, Gauglitz G. Sensors and Actuators B-Chemical. 1999;54(1–2):1–15. [Google Scholar]
- 46.All n-phase Frensel equations were calculated with WinSpall, a freeware program developed in the laboratory of Wolfgang Knoll.
- 47.Data for 44.0nm gold and 41.0nm silver carbon-on-metal films is contained in Figure 8. Data for the ±5 and ±10nm metal layers is not shown.


