Abstract
Glucose homeostasis is maintained by the orchestration of peripheral glucose utilization and hepatic glucose production, mainly by insulin. In this study, we found by utilizing a combined parallel chromatography mass profiling approach that lysophosphatidylcholine (LPC) regulates glucose levels. LPC was found to stimulate glucose uptake in 3T3-L1 adipocytes dose- and time-dependently, and this activity was found to be sensitive to variations in acyl chain lengths and to polar head group types in LPC. Treatment with LPC resulted in a significant increase in the level of GLUT4 at the plasma membranes of 3T3-L1 adipocytes. Moreover, LPC did not affect IRS-1 and AKT2 phosphorylations, and LPC-induced glucose uptake was not influenced by pretreatment with the PI 3-kinase inhibitor LY294002. However, glucose uptake stimulation by LPC was abrogated both by rottlerin (a protein kinase Cδ inhibitor) and by the adenoviral expression of dominant negative protein kinase Cδ. In line with its determined cellular functions, LPC was found to lower blood glucose levels in normal mice. Furthermore, LPC improved blood glucose levels in mouse models of type 1 and 2 diabetes. These results suggest that an understanding of the mode of action of LPC may provide a new perspective of glucose homeostasis.
Introduction
Glucose is the most important metabolic fuel, and glucose homeostasis is maintained predominantly by insulin by balancing peripheral glucose uptake and hepatic glucose production (1, 2). However, if whole body glucose homeostasis is disrupted, hyperglycemia and various physiopathologies associated with metabolic disturbances may occur. The removal of excess glucose from the circulation involves the stimulation of glucose transport into metabolic tissues, and it has become clear that glucose intolerance in type 2 diabetes is manifested by defects in glucose transport into these metabolic tissues (3). Moreover, for many years, adipose tissue was believed to play key roles in glucose homeostasis (4).
In addition to insulin, various hormones and physiological conditions are capable of stimulating glucose uptake (5–10). For example, the activation of α1-adrenergic or endothelinA receptors results in enhanced glucose uptake rates independently of insulin levels, and physical exercise also plays an important role in the metabolism of glucose by skeletal muscle (10–13). Furthermore, some of the signaling mechanisms that mediate these metabolic responses are similar to those utilized by insulin, whereas others are clearly distinct (5). The above-mentioned processes illustrate that glucose regulation is not a simple event wholly attributable to insulin but rather a complex process that involves many glucose regulators. However, although the significance of insulin-independent glucose regulation has been recognized, no systematic search has been conducted to identify novel glucose regulators.
Over the past few years, lysophospholipids have been increasingly recognized to be important cell signaling molecules (14), and one of these, lysophosphatidylcholine (LPC),2 which is produced during both physiological and pathological conditions, has been shown to be involved in many cellular processes (15–17). For example, it is known that LPC is a major plasma lipid component that transports fatty acids and choline to tissues (18). Moreover, although the mechanisms of LPC synthesis are not completely understood, the hydrolysis of phosphatidylcholine by plasma lecithin-cholesterol acyltransferase is a possible mechanism of the in vivo synthesis of LPC (14). LPC exhibits diverse biological functions and has been reported to be involved in cellular proliferation, tumor cell invasiveness, and inflammation (14, 19). However, little is known of the direct involvement of LPC in the metabolism of glucose. To identify novel serum factors that stimulate glucose uptake in 3T3-L1 adipocytes, we developed a new analytical technique based on parallel HPLC, protease digestion, and mass spectrometry. Using this modality, we found that LPC activates glucose uptake and effectively lowers blood glucose levels in mouse models of Type 1 and 2 diabetes.
EXPERIMENTAL PROCEDURES
Materials
Synthetic 14:0, 18:0, 18:1 LPC, insulin, Ki16425, and streptozotocin (STZ) were obtained from Sigma. Other lysophospholipids were purchased from Avanti polar lipids (Alabaster, AL). All of the lipids were dissolved in MeOH as 50 mm stock solutions and stored for at most a month under nitrogen at −70 °C in glass vials. Gö6976 and rottlerin were purchased from Calbiochem, and antibodies were purchased from the following sources: anti-phospho-Ser473 AKT2 antibody from Sigma; and the α1 subunit of Na+/K+-ATPase antibody from Upstate Biotechnology (Lake Placid, NY). Anti-phospho-Tyr989 IRS1 was produced in our laboratory. [14C]2-Deoxy-d-glucose (300 mCi/mmol) was purchased from Moravek Biochemicals (Brea, CA), and trypsin was from Roche Applied Science. Tissue culture media and fetal bovine serum were from Invitrogen. All other reagents were of analytical grade.
HPLC Fractionation
Approximately 350 ml of fresh human serum was mixed with 70% (v/v) acetone, 1 m acetic acid, and 20 mm HCl and then centrifuged at 20,000 × g for 30 min at 4 °C. The resultant supernatant was collected and extracted three times with diethyl ether, and the aqueous phase so obtained was centrifuged at 20,000 × g for 30 min at 4 °C. Supernatant was then precleared by passing it through SepPak C18 (Waters) cartridges. Eluent was directly loaded onto a C18 reverse phase HPLC column (Vydac 218TP1022, 22 mm × 250 mm). Fractions (10 ml) were collected, and ∼1% of each fraction was assayed for glucose uptake by 3T3-L1 adipocytes. Active fractions were trypsinized for 12 h at 37 °C, and equal amounts were applied to a C4 reverse phase HPLC column (Vydac 214TP5215, 2.1 mm × 150 mm) and to a cation exchange HPLC column (Amersham Biosciences; Min-S HR 5/5, 4.6 mm × 50 mm).
Mass Spectrometry and Data Analysis
ESI-MS and tandem mass spectrometry (MS/MS) analyses were performed using a QSTAR PULSAR I hybrid quadrupole time-of-flight MS/MS (Applied Biosystems/PE SCIEX, Toronto, Canada) equipped with a nano-ESI source. The samples were dissolved in 0.1% trifluoroacetic acid and delivered into the ESI source using a Protana nanospray tip (Odense, Denmark). All of the masses detected were calculated using Analyst QS software provided by Applied Biosystems. Quadrupole time-of-flight MS/MS was performed at a resolution of 8,000–10,000 with a mass accuracy of 10–30 ppm using external calibration. The voltage of the spray tip was set at 2300 V. A combined online-data base (Dictionary of Natural Products, Chapman & Hall/CRC) was used to identify the masses.
Protease Digestion of Active Fractions
For protease digestion, C18 reverse phase HPLC fractions were lyophilized, and then 50 mg/g (enzyme/substrate) of sequencing grade trypsin (Promega Ltd.) in 50 mm ammonium bicarbonate was added. Digestion was carried out at 37 °C overnight.
Cell Culture
3T3-L1 fibroblasts were grown in DMEM containing a high glucose concentration, 10% fetal bovine serum, 50 units of penicillin per milliliter, and 50 μg of streptomycin/ml and maintained in a 5% CO2 humidified atmosphere at 37 °C. 3T3-L1 was induced to differentiate into adipocytes as described previously (20).
Glucose Uptake Measurements
To measure glucose uptake by 3T3-L1 adipocytes, the cells were grown in serum-free DMEM for 16 h, and then serum-free medium was replaced with 1 ml of Kreb's buffer (118 mm NaCl, 25 mm NaHCO3, 4.6 mm KCl, 1.2 mm MgSO4, 1.2 mm KH2PO4, 2.5 mm CaCl2, pH 7.4). The cells were stimulated with insulin or lysophospholipids for the indicated times at 37 °C. Glucose uptake was measured by adding 1 μCi of [14C] 2-deoxy-d-glucose and 3 mm 2-deoxy-d-glucose for 10 min. The assay was terminated with two quick washes of ice-cold phosphate-buffered saline. The cells were lysed in 0.5 ml of lysis buffer containing 0.5 n NaOH and 0.1% SDS. The cell lysates were liquid scintillation counted. Nonspecific glucose uptakes were assayed in the presence of 10 μm cytochalasin B (20). Counts of [14C] 2-deoxy-d-glucose were normalized to protein levels measured with the Bradford reagent (Bio-Rad) at 595 nm.
Adenoviral Transfection of PKC Isoforms
The adenovirus (AdV) expression vectors used to transfect wild-type PKCδ, dominant negative PKCδ (DN-PKCδ), or dominant negative PKCζ (DN-PKCζ) recombinant AdV were as previously described (21). After cultured 3T3-L1 adipocytes had differentiated, the culture medium was aspirated, and the cultures were infected with viral medium containing each recombinant AdV for 24 h. The cultures were then washed twice with serum-free DMEM and refed with DMEM supplemented with 10% fetal bovine serum. The cells were subjected to glucose uptake assays at 48 h post-infection. 3T3-L1 adipocytes transfected with AdV for the LacZ gene (LacZAdV) were used as controls (22).
Immunoblotting
To prepare total cell lysates, 3T3-L1 adipocytes were washed with Ca2+/Mg2+-free phosphate-buffered saline and then lysed in lysis buffer (50 mm HEPES, pH 7.2, 150 mm NaCl, 50 mm NaF, 1 mm Na3VO4, 10% glycerol, 1% Triton X-100). The lysates were then centrifuged at 15,000 rpm for 15 min at 4 °C, and the proteins were denatured in Laemmli sample buffer (5 min at 95 °C) and then separated by SDS-PAGE. The proteins were transferred to nitrocellulose membranes using the Hoefer wet transfer system and blocked in TTBS (20 mm Tris-HCl, pH 7.6, 150 mm NaCl, 0.05% Tween 20) containing 5% skimmed milk powder for 30 min before being incubated with antibodies for 3 h. After washing the membranes several times with TTBS, the blots were incubated with horseradish peroxidase-conjugated anti-mouse or anti-rabbit antibody for 1 h. The membranes were then washed with TTBS and developed by ECL.
GLUT4 Translocation
To obtain membrane fractions from 3T3-L1 adipocytes, the cells were placed in 10 ml of ice-cold HES buffer (250 mm sucrose, 1 mm EDTA, 1 mm phenylmethylsulfonyl fluoride, 1 μm pepstatin, 1 μm aprotinin, 1 μm leupeptin, and 20 mm HEPES, pH 7.4) and homogenized with 30 strokes in a glass Dounce homogenizer at 4 °C. After centrifuging at 1,000 × g for 5 min at 4 °C to remove unbroken cells, the supernatants were further centrifuged at 16,000 × g for 15 min at 4 °C to yield plasma membrane (PM) pellets. Ultracentrifugation was used to obtain low density microsomes, as previously described (7). The PM and low density microsome fractions were denatured in Laemmli sample buffer (5 min at 95 °C) and then separated by SDS-PAGE. GLUT4 was detected by polyclonal anti-GLUT4 antibody from Biogenesis Ltd. (Sandown, NH).
Animals
Male ICR mice were purchased from Hyochang Science (Seoul, Korea). C57BLKSJ-db/db mice were purchased from SLC (Japan). After injecting LPC intravenously, the blood glucose levels were monitored using ONETOUCH UltraTM kits (LifeScan Inc., Milpitas, CA) after tail snipping. Serum insulin levels were determined using insulin-radioimmunoassay kits (LINCO). Insulin-deficient mice were induced by injecting male ICR mice intraperitoneally on two consecutive days with STZ (200 mg/kg) dissolved in 0.1 m sodium citrate (pH 5.5). Age-matched control mice were administered an equivalent volume of citrate buffer. Three days after the second STZ injections, the animals with blood glucose levels greater than 300 mg/dl were considered diabetic. Acute glucose lowering effects were examined after intravenously injecting vehicle, LPC, or insulin, mentioned above. The animals were cared for in accordance with our institution's guidelines.
Statistical Analysis
The data are expressed as the means ± S.E. or the means ± S.D. Statistical analysis was performed using the Student's t test or by one-way analysis of variance and the post hoc test. p values of <0.05 were considered significant.
RESULTS
Parallel HPLC Separation for the Identification of Novel Glucose Uptake-stimulating Molecule in 3T3-L1 Adipocytes
To identify the endogenous factors that stimulate glucose uptake in 3T3-L1 adipocytes, we developed a method based on parallel HPLC, protease digestion, and MS analysis (Fig. 1a). The fundamental principle of parallel HPLC is that it uses profiling analysis to identify target molecules instead of traditional sequential purification (23). In addition to parallel HPLC, we used protease digestion to exclude inactive peptides with physicochemical properties similar to active molecules. Although these peptides are not easily removed by sequential chromatography, the cleavages of inactive peptides by protease digestion causes structural changes in these peptides and facilitates their separation from active species by column chromatography. Therefore, protease digestion is particularly useful for purifying nonpeptide molecules, such as, lipids, amines, and carbohydrates.
FIGURE 1.
The isolation of glucose uptake-stimulating molecules from serum. a, schematic representation of the strategy used to identify the serum factor responsible for stimulating glucose uptake in 3T3-L1 adipocytes. b, C18 reverse phase HPLC (Vydac 218TP1022, 22 × 250 mm) serum elution profile. The relative glucose uptakes are expressed as ratios of uptake increases caused by treatments versus that cause by vehicle alone in 3T3-L1 adipocytes. Small amounts of active fractions were tested to determine whether stimulating activity was reduced by trypsin digestion. The trypsin-resistant fraction (fraction D) was selected and trypsinized prior to a second HPLC purification. c, C4 reverse phase HPLC (Vydac 214TP5215, 2.1 × 150 mm) elution profile of fraction D. d, cation exchange HPLC (Amersham Biosciences Mini-S HR 5/5, 4.6 × 50 mm) elution profile of fraction D.
Using this new method, we first fractionated human serum acetone extracts by C18 reverse phase HPLC, and then 3T3-L1 adipocytes were treated with these HPLC fractions, and glucose uptakes by adipocytes were measured by determining increases in [14C] 2-deoxy-d-glucose uptakes (20). As shown in Fig. 1b, at least four types of fractions were identified that increased glucose uptake by adipocytes (A–D), and these were tested to determine whether their activities were reduced by trypsin digestion. Only the activity of fraction D was found to be unaffected by trypsin digestion (data not shown); thus fraction D was digested with trypsin and further separated by parallel C4 reverse phase (C4) and by cation exchange (SCX) HPLC. All of the C4 and SCX fractions were then screened for the stimulation of glucose uptake in 3T3-L1 adipocytes, and there was single type of active fraction from each HPLC (Fig. 1, c and d).
Identification of LPC as a Glucose Uptake-stimulating Molecule by Mass Spectrometry
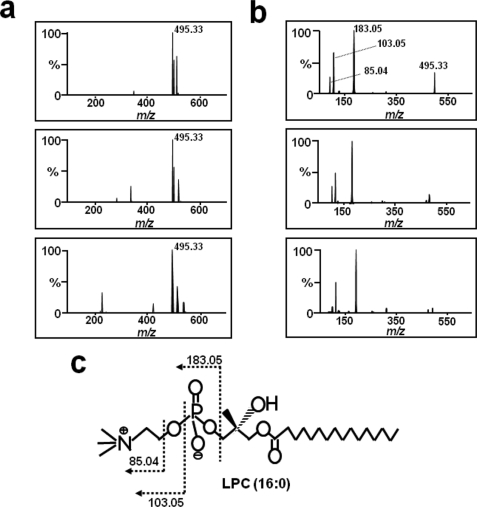
The active fractions from each column system (37 min from the C4 column and 6 min from the SCX column) were analyzed by ESI-quadrupole time-of-flight MS. Initially, to identify common masses in these fractions, mass spectra were compared, and only one common mass was identified at m/z 495.33 (Fig. 2a, top and middle panels). Using this mass information, we searched the combined online-data base (Dictionary of Natural Products), and the unknown was tentatively identified as palmitoyl LPC. To confirm that the target molecule was LPC, we analyzed the fragmentation patterns of standard LPC and of the m/z 495.33 fragment using MS/MS (Fig. 2b). The standard LPC product ion spectrum in positive ion mode displayed several ions that originated from the collision-induced dissociation of the phosphocholine head group of LPC, which produced a maximal peak at m/z 183 (Fig. 2, b, bottom panel, and c). Furthermore, the fragmentation pattern of m/z 495.33 from C4 and SCX exactly matched that of standard LPC (Fig. 2b, top and middle panels). Based on the above information, we concluded that the active substance was LPC.
FIGURE 2.
Mass spectrometry of the glucose uptake-stimulating molecule. a, ESI-TOF MS analysis. Mass spectra of the active fractions of Fig. 1c (top panel) and Fig. 1d (middle panel), and of standard palmitoyl (16:0) LPC (bottom panel). b, mass fragmentation pattern analysis. The MS/MS spectra of the m/z 495.33 mass fragment in the mass spectra shown in a. c, the structure of LPC and the cleavage pattern of its fragmentation.
LPC-induced Glucose Uptake by 3T3-L1 Adipocytes
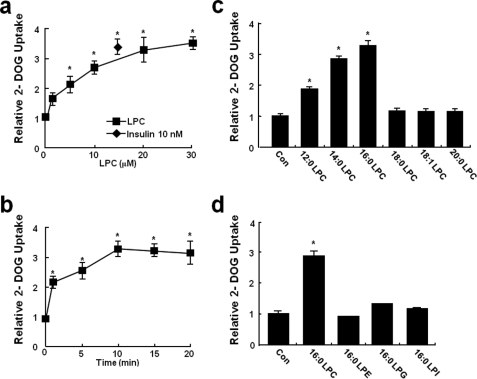
To investigate the effects of LPC on glucose uptake, 3T3-L1 adipocytes were incubated in the presence of various concentrations of LPC for different times. It was found that LPC stimulated glucose uptake in a time- and dose-dependent manner. LPC was found to have a significant effect of on glucose uptake from a concentration of 1 μm and a maximal effect at 20 μm (Fig. 3, a and b). Furthermore, LPC was not cytotoxic at this concentration, which was also below the critical micellar concentration of LPC (40–50 μm) (24).
FIGURE 3.
Effects of LPC on glucose uptake by 3T3-L1 adipocytes. a, 3T3-L1 adipocytes grown in six-well plates were equilibrated in glucose-free Krebs-Ringer buffer for 1 h and then incubated with LPC (0–30 μm) or insulin (10 nm) for 10 min. [14C]2-Deoxy-d-glucose uptake was then measured for 10 min, as described under “Experimental Procedures.” b, 3T3-L1 adipocytes were incubated with 20 μm LPC for 0–20 min. c and d, glucose uptake by 3T3-L1 adipocytes incubated in the absence (control, Con) or the presence of equimolar concentrations (20 μm) of lauroyl LPC (12:0 LPC), myristoyl LPC (14:0 LPC), palmitoyl LPC (16:0 LPC), stearoyl LPC (18:0 LPC), oleoyl LPC (18:1 LPC), arachidoyl LPC (20:0 LPC), palmitoyl LPE (16:0 LPE), palmitoyl LPI (16:0 LPI), or palmitoyl LPG (16:0 LPG) for 10 min. The values are the means ± S.E. of three independent experiments performed in triplicate. *, p < 0.05 versus basal values.
To determine whether variations in the acyl chain lengths of LPC affect glucose uptake, several acylated LPC derivative were tested. Interestingly, lauroyl LPC (12:0), myristoyl LPC (14:0), and palmitoyl LPC (16:0) also stimulated glucose uptake in 3T3-L1 adipocytes, whereas palmitoleoyl LPC (16:1), stearoyl LPC (18:0), oleoyl LPC (18:1), and arachidoyl LPC (20:0) did not (Fig. 3c). To determine whether other lysophospholipids with different phosphor head groups modulated glucose uptake, 3T3-L1 adipocytes were treated with several lysophospholipids. However, as shown in Fig. 3d, these lysophospholipids variants did not stimulate glucose uptake in 3T3-L1 adipocytes.
LPC Stimulated GLUT4 Translocation in 3T3-L1 Adipocytes
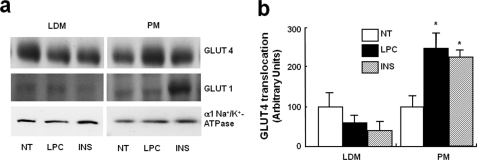
To assess whether the ability of LPC to enhance glucose transport in 3T3-L1 adipocytes is mediated by LPC-induced changes in glucose transporter protein levels on cell surfaces, the GLUT4 protein levels were measured in PM fractions in the basal state and after treating them with LPC or insulin as control. LPC was found to induce a significant increase in GLUT4 protein levels in PMs, like the insulin control (Fig. 4). These results suggest that LPC stimulates GLUT4 translocation, which is consistent with the findings of our glucose uptake experiments.
FIGURE 4.
Effect of LPC on the translocations of GLUT4 in 3T3-L1 adipocytes. a, effect of LPC on the translocations of GLUT4 from low density microsomes (LDM) to the PM in 3T3-L1 adipocytes. 3T3-L1 adipocytes were stimulated for 10 min with 20 μm LPC or 100 nm insulin (INS). NT, not treated. The levels of the α1 subunit of Na+/K+-ATPase were used for control purposes. b, relative increases are depicted. The values shown are the means ± S.E. of three independent experiments performed in triplicate.*, p < 0.05 versus basal values.
LPC Stimulated Glucose Uptake in a PI 3-Kinase-independent and a PKCδ-dependent Manner
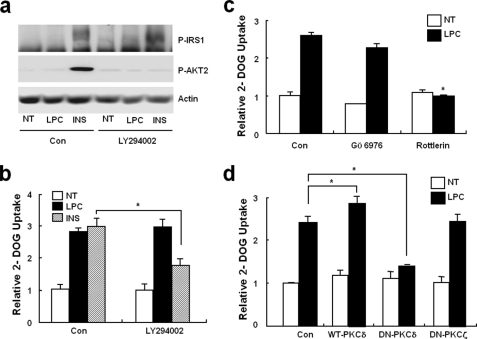
Insulin stimulation of glucose transport into adipocytes requires the insulin receptor-mediated tyrosine phosphorylation of insulin receptor substrate (IRS)-1 and the subsequent activation of PI 3-kinases and AKT2 (protein kinase B2) (25). To determine whether increased glucose uptake in response to LPC is associated with an insulin-dependent signaling pathway, the phosphorylations of IRS1 and AKT2 were checked (25). In contrast to insulin, LPC did not induce changes in the phosphorylations of IRS1 of AKT2 (Fig. 5a) in 3T3-L1 adipocytes. To confirm this, we measured LPC-induced glucose uptake increases after pretreating with LY294002 (20 μm, a PI 3-kinase inhibitor). Fig. 5b shows that LY294002 had no effect on glucose uptake stimulation by LPC. Previously, PKCs have been known to be involved in cellular glucose transport. Moreover, because LPC has been shown to activate conventional and novel PKCs in various cells (24), we assessed the involvements of these PKCs on the LPC-induced up-regulation of glucose transport. Glucose uptake was found to be inhibited by the PKCδ inhibitor rottlerin (5 μm) but not by Gö6976 (5 μm, a conventional PKC inhibitor) (Fig. 5c) To investigate the roles of PKCs more directly, we used an adenovirus expression system to overexpress specific PKC isoforms in 3T3-L1 adipocytes, and we found that the expression of DN-PKCδ, but not of DN-PKCζ, significantly reduced LPC-stimulated glucose transport (Fig. 5d). These findings suggest that PKCδ participates in LPC-induced glucose transport activation.
FIGURE 5.
PI 3-kinase-independent and PKCδ-dependent glucose uptake stimulation by LPC. a, phosphorylations of IRS-1 and AKT2. 3T3-L1 adipocytes were incubated for 30 min with/without LY294002 and then treated with vehicle, 20 μm LPC, or 10 nm insulin (INS) for 10 min. Total cell lysates were analyzed by immunoblotting using the indicated antibodies. β-Actin was used as a protein loading control (Con). The immunoblots shown are representative of three experiments. NT, not treated. b and c, effects of PI 3-kinase or PKC inhibitors on LPC-stimulated glucose uptake. 3T3-L1 adipocytes were treated with or without LY294002, Gö6976, or rottlerin for 30 min before being treated with 20 μm LPC. Glucose uptakes were then measured for 10 min as described under “Experimental Procedures.” d, the effects of wild-type PKCδ and DN-PKCδ overexpression on LPC-stimulated glucose uptake. 3T3-L1 adipocytes expressing wild-type PKCδ, DN-PKCδ, or DN-PKCζ were incubated with vehicle or 20 μm LPC for 10 min. Glucose uptakes were then assayed as indicated. An adenovirus containing the LacZ gene (LacZAdV) was used as a control. The values shown are the means ± S.E. of three independent experiments performed in triplicate. *, p < 0.05.
LPC Lowered Blood Glucose Levels without Affecting Blood Insulin Levels in Mouse
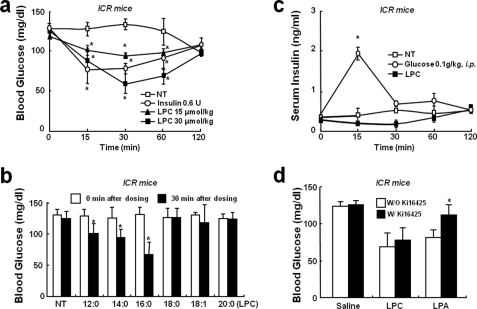
To determine whether LPC affects animals, we tested its blood glucose lowering effect in mice. Acute administration of LPC (at 15 or 30 μmol/kg intravenously) to normal ICR mice resulted in a statistically significant dose-dependent drop in blood glucose levels within 30 min (Fig. 6a). To assess whether other lysophospholipids have similar glucose lowering effects, we tested several derivatives of LPC. Palmitoyl-, lauroyl-, and myristoyl LPCs when administered in the same manner also caused reduced blood glucose levels, whereas stearoyl-, oleoyl-, and arachidoyl LPC did not (Fig. 6b). To determine whether this effect of LPC was due to increased insulin levels in blood, we measured insulin levels after LPC administration. It was found that LPC did not induce any change in blood insulin (Fig. 6c). LPA is known to be synthesized from LPC by lysophospholipase D, an autotaxin that attenuates blood glucose levels in mice. To determine whether the glucose lowering effect of LPC was mediated by LPA, we examined the effect of the Ki16425 (an LPA receptor antagonist). However, Ki16425 had no effect on the glucose lowering effect of LPC (Fig. 6d).
FIGURE 6.
Blood glucose lowering effect of LPC in normal ICR mice. a and b, acute glucose reduction by LPC in ICR mice. 8-week-old male mice were intravenously injected with phosphate-buffered saline, insulin, or various LPCs. Blood glucose levels were monitored for 0–120 min after injections. c, serum insulin levels in 8-week-old male mice after a single intravenous injection of saline, glucose, or LPC. d, the effect of Ki16425 (an LPA receptor inhibitor) on the blood glucose reduction by LPC. 8-week-old male ICR mice were pretreated with Ki16425 (10 μmol/kg) for 30 min and then intravenously administered saline, LPC, or LPA. All of the animals had free access to water and were cared for in accordance with the guidelines issued by our institution. The data shown are the means ± S.D. (n = 5–6). *, p < 0.05 versus vehicle. NT, not treated.
LPC Lowered Blood Glucose Levels in Mouse Models of Type 1 and 2 Diabetes
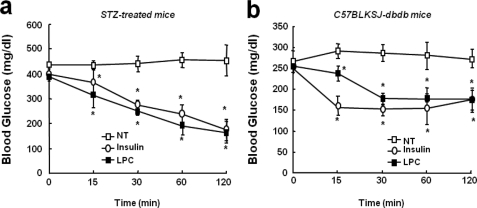
We also examined the in vivo efficacy of LPC in type 1 and type 2 diabetic mouse models. Single intravenous administrations of LPC were found to dose-dependently reduce blood glucose levels in STZ-treated insulin-deficient, type 1 diabetic mice, in a manner similar to intravenous insulin (Fig. 7a). Similar administrations of LPC also affected glycemia in obese db/db type 2 diabetic mice and reduced blood glucose levels to near normal (Fig. 7b).
FIGURE 7.
The in vivo effect of LPC blood glucose levels in murine models of type 1 and 2 diabetes. a, the acute glucose lowering effect of LPC in the STZ-induced insulin-deficient ICR male mouse model. b, the acute glucose lowering effect of LPC in obese C57BLKSJ-db/db mice. All of the animals had free access to water. The animals were cared for in accordance with our institution's guidelines. The data shown are the means ± S.D. (n = 5–6). *, p < 0.05 versus vehicle. NT, not treated.
DISCUSSION
The present study provides evidence that LPC is a blood-derived factor involved in glucose homeostasis. 3T3-L1 adipocytes treated with LPC were found to uptake glucose rapidly via PI 3-kinase-independent PKCδ activation. Furthermore, when acute intravenous LPC was administered to mouse models of type 1 and 2 diabetes, the blood glucose levels were significantly lowered. Accordingly, we suggest that LPC represents a novel insulin-independent signal that can regulate blood glucose levels in normal and diseased mouse models. Furthermore, our findings suggest that an understanding of the role played by LPC in glucose regulation would enhance our understanding of glucose metabolism.
The stimulation of glucose uptake by 3T3-L1 adipocytes and the blood glucose lowering effect of LPC in mice were found to be sensitive to variations in LPC acyl chain length, i.e. whereas the palmitoyl and myristoyl LPC derivatives (16:0 and 14:0, respectively) enhanced glucose uptake by 3T3-L1 adipocytes, stearoyl, oleoyl, and arachidoyl LPC (18:0, 18:1, and 20:0, respectively) were ineffective. However, when 3T3-L1 adipocytes were treated with several lysophospholipids that differed structurally only in terms of the polar head group of palmitoyl LPC, glucose uptake by adipocytes was not increased (this structural specificity was also confirmed by our mouse model of type 1 and 2 diabetes). These findings suggest that both acyl chain length and the choline head group of LPC are critical for stimulating glucose uptake by 3T3-L1 adipocytes and for lowering blood glucose levels in mice. Based on the rapid onset and structural specificity of LPC, we speculate that the biological activity of LPC is possibly due to binding between LPC and a specific cell surface receptor. Several lysophospholipids have been reported to bind to G protein-coupled receptor family members (26–29). However, recently it was reported that LPC activates these receptors via a mechanism that does not involve direct binding (19), although earlier reports concluded that LPC binds directly to and activates G2A and GPR4. Thus, it remains an open question as to whether LPC stimulates glucose uptake by directly binding G2A and GPR4 or whether it does so indirectly via an as yet unknown mechanism.
The involvement of conventional or atypical PKC activation in the promotion of glucose uptake by adipocytes and muscle cells is well established (30), but the activation of novel PKCs, especially of PKCδ, also controls glucose uptake. Stimulation of the translocation of GLUT4 to the plasma membrane and glucose uptake by insulin were found to be inhibited by rottlerin in rat skeletal muscle cells, and the overexpression of PKCδ induced by GLUT4 translocation to the plasma membrane was found to increase basal glucose uptake to levels attained by insulin (31). In the present study, LPC-induced glucose uptake was found to be significantly blocked by rottlerin and by the overexpression of DN-PKCδ. In contrast, pretreatment with Gö6976 (a conventional PKC inhibitor) and the expression of DN-PKCζ were found to have no effect on LPC-induced glucose uptake. These findings suggest that only PKCδ is required for LPC-induced glucose transport in 3T3-L1 adipocytes. However, it has not been established whether PKCδ is downstream of LPC receptors like G2A or GPR4, and thus, additional work is needed to further elucidate the natures of the signal mechanisms that trigger specific PKCδs to participate in LPC-induced glucose transport.
The induction of insulin secretion from pancreatic β-cells is a physiological function of LPC (32). Recently, Suga et al. found that LPC induced insulin secretion by a pancreatic β-cell line (NIT-1) and by perfused rat pancreas under high glucose conditions (16.6 mm), but not under low glucose (2.8 mm) conditions (32). In the present study, we measured serum insulin levels in fasted mice with blood glucose concentrations of 3–5 mm after LPC administration and found that LPC had no effect. On the other hand, we found that LPC had a blood glucose lowering effect in STZ-treated insulin-deficient mice. Thus, these results obtained in our study potentially support that LPC can directly affect glucose lowering in mice.
It is well known that LPA can be produced abundantly from LPC by autotoxin, which has lysophospholipase D activity (33), and recently, it was reported that LPA has a glucose regulatory function (34). Furthermore, it has been reported that LPA can associate with four types of LPA receptors, enhance glucose uptake by 3T3-L1 adipocytes, and reduce blood glucose levels by interacting with LPA1 or LPA3 receptors (34, 35). In addition, the authors showed that blood glucose reductions by LPA were significantly inhibited by Ki16425 (a selective LPA1 and LPA3 antagonist) (34). Therefore, we examined whether the blood glucose lowering effect of LPC is affected by Ki16425. However, although we found that the glucose lowering effect of LPA was blocked by Ki16425, it had no effect on the glucose reduction induced by LPC (Fig. 6d). Based on this result, we suggest that the LPC-induced glucose level reductions are not caused by LPA metabolized from LPC, but rather that these reductions are due to the direct effects of LPC.
The physiologic concentrations of LPC in body fluids, such as blood and ascites, are substantial (5–180 μm) (14). The levels of LPC are elevated in many diseases related to inflammation (15). More recently, elevated LPC levels (in particular, the ratios of palmitoyl-LPC to linoleoyl-LPC) have been reported in ovarian cancer and multiple myeloma. Nevertheless, the changes in LPC concentration by glucose or other metabolic stimuli have not been characterized. Therefore, additional work is required on the regulation of LPC secretion and to confirm the effect of LPC on glucose metabolism.
The present study provides the first evidence that blood-borne LPC is intimately involved in glucose homeostasis. It is our hope that this finding generates interest in the physiological and pathological roles of LPC in glucose metabolism. Finally, we believe that an understanding of the mechanism responsible for the metabolic effects of LPC could lead to the development of a novel means of treating diabetes.
Supplementary Material
This work was supported by Grant FPR08B1-160 from the 21C Frontier Functional Proteomics project of the Korean Ministry of Education and Science and by a grant from the Korean Ministry of Science and Technology/Korean Science and Engineering Foundation to the Korean National Core Research Center for Systems Bio-Dynamics.

The on-line version of this article (available at http://www.jbc.org) contains supplemental Fig. S1.
- LPC
- lysophosphatidylcholine
- DN
- dominant negative
- PKC
- protein kinase C
- HPLC
- high pressure liquid chromatography
- STZ
- streptozotocin
- MS/MS
- tandem mass spectrometry
- ESI
- electrospray ionization
- DMEM
- Dulbecco's modified Eagle's medium
- AdV
- adenovirus
- PM
- plasma membrane
- SCX
- cation exchange
- IRS
- insulin receptor substrate
- PI
- phosphoinositide
- LPA
- lysophosphatidic acid.
REFERENCES
- 1.Saltiel A. R., Kahn C. R. (2001) Nature 414, 799–806 [DOI] [PubMed] [Google Scholar]
- 2.Chiasson J. L., Rabasa-Lhoret R. (2004) Diabetes 53, (Suppl. 3) S34–S38 [DOI] [PubMed] [Google Scholar]
- 3.Moller D. E. (2001) Nature 414, 821–827 [DOI] [PubMed] [Google Scholar]
- 4.Hespel P., Vergauwen L., Vandenberghe K., Richter E. A. (1996) Diabetes 45, (Suppl. 1) S99–S104 [DOI] [PubMed] [Google Scholar]
- 5.Elmendorf J. S. (2002) J. Membr. Biol. 190, 167–174 [DOI] [PubMed] [Google Scholar]
- 6.Hutchinson D. S., Bengtsson T. (2006) Diabetes 55, 682–690 [DOI] [PubMed] [Google Scholar]
- 7.Perrini S., Natalicchio A., Laviola L., Belsanti G., Montrone C., Cignarelli A., Minielli V., Grano M., De Pergola G., Giorgino R., Giorgino F. (2004) Diabetes 53, 41–52 [DOI] [PubMed] [Google Scholar]
- 8.Kishi K., Muromoto N., Nakaya Y., Miyata I., Hagi A., Hayashi H., Ebina Y. (1998) Diabetes 47, 550–558 [DOI] [PubMed] [Google Scholar]
- 9.Tanishita T., Shimizu Y., Minokoshi Y., Shimazu T. (1997) J. Biochem. 122, 90–95 [DOI] [PubMed] [Google Scholar]
- 10.Richter E. A., Derave W., Wojtaszewski J. F. (2001) J. Physiol. 535, 313–322 [DOI] [PMC free article] [PubMed] [Google Scholar]
- 11.Kemppainen J., Fujimoto T., Kalliokoski K. K., Viljanen T., Nuutila P., Knuuti J. (2002) J. Physiol 542, 403–412 [DOI] [PMC free article] [PubMed] [Google Scholar]
- 12.Ryder J. W., Chibalin A. V., Zierath J. R. (2001) Acta Physiol. Scand. 171, 249–257 [DOI] [PubMed] [Google Scholar]
- 13.Ishibashi K., Imamura T., Sharma P. M., Ugi S., Olefsky J. M. (2000) Endocrinology 141, 4623–4628 [DOI] [PubMed] [Google Scholar]
- 14.Xu Y. (2002) Biochim. Biophys. Acta 1582, 81–88 [DOI] [PubMed] [Google Scholar]
- 15.Xu Y., Fang X. J., Casey G., Mills G. B. (1995) Biochem. J. 309, 933–940 [DOI] [PMC free article] [PubMed] [Google Scholar]
- 16.Xing F., Liu J., Mo Y., Liu Z., Qin Q., Wang J., Fan Z., Long Y., Liu N., Zhao K., Jiang Y. (2008) J. Cell Mol Med. 13, 1136–1148 [DOI] [PMC free article] [PubMed] [Google Scholar]
- 17.Murugesan G., Sandhya Rani M. R., Gerber C. E., Mukhopadhyay C., Ransohoff R. M., Chisolm G. M., Kottke-Marchant K. (2003) J. Mol. Cell. Cardiol. 35, 1375–1384 [DOI] [PubMed] [Google Scholar]
- 18.Croset M., Brossard N., Polette A., Lagarde M. (2000) Biochem. J. 345, 61–67 [PMC free article] [PubMed] [Google Scholar]
- 19.Wang L., Radu C. G., Yang L. V., Bentolila L. A., Riedinger M., Witte O. N. (2005) Mol. Biol. Cell 16, 2234–2247 [DOI] [PMC free article] [PubMed] [Google Scholar]
- 20.van den Berghe N., Ouwens D. M., Maassen J. A., van Mackelenbergh M. G., Sips H. C., Krans H. M. (1994) Mol. Cell. Biol. 14, 2372–2377 [DOI] [PMC free article] [PubMed] [Google Scholar]
- 21.Ohba M., Ishino K., Kashiwagi M., Kawabe S., Chida K., Huh N. H., Kuroki T. (1998) Mol. Cell. Biol. 18, 5199–5207 [DOI] [PMC free article] [PubMed] [Google Scholar]
- 22.Li L., Lorenzo P. S., Bogi K., Blumberg P. M., Yuspa S. H. (1999) Mol. Cell. Biol. 19, 8547–8558 [DOI] [PMC free article] [PubMed] [Google Scholar]
- 23.Baek M. C., Kim S. J., Yea K., Kim Y., Lee B. D., Kim J., Lee H. J., Kang M. H., Choi S. K., Kim J. I., Lee T. G., Suh P. G., Ryu S. H. (2006) Proteomics 6, 1741–1749 [DOI] [PubMed] [Google Scholar]
- 24.Chaudhuri P., Colles S. M., Fox P. L., Graham L. M. (2005) Circ. Res. 97, 674–681 [DOI] [PubMed] [Google Scholar]
- 25.Vanhaesebroeck B., Alessi D. R. (2000) Biochem. J. 346, 561–576 [PMC free article] [PubMed] [Google Scholar]
- 26.Contos J. J., Ishii I., Chun J. (2000) Mol. Pharmacol. 58, 1188–1196 [DOI] [PubMed] [Google Scholar]
- 27.Sugo T., Tachimoto H., Chikatsu T., Murakami Y., Kikukawa Y., Sato S., Kikuchi K., Nagi T., Harada M., Ogi K., Ebisawa M., Mori M. (2006) Biochem. Biophys. Res. Commun. 341, 1078–1087 [DOI] [PubMed] [Google Scholar]
- 28.Bandoh K., Aoki J., Hosono H., Kobayashi S., Kobayashi T., Murakami-Murofushi K., Tsujimoto M., Arai H., Inoue K. (1999) J. Biol. Chem. 274, 27776–27785 [DOI] [PubMed] [Google Scholar]
- 29.An S., Bleu T., Hallmark O. G., Goetzl E. J. (1998) J. Biol. Chem. 273, 7906–7910 [DOI] [PubMed] [Google Scholar]
- 30.Bandyopadhyay G., Standaert M. L., Zhao L., Yu B., Avignon A., Galloway L., Karnam P., Moscat J., Farese R. V. (1997) J. Biol. Chem. 272, 2551–2558 [DOI] [PubMed] [Google Scholar]
- 31.Braiman L., Alt A., Kuroki T., Ohba M., Bak A., Tennenbaum T., Sampson S. R. (1999) Mol. Endocrinol. 13, 2002–2012 [DOI] [PubMed] [Google Scholar]
- 32.Soga T., Ohishi T., Matsui T., Saito T., Matsumoto M., Takasaki J., Matsumoto S., Kamohara M., Hiyama H., Yoshida S., Momose K., Ueda Y., Matsushime H., Kobori M., Furuichi K. (2005) Biochem. Biophys. Res. Commun. 326, 744–751 [DOI] [PubMed] [Google Scholar]
- 33.van Meeteren L. A., Moolenaar W. H. (2007) Prog. Lipid Res. 46, 145–160 [DOI] [PubMed] [Google Scholar]
- 34.Yea K., Kim J., Lim S., Park H. S., Park K. S., Suh P. G., Ryu S. H. (2008) J. Mol. Med. 86, 211–220 [DOI] [PubMed] [Google Scholar]
- 35.Goetzl E. J., An S. (1998) FASEB J. 12, 1589–1598 [PubMed] [Google Scholar]
Associated Data
This section collects any data citations, data availability statements, or supplementary materials included in this article.


