Abstract
Glutamate decarboxylase (GadB) from Escherichia coli is a hexameric, pyridoxal 5′-phosphate-dependent enzyme catalyzing CO2 release from the α-carboxyl group of l-glutamate to yield γ-aminobutyrate. GadB exhibits an acidic pH optimum and undergoes a spectroscopically detectable and strongly cooperative pH-dependent conformational change involving at least six protons. Crystallographic studies showed that at mildly alkaline pH GadB is inactive because all active sites are locked by the C termini and that the 340 nm absorbance is an aldamine formed by the pyridoxal 5′-phosphate-Lys276 Schiff base with the distal nitrogen of His465, the penultimate residue in the GadB sequence. Herein we show that His465 has a massive influence on the equilibrium between active and inactive forms, the former being favored when this residue is absent. His465 contributes with n ≈ 2.5 to the overall cooperativity of the system. The residual cooperativity (n ≈ 3) is associated with the conformational changes still occurring at the N-terminal ends regardless of the mutation. His465, dispensable for the cooperativity that affects enzyme activity, is essential to include the conformational change of the N termini into the cooperativity of the whole system. In the absence of His465, a 330-nm absorbing species appears, with fluorescence emission spectra more complex than model compounds and consisting of two maxima at 390 and 510 nm. Because His465 mutants are active at pH well above 5.7, they appear to be suitable for biotechnological applications.
Introduction
Glutamate decarboxylase (Gad; EC 4.1.1.15) is a pyridoxal 5′-phosphate (PLP)-dependent2 enzyme widely distributed among living organisms (1). It catalyzes CO2 release from the α-carboxyl group of l-glutamate to yield 4-aminobutyrate (γ-aminobutyrate (GABA)). In commensal and pathogenic strains of Escherichia coli and in other enteric bacteria, like Shigella flexneri, Listeria monocytogenes, and Lactococcus lactis, Gad is a key component of the most important acid resistance system, based on glutamate. This system protects enteric bacteria from the extreme acid stress that they encounter during transit through the stomach of the host on their way to the gut (2). The system exploits the proton consuming activity of Gad by replacing the leaving CO2 with a proton, which is irreversibly incorporated into GABA.
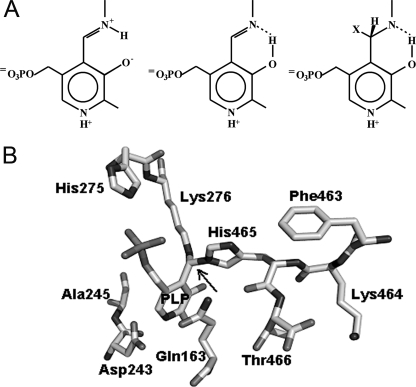
E. coli possesses two Gad isoforms, GadA and GadB, which exhibit an acidic pH optimum (pH 3.8–4.6) and become activated intracellularly because in extremely acidic environments protons leak through the bacterial cell membrane (2). pH-dependent activation of Gad is accompanied by a distinct change in the absorption spectrum of the cofactor (3–6). At wavelengths above 300 nm, the spectrum changes from one at pH > 5.3 with the major absorbance band at 340 nm (inactive enzyme) to another at pH< 5.3 with the major band at 420 nm (active enzyme). The midpoint of the spectroscopic change is shifted from pH 5.3 to 5.8 in the presence of chloride, which is the most abundant anion in gastric secretions (3). The spectral transition exhibits a high level of cooperativity of the protonation/deprotonation process, with at least six protons being involved (3–5). The 420-nm absorbing species is generally accepted to be the ketoenamine form of the PLP-Lys276 internal aldimine, protonated on the Schiff base nitrogen (Fig. 1A). Two structures have been proposed for the 340-nm absorbing species (Fig. 1A). O'Leary and Brummund (7, 8) assumed that it is an aldamine in which the C4′ is substituted by a cysteine residue. Tramonti et al. (5), upon mutation of the Lys276, proposed that the 340-nm chromophore is the enolimine tautomer of the ketoenamine. Model studies in aqueous and nonpolar solvents have shown that aldimines and aldamines of PLP originate different fluorescence emission spectra when excited at 330 nm (9). The enolimine tautomer of the Schiff base with hexylamine emits maximally at 512–518 nm. Aldamines formed with histidine and cysteine show a single emission peak with a λmax value of 367–385 nm. This occurs because the C4′ of the cofactor is sp3-hybridized, and the conjugation between the double bond of the Schiff base and the pyridinium ring is lost (10). These properties were used to assign enolimine or aldamine structures in several PLP-dependent enzymes (9–15).
FIGURE 1.
Chemical structures. A, chemical structures of ketoenamine (left), enolimine (center), and aldamine (right). B, aldamine formed between the PLP-Lys276 Schiff base and the distal nitrogen on the imidazole ring of His465 in the crystal structure of E. coli GadB (Protein Data Bank code 2DGK).
Several structures of GadB are available: high and low pH forms, halide-bound forms, and a mutant (GadBΔ1–14) lacking the 14 N-terminal residues. Together the structures provided a plausible basis for all of the above spectroscopic properties (3, 4). Wild type GadB undergoes two significant conformational changes. The first one involves the last 14 residues of each subunit, which are flexibly disordered at low pH and become ordered and plug the active site at high pH, thus explaining the loss of activity. His465, the penultimate residue in sequence, was crystallographically shown to form an aldamine with the cofactor, thus acting as a “lock residue” for the active site (Fig. 1B) (3, 4). In the second conformational change, the first 14 residues of each subunit are unstructured in the high pH form, whereas in the low pH form they group in two bundles. The bundles consist of three helices each and surmount chloride-binding sites that, when occupied, exert a stabilizing effect (3). This latter conformational change is attributable to a classical coil-to-helix transition resulting from the protonation of carboxylate side chains located at strategic positions in this part of the sequence. In GadBΔ1–14 cooperativity of the absorbance change was greatly reduced (n ≈ 2) compared with wild type, whereas the transition from active to inactive form was 20 times slower and no longer affected by chloride. The conformational change at the N terminus also controls the intracellular distribution of the enzyme (4). At acidic pH wild type GadB is mainly associated with the membrane fraction, whereas at neutral pH it remains largely in the cytosol. Notably, the GadBΔ1–14 mutant remains in the cytosol under both acidic and neutral conditions.
The two His465 mutants described in this work were produced to determine the effects of eliminating the capacity for aldamine formation on the cooperativity of the system, on the pH dependence itself, and on the link between the conformational changes at the C and N termini.
EXPERIMENTAL PROCEDURES
Materials
FastStart High Fidelity DNA polymerase, restriction enzymes, alkaline phosphatase, and ampicillin were from Roche Applied Science, TOPO® TA cloning system was from Invitrogen, and the DNA ligation system and DEAE-Sepharose FF were from GE Healthcare. Taq DNA polymerase and SDS-PAGE protein markers were from Fermentas, and the plasmid DNA and the DNA extraction kit from agarose gel were from Nucleospin. Ingredients for bacterial growth were from Difco, and streptomycin sulfate was from U. S. Biochemical Corp. PLP and analytical grade sodium acetate were from VWR International. Sodium chloride was from Riedel-de Haen. 4-(2-Hydroxyethyl)piperazine-1-(3-propane-sulfonic acid) was from Acros Organics. Vitamin B6, potassium dihydrogen phosphate, dipotassium hydrogen phosphate, l-glutamic acid, and kanamycin were from Fluka. All other chemicals were from Sigma. Oligonucleotide synthesis and DNA sequencing services were by MWG Biotech.
Site-directed Mutagenesis
Construction of the E. coli GadB mutants was performed by PCR amplification on the entire gadB open reading frame as cloned in pQgadB (16). In each case two primers were used. Site-directed mutagenesis for GadBH465A was performed using the forward oligonucleotide 5′-GGCGTATCACGAGGCCCTTTC-3′, which anneals upstream of the pQE60 polycloning site, and the mutagenic oligonucleotide 5′-GGAAGCTTAAACGTTATCAGGTAGCTTTAAAGCTGTTC-3′. The deletion mutant GadBΔHT, lacking His465 and Thr466, was generated using the forward primer 5′- GGCCATGGATAAGAAGCTAGTAACG-3′, which anneals in the 5′ coding region of the gadB gene, and the mutagenic oligonucleotide 5′-GGAAGCTTAAACGTTATCATTTAAAGCTG-3′. The italicized sequences indicate the NcoI and HindIII restriction sites used for directional cloning of the PCR products into pQE60. The underlined nucleotides are the codon substitutions introducing the His → Ala mutation in GadBH465A, whereas the nucleotides in bold are those in between the two triplets coding for His465 and Thr466 that were deleted in GadBΔHT. The amplification products were cloned in the pCRII-TOPO vector (TOPO® TA cloning system). E. coli Mach1-T1 transformants were selected by blue/white screening. Plasmids from white colonies were purified and fully sequenced on both strands. Plasmids pCRII-H465A and pCRII-ΔHT were digested with EcoRV and HindIII, which cut 624 nucleotides upstream and 12 nucleotides downstream from the GadB TGA stop codon, respectively. The 639-nucleotide DNA fragment was subcloned into pQgadB (16) digested with the same restriction enzymes and therefore lacking the C-terminal region of gadB. The ligation mixture was used to transform E. coli JM109/pREP4. Transformants were screened by colony PCR. Plasmids from positive clones were also digested with NcoI and HindIII restriction enzymes to confirm the presence of the entire mutated gene.
Protein Purification, SDS-PAGE, and Cell Fractionation
The conditions used for expression and purification of GadBH465A and GadBΔHT were essentially as described for wild type GadB (16) except that the DEAE-Sepharose chromatography was performed at 4 °C instead of at room temperature to improve the stability of the mutant enzymes.
Protein purity was judged by 12% SDS-PAGE (17). Enzyme concentration and activity were assayed as described (16). The PLP content of all preparations was determined by treating the proteins with 0.1 m NaOH and measuring absorbance at 388 nm (ϵ388 = 6550 liter·mol−1·cm−1) (18).
The effect of pH on the cellular localization of GadBH465A and GadBΔHT compared with wild type GadB was established following cell fractionation. Cytoplasmic and membrane fractions from E. coli strains JM109/pREP4 containing either pQgadBH465A or pQgadBΔHT were obtained and assayed for enzyme activity and by immunoblot as described (4).
Gad Activity Assay
Two assay methods were used. The Gabase assay quantifies GABA production (16), and the specific activity determined is referred to as μmol GABA min−1 mg−1. Alternatively, an assay using a pH-stat was conducted (Metrohm 718 stat titrino) at 40 °C in the absence of added buffer (20). Titration was performed with an aqueous solution of HCl (0.1 m). In a typical experiment, 10 ml of a solution containing 80 mm l-glutamic acid and 0.5 mm PLP in water was brought to pH 4.6 with NaOH. Gad (20 μg) was added, and the titration curve was recorded. The specific activity was determined from the initial slope of the titration curve over 5 min and is defined as μmol H+ added min−1 mg−1.
Spectroscopic Measurements
Absorption spectra and absorbance changes in the presence of l-glutamate were recorded at the indicated temperatures on a Hewlett-Packard Agilent model 8452 diode array spectrophotometer.
CD spectra were obtained as the averages of three scans on a Jasco J-10 spectropolarimeter with a DP520 processor for thermostatic control of the cell compartment at 10 °C. The scans were obtained in the 300–500-nm range in a 0.2-cm path length cuvette at a scan speed of 20 nm/min with a 1-nm bandwidth.
Fluorescence spectra were taken with a FluoroMax-3 (Horiba Jobin-Yvon) spectrofluorometer with a thermostatically controlled cell compartment at 20 °C using 5-nm bandwidth on both sides at a scan speed of 100 nm/min. Blank spectra were subtracted from spectra of enzyme-containing sample in both CD and fluorescence analyses.
Data Analysis
Curve fitting, deconvolution of spectra, and statistical analyses were carried out with Scientist (Micromath, Salt Lake City, UT) and GraphPad Prism 4.00 (GraphPad Software, San Diego, CA).
The pH-dependent variations in absorbance were analyzed using the following equations,
 |
 |
where AbsEH and AbsE are the absorbances of the 420-nm absorbing species at the beginning and the end of the spectral transition, respectively. K, K1, and K2 are the intrinsic dissociation constants of the species involved in the titration, and n is the number of protons involved in the transition. Values for kcat and Km were determined in 50 mm sodium acetate buffer, pH 4.6, by following the changes in absorbance at 420 and 340 nm observed during the reaction of wild type GadB and of GadBH465A and GadBΔHT in the presence of different concentrations of l-glutamate as described (21). The absorption spectra were resolved into their component absorption bands (deconvolution) by nonlinear least square fit of the experimental data to the sum of a variable number of log normal curves, each having independent parameters (22).
Bioinformatic Analysis
A Ka/Ks ratio analysis was carried out as follows: 14 orthologues/paralogues of GadB were manually selected from the output of a BLAST search versus the UniProt data base. The protein sequences were aligned with T-COFFEE (23), and the corresponding coding sequences were retrieved from the EMBLCDS data base (24) using DBFETCH and aligned with REVTRANS (25) using the protein sequence alignment as template. Ka/Ks ratios were calculated with SELECTON (26) in high accuracy mode using the M8 codon substitution model.
RESULTS
Overproduction and Purification of GadBH465A and GadBΔHT
His465 of GadB was either replaced with alanine (GadBH465A) or deleted together with the last residue in the polypeptide chain, Thr466 (GadBΔHT). Both mutants were overexpressed in E. coli and purified essentially following the protocol used for wild type GadB (16), which was also purified for comparison purposes. During DEAE-Sepharose chromatography at pH 6.5 the mutants, unlike wild type GadB, eluted as yellow bands, indicating that the mutations had altered their absorption spectra. The purity of both mutants was >95%, as based on SDS-PAGE (data not shown). The mutants were stable at 4 °C for many months. The yield from a standard purification (a 2-liter culture) was approximately 70 mg for GadBH465A and 43 mg for GadBΔHT, corresponding to 54 and 33% of the purification yield of the wild type enzyme, respectively. The content of holoenzyme, established by calculating the PLP concentration in 0.1 n NaOH, was on average 79 and 67% of GadBH465A and GadBΔHT total protein concentration, respectively. Under standard assay conditions (0.2 m pyridine/HCl buffer, pH 4.6, at 37 °C in the presence of 0.1 mm PLP) the specific activity, referred to the total protein concentration, was 176 units/mg for GadBH465A and 118 units/mg for GadBΔHT, corresponding to 78 and 52% of the specific activity of wild type GadB, respectively.
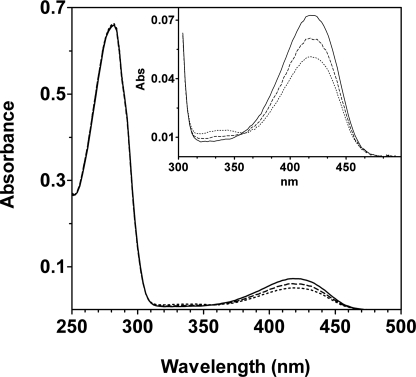
At pH 4.6 the absorption spectra of the mutants are similar to each other but differ from that of wild type GadB (Fig. 2) because a small but significant 340-nm absorbing species is present. The lower absorbance at 420 nm is partly due to this species and partly due to the lower overall content of PLP (holoenzyme). The kcat and Km values calculated for each mutant are provided in Table 1. The mutations cause a slight decrease in both kcat and Km compared with wild type GadB, but the catalytic efficiency (kcat/Km) is similar to wild type.
FIGURE 2.
UV-visible absorption spectra. Absorption spectra of the purified proteins were obtained in 50 mm sodium acetate buffer, pH 4.86. The spectra of wild type GadB (continuous line), GadBH465A (dashed line), and GadBΔHT (dotted line) were normalized to a protein concentration of 7.7 μm. In the inset, the 300–500-nm region of the spectra is expanded.
TABLE 1.
Kinetic parameters
The values reported were calculated using the integrated Michaelis-Menten equation to fit the curves of the disappearance of the enzyme-substrate complex as a function of time as described by Tramonti et al. (21).
| kcat | Km | kcat/Km | |
|---|---|---|---|
| s−1 | mm | s−1mm−1 | |
| Wild type GadB | 24.85 ± 0.13 | 2.32 ± 0.05 | 10.71 ± 0.02 |
| GadBH465A | 20.75 ± 0.06 | 1.51 ± 0.02 | 13.74 ± 0.01 |
| GadBΔHT | 16.24 ± 0.06 | 1.61 ± 0.03 | 10.08 ± 0.02 |
pH-dependent Spectral Properties
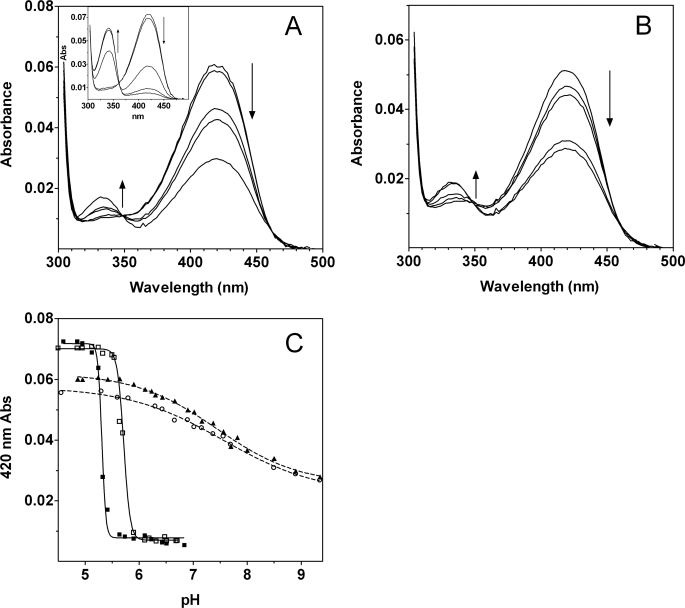
Preliminary experiments in acetate buffer showed that the UV-visible absorption spectra of GadBH465A and GadBΔHT changed very little in the range of pH 4.5–7.0 (data not shown). This behavior contrasts with that of wild type GadB (4, 5). The range of analysis was therefore extended to 9.5, and phosphate was used as buffer instead of acetate. The spectral changes shown by the mutants are different in several respects. In the wild type enzyme at pH 6.8, less than 10% of the 420-nm absorbance observed at pH 4.6 is present (Fig. 3A, inset), whereas in both mutants ∼50% of the 420-nm absorbance observed at pH 4.6 is still detected above pH 9 (Fig. 3, A and B). Moreover, the species formed at alkaline pH does not display maximum absorbance at 340 nm but rather at 334 nm, whereas the isosbestic point is shifted from 361 to 348 nm. The spectral transition is no longer affected by chloride, and the extreme cooperativity is lost (Fig. 3C).
FIGURE 3.
pH-dependent absorption changes. A, absorption spectra of GadBH465A at pH 4.86, 5.9, 7.16, 7.56, and 8.9 and of wild type GadB (inset) at pH 4.86, 5.13, 5.33, 5.64, and 6.84. B, absorption spectra of GadBΔHT at pH 4.56, 6.9, 7.16, 8.5, and 8.9. Protein concentration was 7.7 μm, and the spectra were recorded in 50 mm potassium phosphate buffer at the indicated pH values. The arrows indicate the change in absorbance at 420 nm and at 340 nm upon increasing pH. C, the pH variation at 420 nm is represented for wild type GadB, in the absence (filled squares) and presence (empty squares) of 50 mm NaCl, for GadBH465A (filled triangles) and for GadBΔHT (empty circles). The solid and the dashed lines through the experimental points show the theoretical curves obtained using Equations 1 and 2, respectively.
The finding that the pH-dependent transition does not go to completion at alkaline pH suggests that the deprotonation responsible is not that of the protonated aldimine itself. Instead, it must result from protonation of a group affecting the equilibrium between the two chromophores involved. The pH dependence of absorbance at 420 nm fit well to Equation 1 with values of n lower than 1 (Table 2), indicating a negatively cooperative process. This is consistent with a mechanism, described by Equation 2, in which protonation of a group in one GadB monomer decreases the proton affinity of the corresponding group in one or more of the other monomers. The data fit well to Equation 2, with pK values of 6.7 and 8.4.
TABLE 2.
Hill parameters from curve fitting of the 420 nm absorbance readings as a function of pH
| n | pK | |
|---|---|---|
| GadBH465A | 0.58 ± 0.06 | 7.43 ± 0.07 |
| GadBΔHT | 0.49 ± 0.06 | 7.55 ± 0.19 |
| GadB wt | 12.07 ± 1.82 | 5.308 ± 0.006 |
| GadB wt + NaCl | 6.74 ± 0.66 | 5.690 ± 0.007 |
The values reported were calculated using the integrated Hill equation.
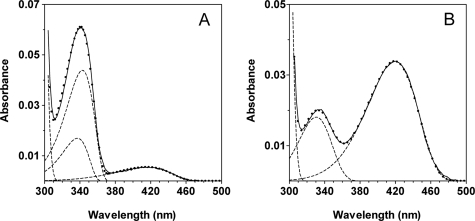
The absorption spectra at pH 4.6 and 6.8 (wild type) or 8.5 (GadBH465A and GadBΔHT) were resolved into their component absorption bands (Fig. 4 and data not shown). Good fits were obtained to two components in all cases except for wild type GadB at pH 6.8 (Fig. 4A) where three components were required, with λmax values of 330, 341.5, and 410 nm. Because the species absorbing at 341.5 nm predominates at pH 6.8 in wild type GadB and is absent from the spectra of the mutants, it is deduced to be the aldamine with His465.
FIGURE 4.
Deconvolution of spectra. A, absorption spectrum of wild type GadB at pH 6.84 resolved into its component absorption bands. B, absorption spectrum of GadBH465A at pH 8.5 resolved into its component absorption bands. The deconvolution of the spectrum of GadBΔHT at pH 8.5 gave results identical to those for GadBH465A. The protein concentration was 7.7 μm. The spectra were recorded in 50 mm potassium phosphate buffers at the indicated pH. The solid lines represent the experimental spectra, the dashed lines are the component bands, and the dotted curve is the theoretical curve obtained by nonlinear least square fit of the experimental points to the sum of a variable number of log normal curves, each having independent parameters.
CD and Fluorescence Properties
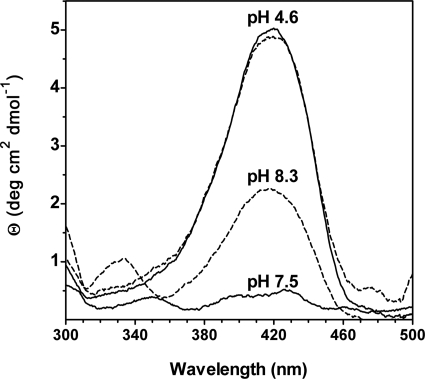
The effects of mutating His465 on the CD and fluorescence spectra of GadB were investigated. The CD spectrum of GadBH465A at pH 4.6 displays a peak at 420 nm, coinciding in intensity and shape with that of wild type GadB (Fig. 5). At alkaline pH the CD spectra are significantly different; in wild type GadB the CD signal at pH 7.5 is essentially flat in the range 300–500 nm, whereas in GadBH465A at pH 8.3 the 420-nm signal is still present and accounts for more than 45% of the signal detected at pH 4.6 (Fig. 5). In addition GadBH465A at a pH level of >7.5 shows a positive CD signal centered at 332 nm. The CD spectra of GadBΔHT were very similar to those of GadBH465A.
FIGURE 5.
CD spectra at different pHs. The CD spectra of wild type GadB at pH 4.6 and 7.5 are shown with solid lines. The CD spectra of GadBH465A at pH 4.6 and 8.3 are shown with a dashed line. The CD spectra of GadBΔHT at pH 8.5 are omitted because they are identical to those of GadBH465A. Protein concentration was 60 μm as referred to the PLP content. The spectra were recorded in 50 mm potassium phosphate buffer at the indicated pH.
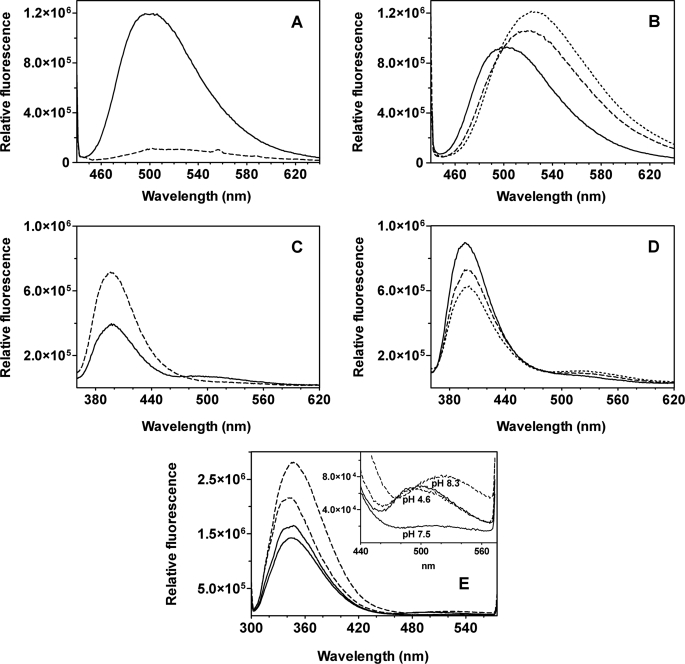
The fluorescence properties of wild type GadB, GadBH465A, and GadBΔHT were analyzed at acidic and alkaline pH. When excited at 430 nm at pH 4.6 both wild type and mutants show an emission spectrum with a maximum at 500 nm (Fig. 6, A and B). The fluorescence changes significantly at alkaline pH; wild type GadB exhibits very little fluorescence upon excitation at 430 nm (Fig. 6A), whereas the fluorescence of both mutants increases and shifts to 522 nm (Fig. 6B).
FIGURE 6.
Fluorescence emission spectra at different pHs. A–D, wild type GadB (A) and GadBH465A (B) emission spectra were recorded at pH 4.6 (solid line), 7.5 (dashed line), and 8.3 (dotted line) following excitation at 430 nm. Wild type GadB (C) and GadBH465A (D) emission spectra were recorded at pH 4.6 (solid line), 7.5 (dashed line), and 8.3 (dotted line) following excitation at 345 nm. The protein concentration was 3 μm. E, emission spectra upon excitation at 295 nm of wild type GadB (solid line) and GadBH465A (dashed line) at the indicated pH values. The protein concentration was 0.3 μm. The buffer used was 50 mm potassium phosphate at the indicated pH. Fluorescence emission spectra of GadBΔHT were omitted because they were similar to those of GadBH465A.
Upon excitation at 345 nm the wild type enzyme and the mutants display different emission spectra both at acidic and alkaline pH. The emission spectrum of wild type GadB at pH 4.6 shows two maxima, at 390 and 500 nm, whereas at pH 7.5 it exhibits only one peak with a maximum at 390 nm (Fig. 6C). The emission spectrum at pH 4.6 of both His465 mutants displays a maximum at 390 nm, which decreases upon alkalinization with a concomitant increase at 510 nm (Fig. 6D). Upon excitation of Trp residues at 295 nm (Fig. 6E), the emission spectrum of wild type GadB exhibits maxima at 355 and 490 nm at pH 4.6 and at 355 nm at pH 7.5. The fluorescence emission spectra of both mutants obtained upon excitation at 295 nm display maxima at 355 and 490 nm at acidic pH and at 355 and 520 nm at alkaline pH.
pH-dependent Cellular Partition
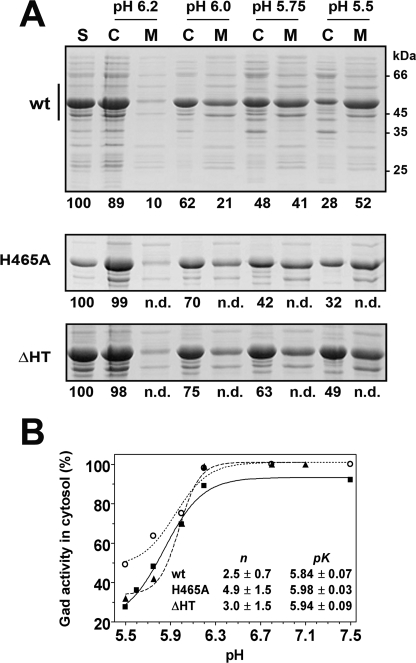
To assess whether in the two mutants the six N termini still form two triple helical bundles at acidic pH and whether this remains a cooperative process, despite the absence of cooperativity from the change in absorbance spectrum (Fig. 3C and Table 2), we relied on an earlier finding: the acid-induced formation of the triple bundles determines the partition of the enzyme between cytosolic and membrane fractions (4). The two fractions, obtained by ultracentrifugation of cell extracts from the E. coli strains overexpressing wild type GadB, GadBH465A, and GadBΔHT, were resuspended at four different pH values: 5.5, 5.75, 6.0, and 6.2. The distribution of the different forms of the enzyme was determined by SDS gel electrophoresis and by activity measurements (Fig. 7). The proportion of all three proteins found in the membrane fractions increases with pH, and the process is cooperative. The transition midpoint is at pH 5.9 for all three proteins. The cooperativity levels are similar (n ≈ 3.0) within the experimental error. However, for wild type enzyme the cooperativity is significantly lower than that governing the change in absorption spectrum (Fig. 3A, inset, and Table 2).
FIGURE 7.
Effect of pH on the cellular localization of wild type and mutants GadB. A, 12% SDS-PAGE of cell supernatants (S, 20 μg), obtained after cell lysis and centrifugation to remove cell debris; the cytoplasmic (C, 20 μg) and membrane (M, 20 μg) fractions were obtained as described elsewhere. The electrophoretic mobilities of molecular mass standards (kDa) are shown on the right of the top panel. The vertical bar indicates the region of the gel shown for GadBH465A (middle panel) and GadBΔHT (bottom panel). The decarboxylase activity assayed in each sample is provided as percentage with respect to the corresponding cell supernatant (S = 100%). The reported activity values represent the means of two independent experiments, with a variation that does not exceed 10% of the stated value. B, graphical representation of Gad activity in the cytosol as a function of pH: wild type (wt) GadB (filled squares), GadBH465A (filled triangles), and GadBΔHT (empty circles). The lines through the experimental points represent the theoretical curves obtained using the Hill equation. Solid line, wild type GadB; dashed line, GadBH465A; dotted line, GadBΔHT. The corresponding n and pK values are listed in the inset.
Catalytic Properties
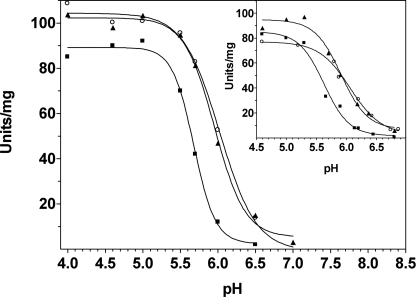
Spectroscopic analysis provided evidence that in both His465 mutants the 420-nm absorbing species is still significantly present at very high pH values. This species is considered the catalytically competent one. The activity of both mutants was therefore assayed in the pH range 4.0–7.0 using a pH-stat device without added buffer (Fig. 8). Similar results were obtained by measuring the activity either in acetate or in phosphate buffer (Fig. 8, inset). The data of activity versus pH fit well to the Hill equation, suggesting that cooperativity still affects the enzyme activity (n = 2–3), although not at the same high levels as in the spectroscopic changes. The transition midpoint was at pH 5.6 in wild type GadB and at pH 6.0 in the mutants.
FIGURE 8.
Effect of pH on the specific activity of wild type GadB and His465 mutants. Glutamate decarboxylase activity (units/mg) as a function of pH was measured using a pH-stat device (see “Experimental Procedures”) in a buffer-free system or in the presence of phosphate buffer (inset). Filled squares, wild type GadB; filled triangles, GadBH465A; empty circles, GadBΔHT. The solid lines through the experimental points represent the theoretical curves obtained using the Hill equation.
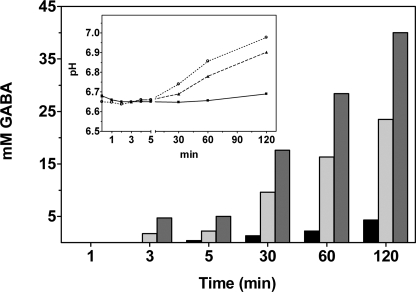
At pH 6.7 GadBH465A and GadBΔHT still decarboxylate l-glutamate at a significant rate (Fig. 8). The reaction was followed in 50 mm phosphate buffer at pH 6.7 over a 2-h period; more than 47% of the 50 mm glutamate in the reaction mixture was converted into GABA by the mutants versus 8% by wild type GadB (Fig. 9). Because of the significant amount of protons used up during the reaction, the pH of the solution increased of 0.3 unit, which probably hampered the complete conversion of substrate in the reaction mixture.
FIGURE 9.
Time course of GABA production. GABA production was analyzed over a period of 2 h in wild type GadB (black), GadBH465A (light gray), or GadBΔHT (dark gray). The decarboxylation reaction was carried out at 30 °C in 4 ml of 50 mm potassium phosphate buffer, pH 6.7, in the presence of 40 μm PLP and 50 mm glutamate. The enzyme concentration is 2 μm. During the reaction aliquots (200 μl) were withdrawn and analyzed to assess GABA content with the Gabase assay. The pH changes during the reaction were also recorded (inset). The symbols and lines used are as in Fig. 7B. The reported values represent the means of three independent experiments, with a variation not exceeding 10% of the stated value.
DISCUSSION
The production in bacteria of inducible decarboxylases was elegantly shown more than 60 years ago by Gale (27), who stated that it “may be the method by which the organism extends its (pH) range of existence.” Indeed the neutrophilic bacterium E. coli can survive for more than 2 h at pH ≤ 2.5, when glutamate is supplied in minimal medium and Gad activity is essential to this ability (28, 29). The acidic pH optimum of Gad is well suited to the intracellular pH 4.5, occurring upon exposure to an extremely acidic environment (pH < 2.5) like that of the stomach. Gad activity was suggested to be beneficial to the micro-organism by contributing to proton consumption and to the inversion of membrane potential, counteracting the entry of more protons (2, 4).
The present work was undertaken with the aim of providing new insights into the molecular basis of the pH-dependent mechanism of Gad regulation, in particular with respect to the role played by His465, the residue locking the active site by forming an aldamine with the PLP-Lys276 Schiff base (3). One inevitable effect of mutating His465 is that the contribution of aldamine formation is eliminated from the pH-dependent equilibrium between active and inactive forms of the enzyme. A second inevitable effect is that the pH dependence of aldamine formation, which requires the imidazole of histidine to be deprotonated, is also eliminated. An unexpected finding was the major effect that the mutations exert on the cooperativity and midpoint of pH-dependent spectroscopic transition.
Cooperativity
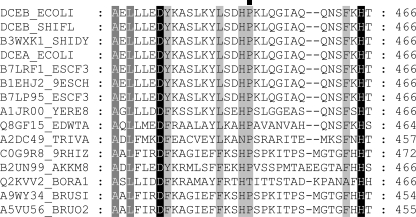
Earlier experiments on GadBΔ1–14 showed that the inability to form N-terminal helical bundles lowers the cooperativity from n ≫ 6 to n ≈ 2 (3). Here we show that the formation of the triple helical bundles is still cooperative both in the His465 mutants and in wild type GadB, but in this case n ≈ 3. The point of half transition is at pH 5.9. Notably O'Leary and Brummund (7) showed that E. coli Gad, both native and borohydride-reduced (in which aldamine formation/decomposition cannot occur), undergo a rate determining step, consisting of the loss of three protons, before detecting the spectral changes. Based on our and on previous results (3, 7), we suggest that the contribution from N-terminal helix formation to the cooperativity of the whole system is equivalent to n ≈ 3 and that bundles fold/unfold independently from the events occurring at the active site. Thus the spectroscopic changes of GadB not only track the conformational changes in the active site but also indirectly record the rate-determining conformational changes at the distant N termini (3). It is tempting to assume that during evolution a histidine residue was selected for aldamine formation because the pK of its distal side chain nitrogen (6.0) is very close to the pK at which the transition between the folded and unfolded state of the bundles occurs, thus allowing both events (aldamine formation and bundle formation) to become linked. This assumption is substantiated by a Ka/Ks ratio analysis of the coding sequences of GadB and of 14 among its orthologues and paralogues. This kind of analysis detects which residues in a protein evolve neutrally and which ones, because of their structural or functional importance, are subjected to purifying selection (30). In the case of GadB the 14-residue-long C-terminal tail, although conformationally disordered at low pH, possesses one residue under strong purifying selection, and this is indeed that corresponding to E. coli GadB His465 (Fig. 10).
FIGURE 10.
Multiple sequence alignment of the C-terminal region of E. coli GadB (UniProt code DCEB_ECOLI) and 14 of its orthologues/paralogues. Background shading indicates residues under purifying selection in a Ka/Ks ratio analysis of coding sequences (the darker the shading the stronger the purifying selection, light gray corresponds to SELECTON score 5, dark gray corresponds to 6, and black corresponds to 7). A black square denotes the last residue (Pro452) of the folded core of GadB, after which the 14-residue-long C-terminal tail begins. The other sequences in the alignment are from: S. flexneri (DCEB_SHIFL), Shigella dysenteriae 1012 (B3WXK1_SHIDY), E. coli GadA (DCEA_ECOLI), Escherichia fergusonii (B7LRF1_ESCF3), Escherichia albertii TW07627 GadA (B1EHJ2_9ESCH), E. fergusonii GadA (B7LP95_ESCF3), Yersinia enterocolitica serotype O:8 (A1JR00_YERE8), Edwardsiella tarda (Q8GF15_EDWTA), Trichomonas vaginalis G3 (A2DC49_TRIVA), Brucella ceti str. Cudo (C0G9R8_9RHIZ), Akkermansia muciniphila (B2UN99_AKKM8), Bordetella avium (Q2KVV2_BORA1), Brucella suis (A9WY34_BRUSI), and Brucella ovis (A5VU56_BRUO2).
Because positive cooperativity in the spectroscopic transition is lost when His465 is removed (Fig. 3C), this residue is likely responsible for the residual cooperativity observed in GadBΔ1–14 (3, 4). Its absence massively affects the equilibrium between the open and closed active sites. This partially explains the finding that both mutants are at least twice as active as wild type GadB in the pH range 5.7–7.0 (Fig. 8).
In wild type GadB the level of cooperativity of the catalytic activity as a function of pH is significantly lower (n = 2–3) than that of the change in absorption spectrum. The difference likely arises because the absorption spectrum changes were observed on the free enzyme, whereas the activity measurements were initial velocities taken at high glutamate concentration. Under the latter conditions, the active sites of the enzyme are fully occupied by glutamate so that His465 cannot enter. Notably a similar level of cooperativity, although not detectable at the spectroscopic level, is observed in the His465 mutants. Because the conformational change occurring at the N termini is still a cooperative process in the mutants, the cooperativity in the activity is likely due to one or more residues, also undergoing a conformational change. One candidate is Asp86, a substrate-binding residue located on a loop taking up different conformations in the high and low pH forms of GadB (4).
The negative cooperativity of the spectroscopic changes in the mutants also needs to be explained. Based on the fitting of the experimental data, we assume that the pK of an ionizable group affecting the equilibrium between the 420- and the 334-nm absorbing species increases as a consequence of the conformational change. Such a perturbation in the pK of an ionizable group often occurs on catalytic groups of enzymes active sites and is known as the Born effect (or desolvation effect); it favors the neutral form of a titratable group when transferred from a polar to an apolar environment (31). Analysis of the His465 mutants revealed that an active site residue undergoes this change in pK when the active site environment of GadB becomes less polar.
Spectroscopic Properties
E. coli GadB is the only PLP-dependent enzyme where an aldamine form of the cofactor was crystallographically observed (3). Thus it can be used to analyze the aldamine contribution to the spectroscopic properties of a PLP-dependent enzyme and to compare these properties with those of chemical models (9, 15).
UV-visible spectroscopy confirms that in the absence of His465, the active site of GadB is less efficiently locked. This is mainly substantiated by the persistence of the 420-nm absorbing ketoenamine species, typical of a more hydrated active site (5, 32), which is still appreciably detected at pH >9.0.
Several spectroscopic lines of evidence confirm that the 340-nm species is the aldamine. Deconvolution of spectra show that the 340-nm absorbing species, detected as the major species in wild type GadB at pH 6.8, is absent in the mutants, and a 327-nm absorbing species is present instead. In CD spectra both His465 mutants display, unlike wild type GadB, optical activity centered at 332 nm. We propose that in wild type GadB the aldamine contribution via the sp3 hybridized C4′ of the cofactor is opposite in sign to the Cotton effect because of the active site environment of the cofactor, thus resulting in an almost undetectable optical activity, confirming the hypothesis of O'Leary and Brummund (7).
Fluorescence emission spectroscopy of wild type GadB and of the His465 mutants provided insight into the nature and fluorescence properties of the PLP derivatives embedded in the active site. Upon alkalinization the emission of the mutants shifts from 490 to 522 nm when excited at 430 nm; this can be attributed to the ketoenamine species, switching from a polar to an apolar environment. A model PLP-hexylamine Schiff base behaves similarly when analyzed in chloroform instead of water (9).
Upon excitation at 345 nm wild type GadB at acidic pH and the His465 mutants at any pH exhibit two emission maxima, at 390 and 490 nm, with the former always prevailing. We propose that the enolimine tautomer of the PLP-Lys276 Schiff base is being detected in these conditions. In model studies the fluorescence emission of enolimine is characterized by an unusually high Stoke shift (9,000–11,000 cm−1) (15) because of an intramolecular proton transfer in the excited state, yielding the ketoenamine as the excited species, which then emits fluorescence at long wavelengths (15). The rates of proton transfer and radiative decay from the ketoenamine (≈510 nm) or directly from the enolimine (≈430 nm) were suggested to account for the relative intensities of the two fluorescence emission maxima in phosphorylase b and other PLP-dependent enzymes (33, 34). Thus we suggest that in the absence of His465 side chain the enolimine tautomer is present in the active site of GadB; enolimine is typically detected when the active site becomes less polar (9). This is in accord with previous findings with the GadB Lys276 mutant (5). The complexity of the fluorescence emission spectrum of the 330–340-nm absorbing species in GadB appears to arise from the combined effects of several factors: the C4′ hybridization, the radiation energy-induced intramolecular proton transfer between Schiff base tautomers, and their respective radiation decay rates. However, based on the present findings, it cannot be excluded that similar results could be obtained with carbinolamine (34).
Catalytic Properties
It has been recently shown that wild type GadB can be efficiently entrapped in calcium alginate beads (immobilized) and used in a reactor set-up with a pH-stat to perform the decarboxylation reaction at pH 4.6 in the absence of a buffer system (20). Immobilization does not affect the pH dependence of enzyme activity. Because glutamic acid is abundant in waste streams from biofuel production, it is regarded as an interesting starting material for the synthesis of nitrogen-containing bulk chemicals, which can be derived from GABA (20). Because in GadBH465A and GadBΔHT the active site “lock” cannot be formed and the range of activity is significantly extended toward alkaline pH, they are very attractive for the above application. Indeed at pH 5.9 the specific activity of both mutants is four times higher than that of wild type GadB. At this pH glutamic acid is much more soluble than at pH 4.6 (35). This is very advantageous for use in a bioreactor, because it removes, with massive gains in efficiency, the bottleneck caused by the limited solubility of glutamate at the acidic pH optimum of wild type GadB.
In conclusion, aldamine formation contributes significantly to the inactivation of GadB and to its pH-dependent activity profile. The pK of the distal imidazolic nitrogen of His465 affects the pH-dependent spectroscopic and catalytic properties of E. coli GadB, and His465 must be present to integrate the cooperativity of triple helix formation into the cooperativity of the whole system. Notably, in the eukaryotic relative of E. coli GadB, Arabidopsis thaliana Gad1, this residue is not found in the long C-terminal tail, instrumental to activity regulation by pH and by Ca2+/calmodulin binding, and this probably explains why Gad1 does not undergo the same mechanism of inactivation (19).
This work was supported by the Istituto Pasteur-Fondazione Cenci Bolognetti and the Italian Ministero dell'Istruzione dell'Università e della Ricerca (to D. D. B. and F. B.).
- PLP
- pyridoxal 5′-phosphate
- GABA
- γ-aminobutyrate
- GadB
- glutamate decarboxylase.
REFERENCES
- 1.Ueno H. (2000) J. Mol. Catal. B Enzym. 10, 67–79 [Google Scholar]
- 2.Foster J. W. (2004) Nat. Rev. 2, 898–907 [DOI] [PubMed] [Google Scholar]
- 3.Gut H., Pennacchietti E., John R. A., Bossa F., Capitani G., De Biase D., Grütter M. G. (2006) EMBO J. 25, 2643–2651 [DOI] [PMC free article] [PubMed] [Google Scholar]
- 4.Capitani G., De Biase D., Aurizi C., Gut H., Bossa F., Grütter M. G. (2003) EMBO J. 22, 4027–4037 [DOI] [PMC free article] [PubMed] [Google Scholar]
- 5.Tramonti A., John R. A., Bossa F., De Biase D. (2002) Eur. J. Biochem./FEBS 269, 4913–4920 [DOI] [PubMed] [Google Scholar]
- 6.Shukuya R., Schwert G. W. (1960) J. Biol. Chem. 235, 1653–1657 [PubMed] [Google Scholar]
- 7.O'Leary M. H., Brummund W., Jr. (1974) J. Biol. Chem. 249, 3737–3745 [PubMed] [Google Scholar]
- 8.O'Leary M. H. (1971) Biochim. Biophys. Acta 242, 484–492 [DOI] [PubMed] [Google Scholar]
- 9.Shaltiel S., Cortijo M. (1970) Biochem. Biophys. Res. Commun. 41, 594–600 [DOI] [PubMed] [Google Scholar]
- 10.Ikushiro H., Hayashi H., Kawata Y., Kagamiyama H. (1998) Biochemistry 37, 3043–3052 [DOI] [PubMed] [Google Scholar]
- 11.Misono H., Soda K. (1977) J. Biochem. 82, 535–543 [PubMed] [Google Scholar]
- 12.Ro H. S., Hong S. P., Seo H. J., Yoshimura T., Esaki N., Soda K., Kim H. S., Sung M. H. (1996) FEBS Lett. 398, 141–145 [DOI] [PubMed] [Google Scholar]
- 13.Bertoldi M., Cellini B., Clausen T., Voltattorni C. B. (2002) Biochemistry 41, 9153–9164 [DOI] [PubMed] [Google Scholar]
- 14.Zhang J., Cheltsov A. V., Ferreira G. C. (2005) Protein Sci. 14, 1190–1200 [DOI] [PMC free article] [PubMed] [Google Scholar]
- 15.Johnson G. F., Tu J. I., Bartlett M. L., Graves D. J. (1970) J. Biol. Chem. 245, 5560–5568 [PubMed] [Google Scholar]
- 16.De Biase D., Tramonti A., John R. A., Bossa F. (1996) Protein Expr. Purif. 8, 430–438 [DOI] [PubMed] [Google Scholar]
- 17.Laemmli U. K. (1970) Nature 227, 680–685 [DOI] [PubMed] [Google Scholar]
- 18.Peterson E. A., Sober H. A. (1954) J. Am. Chem. Soc. 76, 169–175 [Google Scholar]
- 19.Gut H., Dominici P., Pilati S., Astegno A., Petoukhov M. V., Svergun D. I., Grütter M. G., Capitani G. (2009) J. Mol. Biol. 392, 334–351 [DOI] [PubMed] [Google Scholar]
- 20.Lammens T. M., De Biase D., Franssen M. C. R., Scott E. L., Sanders J. P. M. (2009) Green Chem. 11, 1562–1567 [Google Scholar]
- 21.Tramonti A., De Biase D., Giartosio A., Bossa F., John R. A. (1998) J. Biol. Chem. 273, 1939–1945 [DOI] [PubMed] [Google Scholar]
- 22.Metzler D. E., Harris C. M., Johnson R. J., Saino D. B., Thomson J. A. (1973) Biochemistry 12, 5377–5392 [DOI] [PubMed] [Google Scholar]
- 23.Notredame C., Higgins D. G., Heringa J. (2000) J. Mol. Biol. 302, 205–217 [DOI] [PubMed] [Google Scholar]
- 24.Kulikova T., Akhtar R., Aldebert P., Althorpe N., Andersson M., Baldwin A., Bates K., Bhattacharyya S., Bower L., Browne P., Castro M., Cochrane G., Duggan K., Eberhardt R., Faruque N., Hoad G., Kanz C., Lee C., Leinonen R., Lin Q., Lombard V., Lopez R., Lorenc D., McWilliam H., Mukherjee G., Nardone F., Pastor M. P., Plaister S., Sobhany S., Stoehr P., Vaughan R., Wu D., Zhu W., Apweiler R. (2007) Nucleic Acids Res. 35, D16–D20 [DOI] [PMC free article] [PubMed] [Google Scholar]
- 25.Wernersson R., Pedersen A. G. (2003) Nucleic Acids Res. 31, 3537–3539 [DOI] [PMC free article] [PubMed] [Google Scholar]
- 26.Stern A., Doron-Faigenboim A., Erez E., Martz E., Bacharach E., Pupko T. (2007) Nucleic Acids Res. 35, W506–W511 [DOI] [PMC free article] [PubMed] [Google Scholar]
- 27.Gale E. F. (1940) Biochem. J. 34, 392–413 [DOI] [PMC free article] [PubMed] [Google Scholar]
- 28.De Biase D., Tramonti A., Bossa F., Visca P. (1999) Mol. Microbiol. 32, 1198–1211 [DOI] [PubMed] [Google Scholar]
- 29.Lin J., Smith M. P., Chapin K. C., Baik H. S., Bennett G. N., Foster J. W. (1996) Appl. Environmental Microbiol. 62, 3094–3100 [DOI] [PMC free article] [PubMed] [Google Scholar]
- 30.Hurst L. D., Williams E. J., Pál C. (2002) Trends Genet. 18, 604–606 [DOI] [PubMed] [Google Scholar]
- 31.Harris T. K., Turner G. J. (2002) IUBMB Life 53, 85–98 [DOI] [PubMed] [Google Scholar]
- 32.Vázquez M. A., Muñoz F., Donoso J., García Blanco F. (1991) Biochem. J. 279, 759–767 [DOI] [PMC free article] [PubMed] [Google Scholar]
- 33.Zhou X., Toney M. D. (1999) Biochemistry 38, 311–320 [DOI] [PubMed] [Google Scholar]
- 34.Honikel K. O., Madsen N. B. (1972) J. Biol. Chem. 247, 1057–1064 [PubMed] [Google Scholar]
- 35.Amend J. P., Helgeson H. C. (1997) Pure Appl. Chem. 69, 935–942 [Google Scholar]


