

Abstract
Electrochemistry coupled with Fourier transform infrared (IR) spectroscopy was used to investigate the redox properties of recombinant alternative ubiquinol oxidase from Trypanosoma brucei, the organism responsible for African sleeping sickness. Stepwise reduction of the fully oxidized resting state of recombinant alternative ubiquinol oxidase revealed two distinct IR redox difference spectra. The first of these, signal 1, titrates in the reductive direction as an n = 2 Nernstian component with an apparent midpoint potential of 80 mV at pH 7.0. However, reoxidation of signal 1 in the same potential range under anaerobic conditions did not occur and only began with potentials in excess of 500 mV. Reoxidation by introduction of oxygen was also unsuccessful. Signal 1 contained clear features that can be assigned to protonation of at least one carboxylate group, further perturbations of carboxylic and histidine residues, bound ubiquinone, and a negative band at 1554 cm−1 that might arise from a radical in the fully oxidized protein. A second distinct IR redox difference spectrum, signal 2, appeared more slowly once signal 1 had been reduced. This component could be reoxidized with potentials above 100 mV. In addition, when both signals 1 and 2 were reduced, introduction of oxygen caused rapid oxidation of both components. These data are interpreted in terms of the possible active site structure and mechanism of oxygen reduction to water.
Introduction
Mitochondria from many higher plants possess, in addition to the conventional cytochrome c oxidase, a second terminal oxidase that oxidizes ubiquinol (1–3). In thermogenic plants this alternative oxidase (AOX)6 plays a key role in the release of heat for pollination purposes or for maintaining a warm environment within the flower at low ambient temperatures. In nonthermogenic plants its function is still under debate; proposed roles include maintaining tricarboxylic acid cycle turnover under high cytosolic phosphorylation potentials, defense against oxidative stress, and growth rate and energy charge homeostasis (4). AOX is also found in species of fungi, green algae, bacteria, and protozoa (5) and, more recently, in mollusks, nematodes, and chordates (6). Of particular importance, however, is its presence in pathogenic protozoa such as the blood parasite Trypanosoma brucei (7) and the intestinal parasite Cryptosporidium parvum (8, 9). T. brucei is a parasite that causes African sleeping sickness in humans and Nagana in livestock and is transmitted by the tsetse fly (7). The bloodstream forms of T. brucei appear to depend solely on its alternative oxidase (TAO) for respiration. Because the protein is absent from the mammalian host, TAO is an attractive and important chemotherapeutic target for African trypanosomiasis (7–10). In this respect it is interesting to note that ascofuranone, isolated from the pathogenic fungus Ascochyta visiae, specifically and potently inhibits the quinol oxidase activity of TAO (11) and rapidly kills the parasites. In addition, the chemotherapeutic efficacy of ascofuranone in vivo has been confirmed (12).
Compared with other respiratory chain complexes, the structure and mechanism of AOX are poorly characterized because of difficulties encountered in purification and a dearth of spectroscopic signatures. It has been proposed from sequence comparisons that AOX is a nonheme diiron carboxylate protein in which the metal atoms are ligated by glutamic acid and histidine residues within a four-helix bundle (1, 2, 13). The requirement for such a tertiary structural motif, as well as the necessary spacing between the iron-ligating amino acids, imposes considerable constraints upon overall possible three-dimensional structure and, consequently, its attachment to the membrane. The current model of the AOX, supported by mutagenesis studies, predicts a monotopic integral membrane protein (2, 13–15) associating with one leaflet of the lipid bilayer. Although analyses of yeast and trypanosomal enzymes have established that iron is required for activity (16, 17), early investigations of either mitochondria or partially purified protein failed to reveal spectroscopic signatures of its active site (18, 19). The first spectroscopic evidence for iron involvement was provided by Berthold et al. (20), who reported two EPR signals in Escherichia coli membranes that contained an overexpressed, truncated but active Arabidopsis thaliana alternative oxidase (AOX1a) fused to a maltose-binding protein. A signal around g = 15, observed with parallel mode EPR in reduced samples, was attributed to the diferrous state. A second signal, observed only after reaction of this state with oxygen, was assigned to a mixed valence (FeIIFeIII) form. More recently, Affourtit and Moore (21) prepared an active AOX protein from Arum maculatum. Parallel mode EPR studies (22) confirmed the presence of the diferrous signal in the reduced protein but attempts to generate the mixed valence signal of Berthold et al. (20) were not successful. Further spectroscopic tools are clearly desirable to resolve these inconsistencies, and, with this aim in mind, we report here the first electrochemical/FTIR study of a highly purified and stable preparation of recombinant AOX (rTAO) from T. brucei.
EXPERIMENTAL PROCEDURES
Isolation of rTAO
TAO was expressed in E. coli FN102 (ΔhemA) as described previously (23). In brief, rTAO was extracted by 1.4% (w/v) n-octyl-β-d-glucopyranoside, and, because rTAO was fused with an N-terminal histidine tag, solubilized rTAO was purified by cobalt affinity chromatography. The solubilized enzyme was bound to the cobalt affinity resin in the presence of detergent, and 100% of the rTAO activity was recovered from the column when n-octyl-β-d-glucopyranoside in the washing and elution buffers was exchanged with 0.042% (w/v) n-dodecyl-β-d-maltopyranoside. Finally, purified rTAO was obtained by two-step elution with 165 mm and 200 mm imidazole, which resulted in a very efficient purification of active rTAO in the presence of n-dodecyl-β-d-maltopyranoside (see supplemental Fig. S1). Specific activity of the final preparation was 207 μmol/min per mg using 150 μm ubiquinol-1.
ATR-FTIR Spectroscopy
Mid-IR spectra were recorded in ATR mode with a Bruker IFS/66S FTIR spectrophotometer fitted with a liquid nitrogen-cooled MCT-A detector at 4 cm−1 resolution, giving an accuracy of cited frequencies of ±1 cm−1.
Sample Preparation
To remove the imidazole and to favor the interaction of the protein with the ATR prism surface, 100 μg of rTAO was diluted in 2.5 ml of 1 mm potassium phosphate buffer, pH/pD 7.0, and centrifuged at 450,000 × g, 4 °C, for 30 min. The pellet was resuspended with 2.5 ml of the same buffer and centrifuged for 15 min under the same conditions. The pellet was finally resuspended with 8 μl of 1 mm potassium phosphate, pH/pD 7.0. This solution was then quickly put on the ATR prism and dried under a nitrogen flow (4–5 min). The dried protein was rewetted with 10 μl of a 1 mm potassium phosphate buffer, pH/pD 7.0. The protein sample was stable with an amide II band intensity of 0.1–0.2.
Electrochemically Induced Spectroscopy
An ATR-FTIR-compatible cell with a platinum mesh working electrode was built on top of the sample layer. It was connected via a Vycor frit to a platinum sheet counter and Ag/AgCl reference electrodes (24). The chamber was filled with a freshly prepared mediator solution, and the sample was allowed to equilibrate for 1 h before starting any redox experiment. Buffer alone was placed in the reference/counter electrode chamber. All of the potential values are quoted relative to the normal hydrogen electrode.
Reduced minus oxidized spectra were induced electrochemically in 100 mm potassium phosphate, 100 mm KCl at pH/pD 7.0 and containing 500 μm potassium ferricyanide and 100 μm benzyl viologen as redox mediators. Working electrode potentials were +550 mV for oxidation and −400 mV for reduction. IR difference spectra were measured by recording a background spectrum (500 interferograms) at one potential, then switching to the second potential and recording a sample spectrum after a 13-min equilibration. Redox cycles were repeated 40 times in H2O buffer (30 times in D2O buffer), and reductive and oxidative spectra were averaged to produce the redox spectra shown.
For redox titration experiments, two different mixtures of mediators in 100 mm potassium phosphate, 100 mm KCl at pH 7.0 were tested: (i) 200 μm indigo trisulfonate (n = 2; E0′ = −81 mV) + 200 μm ruthenium hexamine (n = 1; E0′ = +20 mV) + 200 μm 2,4-naphthoquinone disulfonic acid (n = 2; E0′ = +120 mV) or (ii) 200 μm indigo trisulfonate + 200 μm 2,4-naphthoquinone disulfonic acid + 200 μm phenazine methosulfate (n = 2; E0′ = +80 mV) + 100 μm gallocyanine (n = 2; E0′ = +20 mV) + 1 mm ferricyanide (n = 1; E0′ = +430 mV). IR difference spectra were measured against a background spectrum of the fully oxidized (air-oxidized) sample. Reductive potentials between +200 mV and −100 mV were applied, and 15–20 min were required between two potential steps to achieve stability of the intensity of the two peak/troughs at 1658/1641 and 1544/1554 cm−1. The signal amplitudes were expressed as a fraction of those of a reduced minus air-oxidized spectrum. They were plotted against potentials and simulated with the Nernstian equation,
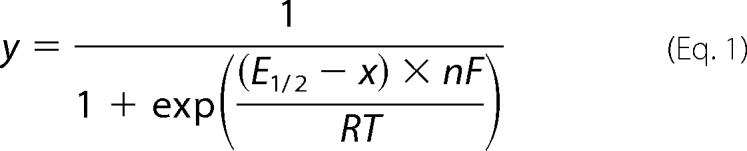 |
where y is the oxidized fraction of TAO, x is the potential of the solution (in V), E1/2 is the midpoint potential for the redox couple at pH 7.0, and n is the number of electrons involved in the reaction (F = 96 485 C·mol−1; r = 8.314 J·mol−1·K−1; T = 298 K). The reproducible data in Fig. 2 were obtained from a single 4-h titration.
FIGURE 2.

Reductive titration of rTAO. A, difference spectra recorded during a reductive titration in 100 mm potassium phosphate, 100 mm KCl at pH 7.0 (see “Experimental Procedures”). B, plots of peak/trough intensities at 1658/1641 and 1544/1554 cm−1 versus potential. Data were simulated with a Nernst-derived equation for an n = 2 component with E1/2 = 79 mV.
Calculations of Vibrational Spectra
IR-active normal modes of tyrosine (Tyr-OH), tyrosinate (Tyr-O−), and tyrosyl (Tyr-O•) were calculated on the UCL Legion parallel supercomputer cluster using Gaussian03 (25) with the B3LYP/6–13G(d) density functional and dataset. Data were obtained both for the zwitterionic free tyrosine as well as for tyrosine in a modified tripeptide (NH2-Gly-Tyr-Gly-COCH3) to better reflect protein environment. Molecular structures were first built with Facio (2006). Structures were then energy-minimized before calculating frequencies. Frequencies cited have been multiplied by the published scaling factor of 0.9614 (25).
RESULTS AND DISCUSSION
Secondary Structure Estimation
Information on protein secondary structure can be obtained from analyses of component bands within the amide I envelope of absolute IR absorption spectra (26, 27). Such an analysis performed on the IR spectra of rTAO in both H2O and D2O media predicts a minimum of 30% α-helix content in the rTAO secondary structure and up to 64% if rTAO can adopt a coiled-coil arrangement (see supplemental Table S1) (28, 29), as would occur if rTAO is folded to form the predicted four-helix bundle.
Reduced Minus Oxidized FTIR Difference Spectra
IR redox difference spectra of TAO obtained by electrochemistry at pH/pD 7.0 are shown in Fig. 1. The data were recorded in both H2O (black) and D2O (red) media to aid assignments. As with most redox proteins, the largest IR bands are found in the amide I (peak/trough at 1658/1641 cm−1) and amide II (peak/trough at 1544/1554 cm−1) regions and most commonly arise from changes in the amide I (predominantly C=O) and amide II (predominantly N–H) bands of the polypeptide backbone amide linkages. The assignment of the 1658/1641 cm−1 bands to redox-dependent amide I changes is strengthened by their very weak sensitivity to H/D exchange. In contrast, amide II bands are strongly shifted (≈−100 cm−1) by H/D exchange, which is not the case for the 1554/1544 cm−1 bands. An estimation of the extent of H/D exchange from absolute IR absorption spectrum of rTAO recorded in D2O versus H2O (30) indicated that it was more than 95%. Hence, it is unlikely that the lack of shift was caused by poor H/D exchange, and other possible origins of the trough/peak at 1554/1544 cm−1 are discussed below.
FIGURE 1.

Reduced minus oxidized IR difference spectrum of rTAO. Reduction oxidation transformations were induced electrochemically in 100 mm potassium phosphate, 100 mm KCl at pH (black trace)/pD (red trace) 7.0 and containing 500 μm potassium ferricyanide and 100 μm benzyl viologen as redox mediators. Working electrode potentials were −400 mV for reduction and +550 mV for oxidation. For further details, see “Experimental Procedures.” Published ubiquinol-10 minus ubiquinone-10 redox spectra recorded in both H2O (black) and D2O (red) media are also displayed for qualitative comparisons (37).
An informative feature in the redox spectra is the positive peak at 1723 cm−1 in H2O that is downshifted to 1712 cm−1 on H/D exchange. Bands in this frequency range with such H/D shifts are generally characteristic of protonated carboxyl groups (31, 32). There is no associated trough of equal magnitude in this region, ruling out the possibility that the carboxyl group(s) is also protonated in the oxidized state. However, a trough of roughly equal intensity was observed at 1402 cm−1, slightly up-shifted (+2 cm−1) on H/D exchange, together with a broad trough that underlies sharper bands in the 1560–1500 cm−1 amide II region. Taken together, these bands suggest the loss on reduction of the νs and νas vibrational modes of a deprotonated carboxylate group at 1402 and ∼1530 cm−1 that is linked with the appearance of the 1723 cm−1 C=O peak of its protonated form. Hence, we conclude that reduction of rTAO results in the net protonation of one or more carboxylate groups. Deconvolution of both the H2O and D2O spectra with multiple Gaussian functions in the 1750-1700 cm−1 region (see supplemental Fig. S2) suggests that more than one carboxyl group may contribute. The best fit was obtained with two carboxyl groups being protonated (peaks at 1725 and 1717 cm−1 in H2O, 1715 and 1709 cm−1 in D2O) and one protonated carboxyl group changing conformation/environment on reduction (trough/peak at 1749/1735 cm−1 in H2O, shifted by −8 cm−1 and more evident in the D2O spectrum).
Other features around 1100 cm−1 are likely to arise from histidine changes (31, 33). In particular, the intense peak at 1092 cm−1, upshifted to 1099 cm−1 in D2O, is consistent with perturbation of an Nτ-protonated histidine bound by its Nπ to a metal center (34), as is found in the active sites of other homologous diiron proteins (35).
Finally, because reduced ubiquinone-9 is known to be the TAO electron donor in the bloodstream form of the trypanosome (36), we compared the rTAO redox spectra with published ubiquinone redox spectra recorded in both H2O and D2O media (37). Several bands are evident that correspond to those seen in the reference ubiquinone spectra (Fig. 1), particularly the bands at 1263 and 1289 cm−1 (arising from methoxy/quinone ring modes) and at 1612 cm−1 (from quinone C=C bonds) (38).
Redox Titration
The presence of an FTIR redox signature in rTAO provided a means to determine the redox properties of its active site by controlled potentiometry in a combined electrochemical/ATR-FTIR device (24). Redox mediators were chosen to cover the potential range from +200 to −100 mV (see “Experimental Procedures”). Fig. 2A presents the spectra recorded during the first reductive titration of a freshly prepared protein layer in 100 mm potassium phosphate, 100 mm KCl, at pH 7.0. The extent of reduction was estimated from the magnitudes of the two peak/troughs at 1658/1641 and 1544/1554 cm−1 and, typically, 15–20 min were required between two potential steps to allow their stabilization. The extent of reduction is plotted against ambient potential in Fig. 2B. It displayed the Nernstian behavior expected for an n = 2 reduction with a midpoint potential of +80 mV at pH 7.0 (see overlays in Fig. 2B). However, attempts to reverse the titration without hysteresis in the oxidative direction were unsuccessful, and no reoxidation was observable until potentials above +500 mV were applied (see below). Hence, it is not possible to conclude that the behavior seen in the reductive direction represents the equilibrium thermodynamic properties of this redox transition. Introduction of oxygen into the sample when this component had become reduced also failed to promote reoxidation, indicating that this reduced state is not the oxygen-reactive species.
Further investigations revealed that there was a second redox component that was becoming reduced much more slowly than the redox component represented by the two peak/troughs at 1658/1641 and 1544/1554 cm−1 and termed “signal 1.” This could be detected most clearly after reduction of a fully oxidized sample for 20 min at −10 mV, at which time signal 1 was fully developed and the second component remained mostly oxidized (Fig. 3A, signal 1). Maintenance of the ambient potential at −10 mV led to the appearance of a second distinct redox IR spectrum that we have termed “signal 2.” Its reduction was slow (1 h at −10 mV) but, in contrast to signal 1, could be reoxidized slowly by moderate oxidizing potentials (1 h at +200 mV). A full titration of this second redox couple could not be achieved because of overlap with signal 1 and its very slow rate of redox equilibration. Nevertheless, by prereduction of both signals 1 and 2, followed by reoxidation of signal 2, a reduced minus oxidized spectrum of signal 2 alone could be obtained (Fig. 3A, signal 2), and an approximate midpoint potential around +50 mV could be estimated. Signals 1 and 2 are quite distinct components. For example, there is no signature of protonated carboxyl group at 1723 cm−1 or evidence of bands at 1544/1554 cm−1 in signal 2. These spectra are not shown below 1200 cm−1 because the redox mediators used also absorb in this region, and no corrections for their contributions were made.
FIGURE 3.

Separation of redox spectra and oxidative titration of signal 1. A, a fully oxidized spectrum was recorded and use as a background. Potential was set to −10 mV, and signal 1 was recorded after 20 min. A new background spectrum was then recorded, and signal 2 was observed to develop at 1 h. B, oxidative titration of signal 1 at pH 7.0 with a mixture of redox mediators containing ferricyanide. Data were simulated with a Nernst-derived equation (see “Experimental Procedures”) for an n = 2 component with E1/2 = 520 mV (solid line) or for an unrestricted fit which gave n = 0.6 and E1/2 = 510 ± 30 mV (dotted line). The maximum intensity of signal 1 was determined by the addition of dioxygen to the fully reduced state.
After full reduction of both signals 1 and 2, the fully oxidized starting state of rTAO could be regenerated within the time scale of recording by introduction of O2 into the electrochemistry cell. This contrasts markedly with the oxygen-insensitive behavior observed when only signal 1 was reduced. After reoxidation with molecular oxygen when signals 1 and 2 were reduced, signals 1 and 2 could then be titrated as before. These observations show that both redox components must be reduced to produce a form that can react with oxygen to regenerate the fully oxidized state.
In an attempt to titrate signal 1 oxidatively, redox titrations were performed with a mixture of mediators containing ferricyanide to allow equilibration at higher potentials (see “Experimental Procedures”). After full reduction of signals 1 and 2 (approximately 1.5 h at −10 mV) and oxidation of signal 2 only (approximately 1 h at +200 mV), potentials were stepped to higher values (see Fig. 3B). After 2.5 h with potentials as high as +550 mV, only a fraction (≈25%) of signal 1 was oxidized. We verified this was not due to protein instability by reduction back to the fully reduced form of rTAO and reintroduction of O2, thereby regenerating 100% of the fully oxidized state. These observations suggest that potentials in excess of +550 mV are required for full signal 1 reoxidation, which is beyond the limit of accessible electrochemistry with the platinum grid/ferricyanide system. This behavior explains the low signal amplitudes of the rTAO data of Fig. 1 because the data are an average of cyclical reductions and oxidations without introduction of oxygen to regenerate the oxidized state fully and without a very long time at reducing potentials to reduce signal 2 fully. The cycle of reduction of signal 1 and signal 2 followed by injection of O2 into the electrochemistry cell to restore the fully oxidized resting state could be repeated reproducibly over many cycles, indicating that the enzyme itself remained very stable during the course of these investigations.
By comparison of band intensities at 1263 and 1612 cm−1 of a full redox spectrum of an optimized protein layer with those of a standardized solution of ubiquinone-10 in chloroform (see supplemental Fig. S3), a ubiquinone concentration in the layer was estimated to be approximately 4 mm. Previously, it has been shown that a layer of bovine cytochrome c oxidase (molecular mass, 204,000 Da; amide II band, approximately 0.25 ΔA) is maximally 1.8 mm (based on perfect packing) (39). Hence, the rTAO concentration (molecular mass, 34,000 Da; amide II band, 0.22 ΔA) could be up to 9 mm. As a result, it is concluded that the rTAO has retained ubiquinone such that its Q site is partially occupied with substrate ubiquinone.
Relevance to Catalytic Cycle
This study has revealed two redox processes that have distinct IR signatures, signal 1 and signal 2. Signal 1 could be titrated in the reductive direction where it behaved as if it were an n = 2 process with a midpoint potential of +80 mV at pH 7.0. However, the reaction was not reversible over the same potential range, indicating that this does not represent its equilibrium thermodynamic properties, a conclusion confirmed by the observation that even partial reoxidation of signal 1 could be achieved only with potentials of +550 mV. Such behavior can be observed in n = 2 redox systems when the one-electron intermediate is highly unstable, such as is seen, for example, in cyclic voltammetric behavior of quinones (40). In this case, reduction is controlled by the low potential reduction of quinone to semiquinone, whereas quinol oxidation is controlled by the high potential step of quinol oxidation to semiquinone. Hence, both oxidative and reductive waves appear only at overpotentials compared with the equilibrium n = 2 potential. It is possible that the behavior of signal 1 arises from a similar phenomenon in which it is an n = 2 reaction, but with a highly unstable one-electron form. In this case, the true thermodynamic n = 2 midpoint potential will lie somewhere between the observable reductive and oxidative waves. It is also possible that reduction of signal 1 by mediators is indirect, being mediated by the ubiquinone that is bound to the protein and that it is the known redox hysteresis of the ubiquinone that gives rise to the signal 1 behavior. A further possibility is that reduction of signal 1 induces a conformational change of the protein, raising the signal 1 potential to much higher values, a type of behavior that has been proposed to explain hysteresis of cytochrome cd1 redox titrations (41).
Signal 2 behaves more conventionally in that it appears to be reversibly oxidized and reduced over the same potential range, with a midpoint potential around +50 mV. However, its equilibration was far too slow to be able to perform an accurate redox titration to determine whether it had an n value of 1 or 2. These slow kinetics are not limited by diffusion of mediators between electrode and protein layer. They most likely arise because of slow equilibration between mediators and the redox group(s) involved.
In Fig. 4, a working model is proposed of the relationship between these IR-observed species and the physiological reaction cycle of the 4-electron reduction of dioxygen to water. Starting from the fully oxidized resting state of TAO (O), a 2-electron reduction occurs, represented by signal 1. This produces a species (I) that is insensitive to the presence of dioxygen. The (I) minus (O) IR difference spectrum shows clearly the net protonation of at least one carboxylate residue, and this is likely to give the transition a pH-dependent midpoint potential. In addition, the complexity of the carboxylic acid region changes, indicative of an additional underlying carboxylic acid shift, together with perturbations in the 1100 cm−1 region that indicate histidine alterations, are consistent with the proposed involvement of glutamic and histidine residues in the active site (1, 2, 13).
FIGURE 4.

Summary of experimental observations and their relation to the catalytic cycle of reduction of oxygen to water.
Species (I) can be further reduced, most probably with two electrons, to give a third redox state (R) that is the oxygen-reactive form. (R) must presumably correspond to the diferrous state that gives rise to the spin-coupled FeIIFeII EPR signal at g ≥ 15 that was observed in dithionite-reduced samples by Berthold et al. (20) and Moore et al. (22). The need to reduce TAO fully to react with oxygen to form the (O) state might be related to the observation of Berthold et al. that an FeIIFeIII mixed-valence state could only be observed by oxidation of the fully reduced state with oxygen (42). However, because of the differences in protocol details, it is not possible at present to determine whether the mixed-valence form should correspond to (O) or (I).
(R) can react rapidly with dioxygen to regenerate the fully oxidized (O) state. Because 4 electrons are required for reduction of dioxygen to water, the oxidation state of (O) will depend on whether the electrons are provided solely by the two metals, by protein residue(s) that produce radicals, or by substrate ubiquinol. Hence, if the (O) state does indeed result in formation of water, it must be (i) a diferryl center (FeIVFeIV); (ii) a diferric center plus two radicals (FeIIIFeIIIR•R•); (iii) a mixed-valence ferryl/ferric center plus a radical (FeIVFeIIIR•) (3). All of these species are potentially EPR-silent. Such radicals could arise from amino acids or, possibly, substrate ubiquinol. Reduction of (O) to (I) most likely involves addition of two reducing equivalents into the (O) state that reduce the metals and/or radicals. Finally, it also remains possible that oxygen is incompletely reduced in the (O) state, which could, for example, contain a bound peroxide that becomes reduced in the (O) to (I) transition. Such a species could well explain the irreversibility of the reduction. However, it is difficult to reconcile a peroxide species with the formation of a mixed-valence form, and so this possibility presently seems unlikely.
In the R2 subunit of the ribonucleotide reductase, a well characterized diiron carboxylate protein, a tyrosyl residue is involved in catalysis. The fact that this residue is buried deeply into the protein structure provides it with a peculiar stability (up to several days) (43). Mutagenesis studies of both the plant AOX (44) and TAO (15) have revealed that tyrosine 275 is crucial for catalysis. This tyrosine or, possibly, a nearby tryptophan 206 (Sauromatum guttatum numbering) might provide a radical site (44, 45); hence a role for radical(s) in the TAO catalytic cycle seems likely. The sharp H/D-insensitive negative band at 1554 cm−1 could arise from the loss of a radical in the (O) to (I) transformation. Radicals of ubiquinone are expected to have a sharp band around 1490 cm−1. IR and Raman features of neutral phenoxyl radical models and tyrosine radicals in proteins show two prominent modes of the neutral phenolic radical identified as ν8a(C–C) at 1550–1610 cm−1 and ν7a(C–O) at 1480–1530 cm−1, and the radical state of TyrD in photosystem II shows two bands at 1551 and 1503 cm−1 (46–48). Moreover, density functional theory simulations (see “Experimental Procedures”) of a neutral tyrosyl radical in both free zwitterionic tyrosine and in a model peptide also predict a strong band at 1554 cm−1. In contrast, the rather limited IR data on tryptophanyl radicals indicate that they have IR bands at higher frequencies (49). Hence, if the 1554 cm−1 band does indeed arise from a radical, a tyrosyl species in the (O) state is currently most favored. Ground-state tyrosine in its protonated form is known to have bands at 1508 cm−1 and, in the tyrosinate form, at 1547 cm−1. These bands also appear in density functional theory simulations, with an assignment to a normal mode arising from ν(C–O) + νs(C–Cring) + δIP(H–Cring). Hence, if the 1544/1554 cm−1 peak/trough in signal 1 does arise from tyrosine, then it most closely resembles the loss of a neutral tyrosyl radical in (O) and formation of a tyrosinate in (I) and (R). In any case, such a stable tyrosyl radical would have to be in an unusual environment in TAO, and stabilization of the tyrosinate state in (I) should make the formation of a radical energetically more facile. Further IR work on TAO and related diiron proteins, in particular a combination of FTIR and EPR analyses of the same redox states, should resolve both the nature of the mixed valence form and the involvement and types of any radicals.
Supplementary Material

The on-line version of this article (available at http://www.jbc.org) contains supplemental Figs. S1–S3 and Table S1.
- AOX
- alternative oxidase
- ATR
- attenuated total reflection
- δIP
- in plane bending
- FTIR
- Fourier transform infrared
- TAO
- trypanosomal alternative oxidase
- rTAO
- recombinant TAO expressed in a heme-deficient strain of E. coli
- νs and νas
- symmetric and asymmetric stretching, respectively.
REFERENCES
- 1.Finnegan P. M., Soole K. L., Umbach A. L. (2004) Plant Mitochondria: From Genome To Function, p. 163, Kluwer Academic Publishers, Dordrecht, The Netherlands [Google Scholar]
- 2.Berthold D. A., Stenmark P. (2003) Annu. Rev. Plant. Biol. 54, 497–517 [DOI] [PubMed] [Google Scholar]
- 3.Affourtit C., Albury M. S., Crichton P. G., Moore A. L. (2002) FEBS Lett. 510, 121–126 [DOI] [PubMed] [Google Scholar]
- 4.Moore A. L., Albury M. S., Crichton P. G., Affourtit C. (2002) Trends Plant Sci. 7, 478–481 [DOI] [PubMed] [Google Scholar]
- 5.McDonald A. E., Vanlerberghe G. C. (2006) Comp. Biochem. Physiol. D 1, 357–364 [DOI] [PubMed] [Google Scholar]
- 6.McDonald A., Vanlerberghe G. (2004) IUBMB Life 56, 333–341 [DOI] [PubMed] [Google Scholar]
- 7.Chaudhuri M., Ott R. D., Hill G. C. (2006) Trends Parasitol. 22, 484–491 [DOI] [PubMed] [Google Scholar]
- 8.Roberts C. W., Roberts F., Henriquez F. L., Akiyoshi D., Samuel B. U., Richards T. A., Milhous W., Kyle D., McIntosh L., Hill G. C., Chaudhuri M., Tzipori S., McLeod R. (2004) Int. J. Parasitol. 34, 297–308 [DOI] [PubMed] [Google Scholar]
- 9.Suzuki T., Hashimoto T., Yabu Y., Kido Y., Sakamoto K., Nihei C., Hato M., Suzuki S., Amano Y., Nagai K., Hosokawa T., Minagawa N., Ohta N., Kita K. (2004) Biochem. Biophys. Res. Commun. 313, 1044–1052 [DOI] [PubMed] [Google Scholar]
- 10.Nihei C., Fukai Y., Kita K. (2002) Biochim. Biophys. Acta 1587, 234–239 [DOI] [PubMed] [Google Scholar]
- 11.Minagawa N., Yabu Y., Kita K., Nagai K., Ohta N., Meguro K., Sakajo S., Yoshimoto A. (1997) Mol. Biochem. Parasitol. 84, 271–280 [DOI] [PubMed] [Google Scholar]
- 12.Yabu Y., Yoshida A., Suzuki T., Nihei C., Kawai K., Minagawa N., Hosokawa T., Nagai K., Kita K., Ohta N. (2003) Parasitol. Int. 52, 155–164 [DOI] [PubMed] [Google Scholar]
- 13.Andersson M. E., Nordlund P. (1999) FEBS Lett. 449, 17–22 [DOI] [PubMed] [Google Scholar]
- 14.Berthold D. A., Andersson M. E., Nordlund P. (2000) Biochim. Biophys. Acta 1460, 241–254 [DOI] [PubMed] [Google Scholar]
- 15.Nakamura K., Sakamoto K., Kido Y., Fujimoto Y., Suzuki T., Suzuki M., Yabu Y., Ohta N., Tsuda A., Onuma M., Kita K. (2005) Biochem. Biophys. Res. Commun. 334, 593–600 [DOI] [PubMed] [Google Scholar]
- 16.Minagawa N., Sakajo S., Komiyama T., Yoshimoto A. (1990) FEBS Lett. 267, 114–116 [DOI] [PubMed] [Google Scholar]
- 17.Ajayi W. U., Chaudhuri M., Hill G. C. (2002) J. Biol. Chem. 277, 8187–8193 [DOI] [PubMed] [Google Scholar]
- 18.Rich P. R. (1978) FEBS Lett. 96, 252–256 [Google Scholar]
- 19.Berthold D. A., Siedow J. N. (1993) Plant Physiol. 101, 113–119 [DOI] [PMC free article] [PubMed] [Google Scholar]
- 20.Berthold D. A., Voevodskaya N., Stenmark P., Gräslund A., Nordlund P. (2002) J. Biol. Chem. 277, 43608–43614 [DOI] [PubMed] [Google Scholar]
- 21.Affourtit C., Moore A. L. (2004) Biochim. Biophys. Acta 1608, 181–189 [DOI] [PubMed] [Google Scholar]
- 22.Moore A. L., Carré J. E., Affourtit C., Albury M. S., Crichton P. G., Kita K., Heathcote P. (2008) Biochim. Biophys. Acta 1777, 327–330 [DOI] [PubMed] [Google Scholar]
- 23.Nihei C., Fukai Y., Kawai K., Osanai A., Yabu Y., Suzuki T., Ohta N., Minagawa N., Nagai K., Kita K. (2003) FEBS Lett. 538, 35–40 [DOI] [PubMed] [Google Scholar]
- 24.Rich P. R., Iwaki M. (2007) Mol. BioSys. 3, 398–407 [DOI] [PubMed] [Google Scholar]
- 25.Frisch M. J., Trucks G. W., Schlegel H. B., Scuseria G. E., Robb M. A., Cheeseman J. R., Montgomery J. A., Jr., Vreven T., Kudin K. N., Burant J. C., Millam J. M., Iyengar I. I., Tomasi J., Barone V., Mennucci B., Cossi M., Scalmani G., Rega N., Petersson G. A., Nakasuji H., Hada M., Ehara M., Toyota K., Fukuda R., Hasegawa J., Ishida M., Nakajima T., Honda Y., Kitao O., Nakai H., Klene M., Li X., Knox J. E., Hratchian H. P., Cross J. B., Bakken V., Adamo C., Jaramillo J., Gomperts R., Stratmann R. E., Yazyev O., Austin A. J., Cammi R., Pomelli C., Ochterski J. W., Ayala P. Y., Morokuma K., Voth G. A., Salvador P., Dannenberg J. J., Zakrzewski G., Dapprich S., Daniels A. D., Strain M. C., Farkas O., Malick D. K., Rabuck A. D., Raghavachari K., Foresman J. B., Ortiz J. V., Cui Q., Baboul A. G., Clifford S., Cioslowski J., Stefanov B. B., Liu G., Liashenko A., Piskorz P., Komaromi I., Martin R. L., Fox D. J., Keith T., Al-Laham M. A., Peng C. Y., Nanayakkara A., Challacombe M., Gill P. M. W., Johnson B., Chen W., Wong M. W., Gonzalez C., Pople J. A. (2005) Gaussian 03, Gaussian, Inc., Wallingford, CT [Google Scholar]
- 26.Arrondo J. L. R., Muga A., Castresana J., Goñi F. M. (1993) Prog. Biophys. Mol. Biol. 59, 23–56 [DOI] [PubMed] [Google Scholar]
- 27.Arrondo J. L. R., Goñi F. M. (1999) Prog. Biophys. Mol. Biol. 72, 367–405 [DOI] [PubMed] [Google Scholar]
- 28.Heimburg T., Schuenemann J., Weber K., Geisler N. (1996) Biochemistry 35, 1375–1382 [DOI] [PubMed] [Google Scholar]
- 29.Reisdorf W. C., Jr., Krimm S. (1996) Biochemistry 35, 1383–1386 [DOI] [PubMed] [Google Scholar]
- 30.Glasoe P. K., Long F. A. (1960) J. Phys. Chem. 64, 188–190 [Google Scholar]
- 31.Barth A. (2000) Prog. Biophys Mol. Biol. 74, 141–173 [DOI] [PubMed] [Google Scholar]
- 32.Rich P. R., Iwaki M. (2005) Biophysical and Structural Aspects of Bioenergetics, p. 314, The Royal Society of Chemistry, Cambridge, UK [Google Scholar]
- 33.Iwaki M., Yakovlev G., Hirst J., Osyczka A., Dutton P. L., Marshall D., Rich P. R. (2005) Biochemistry 44, 4230–4237 [DOI] [PubMed] [Google Scholar]
- 34.Noguchi T., Inoue Y., Tang X.-S. (1999) Biochemistry 38, 10187–10195 [DOI] [PubMed] [Google Scholar]
- 35.Solomon E. I., Brunold T. C., Davis M. I., Kemsley J. N., Lee S.-K., Lehnert N., Neese F., Skulan A. J., Yang Y.-S., Zhou J. (2000) Chem. Rev. 100, 235–350 [DOI] [PubMed] [Google Scholar]
- 36.Clarkson A. B., Jr., Bienen E. J., Pollakis G., Grady R. W. (1989) J. Biol. Chem. 264, 17770–17776 [PubMed] [Google Scholar]
- 37.Iwaki M., Giotta L., Akinsiku A. O., Schägger H., Fisher N., Breton J., Rich P. R. (2003) Biochemistry 42, 11109–11119 [DOI] [PubMed] [Google Scholar]
- 38.Breton J., Nabedryk E. (1996) Biochim. Biophys. Acta 1275, 84–90 [Google Scholar]
- 39.Iwaki M., Rich P. R. (2004) J. Am. Chem. Soc. 126, 2386–2389 [DOI] [PubMed] [Google Scholar]
- 40.Rich P. R. (2004) Biochim. Biophys. Acta 1658, 165–171 [DOI] [PubMed] [Google Scholar]
- 41.Koppenhöfer A., Turner K. L., Allen J. W. A., Chapman S. K., Ferguson S. J. (2000) Biochemistry 39, 4243–4249 [DOI] [PubMed] [Google Scholar]
- 42.Voevodskaya N., Narvaez A.-J., Domkin V., Torrents E., Thelander L., Gräslund A. (2006) Proc. Natl. Acad. Sci. U.S.A. 103, 9850–9854 [DOI] [PMC free article] [PubMed] [Google Scholar]
- 43.Atkin C. L., Thelander L., Reichard P., Lang G. (1973) J. Biol. Chem. 248, 7464–7472 [PubMed] [Google Scholar]
- 44.Albury M. S., Affourtit C., Crichton P. G., Moore A. L. (2002) J. Biol. Chem. 277, 1190–1194 [DOI] [PubMed] [Google Scholar]
- 45.Moore A. L., Albury M. S. (2008) Biochem. Soc. Trans. 36, 1022–1026 [DOI] [PubMed] [Google Scholar]
- 46.Berthomieu C., Hienerwadel R. (2005) Biochim. Biophys. Acta 1707, 51–66 [DOI] [PubMed] [Google Scholar]
- 47.Berthomieu C., Boullais C., Neumann J.-M., Boussac A. (1998) Biochim. Biophys. Acta 1365, 112–116 [DOI] [PubMed] [Google Scholar]
- 48.Berthomieu C., Hienerwadel R., Boussac A., Breton J., Diner B. A. (1998) Biochemistry 37, 10547–10554 [DOI] [PubMed] [Google Scholar]
- 49.Walden S. E., Wheeler R. A. (1996) J. Chem. Soc. Perkin Trans. 2, 2663–2672 [Google Scholar]
Associated Data
This section collects any data citations, data availability statements, or supplementary materials included in this article.