

Abstract
Primary afferent axons within the solitary tract (ST) relay homeostatic information via glutamatergic synapses directly to second-order neurons within the nucleus of the solitary tract (NTS). These primary afferents arise from multiple organ systems and relay multiple sensory modalities. How this compact network organizes the flow of primary afferent information will shape central homeostatic control. To assess afferent convergence and divergence, we recorded ST-evoked synaptic responses in pairs of medial NTS neurons in horizontal brainstem slices. ST shocks activated EPSCs along monosynaptic or polysynaptic pathways. Gradations in shock intensity discriminated multiple inputs and stimulus recruitment profiles indicated that each EPSC was unitary. In 24 pairs, 75% were second-order neurons with 64% receiving one direct ST input with the remainder receiving additional convergent ST afferent inputs (22% two; 14% three monosynaptic ST-EPSCs). Some (34%) second-order neurons received polysynaptic EPSCs. Neurons receiving only higher-order inputs were uncommon (13%). Most ST-EPSCs were completely independent, but 4 EPSCs of a total of 81 had equal thresholds, highly correlated latencies, and synchronized synaptic failures consistent with divergence from a single source ST axon or from a common interneuron producing a pair of polysynaptic EPSCs. We conclude that ST afferent inputs are remarkably independent with little evidence of substantial shared information. Individual cells receive highly focused information from the viscera. Thus, afferent excitation of second-order NTS neurons is generally dominated by single visceral afferents and therefore focused on a single afferent modality and/or organ region.
Introduction
The integrated control of visceral organs supports homeostasis and depends upon coordination within autonomic networks concentrated in the brainstem (Loewy, 1990; Saper, 2002; Travagli et al., 2006). Information from the viscera arrives directly in the CNS via the vagus and glossopharyngeal nerves bundled within the solitary tract (ST). These cranial primary afferents synapse onto neurons within the nucleus of the solitary tract (NTS) and neuroanatomical evidence suggests a loose but overlapping viscerotopic distribution of these cranial afferents within the NTS (Loewy, 1990; Altschuler et al., 1991; Kubin et al., 2006). Single cranial visceral afferent axons branch within NTS with varicosities suggesting terminals in the vicinity of multiple neurons (Donoghue et al., 1982a,b; Davies and Kubin, 1986; Kubin et al., 2006). This proximity of multiple afferent branches and terminals also suggests possible convergence of afferents onto single NTS neurons. Activation of different peripheral nerve trunks (e.g., vagus and carotid sinus nerve) evoke responses in vivo consistent with individual NTS neurons receiving convergent inputs from multiple afferent sources (Bonham and Hasser, 1993; Mifflin, 1993, 1996). Thus, visceral information may converge onto single NTS neurons or may be shared across multiple neurons. Understanding the patterns of afferent organization and synaptic distribution to individual NTS neurons is a fundamental aspect that will shape reflex characteristics and integration within autonomic networks. Key questions include the number and routing of afferent inputs, their synaptic weighting, and the degree of convergence/divergence of ST-driven excitatory neurotransmission.
Assessments of afferent driven inputs to NTS neurons have generally relied upon single cell recordings. This approach cannot detect common or shared inputs across neurons. To better assess ST synaptic organization, we recorded from pairs of NTS neurons in horizontal brainstem slices in which afferent ST axons could be activated up to 3 mm from the recorded cells. We finely graded the intensity of remote ST stimulus shocks to progressively recruit synaptic inputs and then characterized each by their timing, amplitude, and synaptic failures. Stimulus recruitment profiles revealed the number, weight, and path of synaptic connections from ST axons to NTS neurons. Across pairs of neurons, stimulus recruitment profiles were also used to assess possible afferent divergence. The results depict medial NTS as overwhelming comprised of second-order neurons, of which, nearly half receive only a single monosynaptic ST input and the remainder received limited numbers of additional monosynaptic and/or polysynaptic convergent inputs. Paired recordings detected only two instances of ST-driven input divergence. Thus, second-order NTS neurons are highly segregated from their nearest neighbors within this compact region and likely dedicated to processing and distributing a highly focused message of peripheral organ status.
Materials and Methods
All animal procedures were performed with the approval of the Institutional Animal Care and Use Committee at Oregon Health & Science University and conformed to the guidelines of the National Institutes of Health publication Guide for the Care and Use of Laboratory Animals.
Brainstem slice preparation.
Brainstem slices were prepared from adult (>180 g, average weight 345 ± 24 g, n = 20) Sprague Dawley rats (Charles River Laboratories) as described previously (Doyle and Andresen, 2001). Briefly, rats were deeply anesthetized with isoflurane. The medulla was rapidly cooled and trimmed rostral and caudal to yield a brainstem block centered on obex. A rostral–caudal wedge of ventral brainstem was removed to orient the remaining tissue to yield a single 250-μm-thick horizontal slice which contained the greatest length of ST axons together with the medial NTS. Slices were cut with a sapphire knife (Delaware Diamond Knives) mounted in a vibrating microtome (VT1000S; Leica Microsystems). The external solution was an artificial CSF (ACSF) containing the following (in mm): 125 NaCl, 3 KCl, 1.2 KH2PO4, 1.2 MgSO4, 25 NaHCO3, 10 dextrose, and 2 CaCl2. Slices were secured with a nylon mesh in a perfusion chamber and perfused with ACSF at 34°C, 300 mOsm, bubbled with 95% O2–5% CO2.
Whole-cell recording.
Recording pipettes (2.8–4.2 MΩ) were guided to neurons in the medial subnucleus of caudal NTS by using anatomical landmarks. Neurons were visualized (Doyle et al., 2004) using infrared illumination with differential interference contrast optics (40× water-immersion lens) on an Axioskop-2 FS plus fixed-stage microscope (Zeiss) with digital camera (Hamamatsu Photonic Systems). Pipettes were filled with a low-Cl− intracellular solution containing the following (in mm): 6 NaCl, 4 NaOH, 130 K-gluconate, 11 EGTA, 1 CaCl2, 1 MgCl2, 10 HEPES, 2 Na2ATP, and 0.2 Na2GTP (pH 7.3 and 296 mOsm). As a consequence, the ECl value was −69 mV, and IPSCs had small amplitudes at VH = −60 mV. All recordings were made in open, whole-cell patch configuration under voltage-clamp using a Multiclamp 700B (Molecular Devices). Signals were filtered at 10 kHz and sampled at 30 kHz using p-Clamp software (version 9.2, Molecular Devices, MDS Analytical Technologies). Voltages were not corrected for the liquid junction potential (−13.9 mV).
ST shock intensity recruitment profiles.
The concentric bipolar stimulating electrode (200 μm outer diameter; Frederick Haer) was placed on the visible ST ∼1–3 mm rostral from recorded neuron cell bodies (Fig. 1). Passing current via the stimulating electrode activated ST primary afferents. The remote placement of the electrode minimized the likelihood that electrical shocks would activate non-ST axons or local neurons (Doyle and Andresen, 2001; Doyle et al., 2004; Bailey et al., 2008). Once stable recordings of each neuron were established a series of test shocks graded in intensity were delivered to the ST. Minimal-stimulus-intensity protocols with incremental recruitment can define discrete inputs to central neurons (Allen and Stevens, 1994; Rancz et al., 2007). Likewise, afferent shocks distant to the recorded cells produce discrete, unitary intensity-recruitment profiles for each input (Blitz and Regehr, 2005; Acuna-Goycolea et al., 2008). A Master-8 isolated programmable stimulator (A.M.P.I.) generated bursts of five ST shocks at 50 Hz every 3 s (shock duration, 0.1 ms) for a minimum of 10 consecutive sweeps for each shock intensity trial, and respective synaptic responses were designated EPSC1, EPSC2, etc. All neurons were tested with stimulus shock intensities from 0 to 800 μA. From 0 to 100 μA, step changes were 10 μA (minimum) and from 100 to 800 μA, step changes were 100 μA (minimum). The order of shock intensity presentation was varied. Once synaptic responses were detected, then a more finely graded series of shocks were delivered to better define the threshold stimulus intensity value for each synaptic input. Plots of the event amplitudes (discriminated by arrival time and waveform) against stimulus intensity created recruitment profiles to compare across events. The stimulus recruitment profile of each synaptic event is considered to reflect the all-or-none axon activation characteristics of the ST fiber initiating the recorded EPSC.
Figure 1.

The distribution of neurons recorded as pairs within the medial NTS in a horizontal slice of the caudal brainstem. A, For experiments, the concentric bipolar electrode (stim) was placed over rostral portions of the solitary tract (solid yellow lines). Two pipettes (Ch 0 and Ch 1) were independently advanced to record from cell bodies. B, C, Higher-magnification photographs of the pair of neurons in A using DIC optics and infrared imaging; we designated neurons recorded from Ch 0 as neuron “a” (B) and those recorded via Ch 1 as neuron “b” (C). D, On the basis of synaptic responses, neurons were classified as second order (hexagon), higher order (star), or not connected (cross). Both members of each NTS neuron pair are coded with like colors. The locations of the cell bodies for 21 pairs within the medial NTS are represented. Note that the locations of three pairs (3 second order, 2 higher order, and 1 not connected) are not plotted. Scale bars: A, D, 200 μm; B, C, 20 μm.
Discriminating monosynaptic from polysynaptic synaptic responses.
Synaptic latency jitter and failure rates were considered reliable indices that distinguish between direct contacts from ST afferents (monosynaptic) and indirect (polysynaptic) afferent pathways to NTS neurons. Analysis of latency was based on consideration of the responses to the first shock in the train of five (EPSC1). Variability in latency (jitter) for EPSC1 was calculated over 30–40 trials as the SD of latency and served as a critical index of synaptic order. EPSC1 jitters of <200 μs were considered monosynaptic and jitters of >200 μs indicated a polysynaptic connection from the ST (Doyle and Andresen, 2001; Bailey et al., 2006a). This criterion (synaptic jitter) matches second-order NTS neurons identified using anterogradely dye-labeled baroreceptive terminals (Andresen and Peters, 2008). Polysynaptic pathways activated by ST shocks are particularly prone to synaptic failures even with infrequent stimuli (Bailey et al., 2006a; Andresen and Peters, 2008). Suprathreshold ST shocks that failed to evoke an identifiable EPSC were counted as synaptic failures and failure rates were calculated for EPSC1 over 40 trials as a percentage of total ST shocks delivered at a constant, suprathreshold intensity. Neurons that received only polysynaptic inputs to ST shocks were classified as higher-order NTS neurons. Neurons that exhibited no ST-evoked synaptic responses to high-intensity shocks (up to 800 μA) were considered “not connected” to ST afferents and not analyzed further.
Identification of common (divergent) afferent inputs—cross-neuronal correlations.
Recorded neuron pairs were located in close proximity (0–150 μm), and one important aspect of our analysis was to test for the possibility that one ST afferent might contact two neurons. To detect common innervation, analysis began with the identification of synaptic inputs triggered at similar ST stimulus thresholds. We predicted that synaptic events arising from a common ST axon would be evoked in both neurons at identical shock intensities. Two forms of divergence might be predicted: a single ST afferent dividing to contact two neurons or a common excitatory interneuron whose axon divides to contact the two recorded NTS neurons. For all events triggered at similar thresholds, we compared the thresholds, timing, and failures of ST-evoked synaptic events. Similarly, we reasoned that failure of a given shock to trigger an action potential in a common afferent fiber would fail to evoke respective synaptic events in both recorded neurons. Thus, evidence of divergence of a single ST afferent contacting two neurons included both common thresholds and synchronous use-dependent synaptic failures. Failure rates normally increase from EPSC1 through to EPSC5, within each burst of shocks (Bailey et al., 2006a; Andresen and Peters, 2008). Coincidence of synaptic failures in both recorded neurons was calculated as a cofailure rate over 40 trials of the 5-shock burst (200 total test shocks).
Data and statistics analysis.
Synaptic inputs activated by the same ST afferent axons were expected to have highly correlated or “synchronous” synaptic successes and failures between pairs of neurons. Comparisons between suspected common inputs were tested against a random association using a χ2 analysis. Input variables including latency, jitter, amplitude, and failure rates for EPSC1 were not normally distributed and thus were compared between groups by rank values using a Kruskal-Wallis one-way ANOVA on ranks with Dunn's post hoc test (SigmaStat). All data are represented as mean ± SEM.
Results
Most medial NTS neurons receive direct ST-driven synaptic input
Pairs of neurons (n = 48 neurons; 24 pairs) located in the medial NTS (Fig. 1) were targeted for recordings and characterized based on their ST-driven EPSCs. For individual pairs of recordings, neuronal cell bodies were separated by up to ∼150 μm (average distance between recording electrodes was 51 ± 7 μm). Most neurons received at least one low-jitter ST afferent contact and were designated as second order (36 of 48 cells). Neurons receiving only high-jitter, polysynaptic input from the ST were designated “higher order” and represented a relatively small subgroup of NTS neurons (6 of 48 cells). Additionally, six neurons did not respond to even the highest-intensity ST shocks and were considered “not connected” (Fig. 1D). These unconnected neurons appeared otherwise healthy and exhibited spontaneous synaptic events. In all cases, unconnected neurons were recorded with a paired neuron that responded to ST shocks. The number of unconnected neurons was similar in proportion to previous studies and may, in part, represent neurons whose ST connections were damaged during slice preparation (Appleyard et al., 2007). For the remainder of this report, summary expressions will consider only those 42 neurons with ST-synced responses.
The exposed tip of the concentric bipolar stimulating electrode has a 200 μm diameter that covered most of the visible width of the ST in horizontal slices (Fig. 1A). All ST-evoked synaptic responses were triggered by shocks from a single ST location in each slice. The lowest shock intensities evoked no synaptic response (Fig. 2A,B; 30–50 μA). As current intensity was increased, each shock reliably activated a fixed latency EPSC in only one of these two neurons (Fig. 2A,B; 60 μA shocks, black traces, neuron “a,” input 1, neuron “b,” red traces, no inputs activated). Analysis of every event in each neuron generated a stimulus recruitment profile for the individual cell and represents a summary of their full range of synaptic responses. In this pair (Fig. 2), neuron “a” received a single monosynaptic input (left, black) and neuron “b” received a combination of two separate but converging monosynaptic inputs (Fig. 2; 90 μA shocks, neuron “b,” inputs 1 and 2). Note that the responses of all three inputs to the two neurons were evoked without failures by each single shock to ST at suprathreshold intensities. Each input was identified with a unique stimulus intensity threshold, amplitude, latency distribution, and all-or-none response (Fig. 2B). The activation of the second convergent input to neuron “b” produced a compound EPSC that obscured the presence of input 1 on account of its shorter latency (Fig. 2A,B). Interestingly, the EPSC waveform in neuron “b” at high intensity (90 μA) contained no discernible inflection that might indicate two discrete ST inputs. Thus, the two inputs to this neuron were revealed only through the graded shock recruitment protocol. No other ST-evoked event was identified at shock intensities >90 μA. These results indicate that these two neurons together received three ST-driven inputs and all were monosynaptic. Thus, neurons “a” and “b” (Fig. 2) were classified as second-order neurons.
Figure 2.
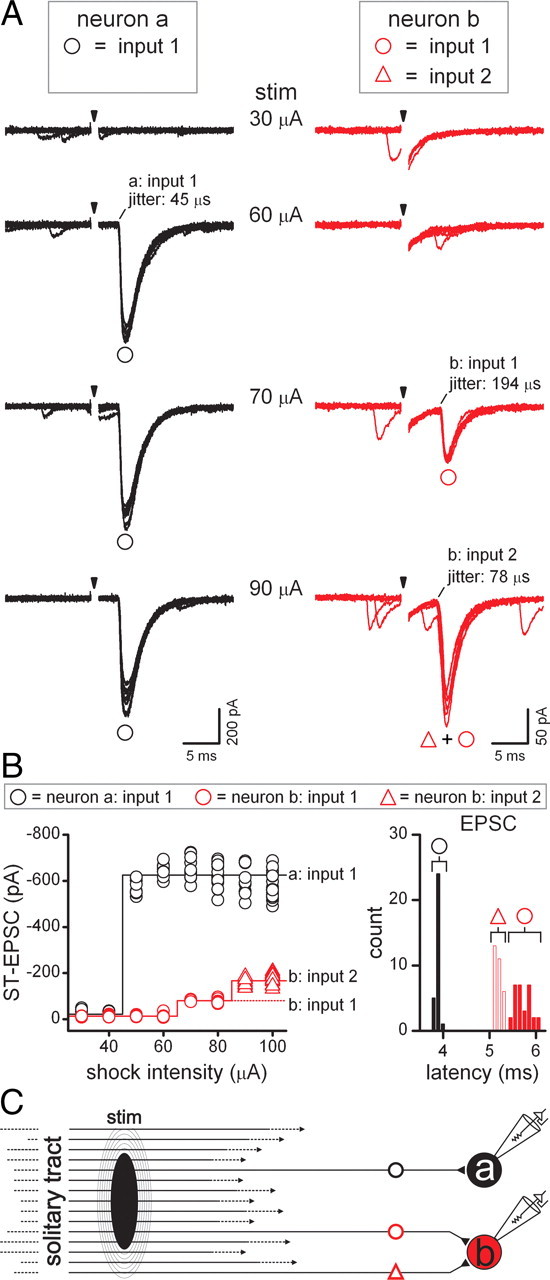
Shocks to the ST most often evoked low-jitter (<200 μs) EPSCs that indicated a monosynaptic pathway to second-order NTS neurons. A, Representative traces recorded simultaneously from a pair of neurons, “a” (black traces) and “b” (red traces). The panel displays eight trials overlaid (shock artifact blanked) at several ST shock intensities (arrows). Low intensities (30 μA) elicited no synaptic responses. Note the presence of spontaneous synaptic events. At 60 μA, shocks evoked low-jitter EPSCs in neuron “a,” designated input 1 (black circle). No ST-evoked EPSCs were elicited in neuron “b” at 60 μA. At 70 μA, shocks evoked EPSCs from input 1 (black circle) in neuron “a” but also activated low-jitter EPSCs in neuron “b” (input 1, red circle). Each 90 μA shock triggered both input 1 in neuron “a” as well as compound EPSCs (red triangle plus red circle) in neuron “b,” consisting of input 1 (red circle) and an additionally recruited input 2 (red triangle) that arrived earlier, exhibited lower jitter, and resulted in a greater amplitude EPSC than input 1 alone. Thus, stimulus recruitment protocols successively activated synaptic inputs to each neuron where each had unique threshold, latency, jitter, and amplitude characteristics. At suprathreshold intensities, synaptic failures were nonexistent. B, Each synaptic input could be identified from a plot of ST-EPSC amplitude plotted versus shock intensity (left panel): the stimulus recruitment profile. Note that the amplitude of input 1 in neuron “a” (black circle) was unaltered by increases in stimulus intensity: an all-or-none or “unitary” profile. In neuron “b,” the latency of input 2 (red triangle) was shorter than the lower threshold input 1 (red circle) as depicted in the histograms of event latencies (right). Latency jitter of <200 μs indicated a direct monosynaptic path between the stimulating electrode and neurons. C, Proposed wiring diagram for the pathways connecting ST afferents to these two neurons. The stimulating electrode (black ellipse) covers most of the ST fiber bundle. Increased shock intensities expand the stimulus (stim; concentric ellipses). With maximal activation, neuron “a” received only one ST-activated input, via a direct monosynaptic pathway (black circle). Neuron “b” (red) was contacted directly by two convergent ST axons (red circle and red triangle). To better appreciate the trial-by-trial dynamic nature of recruitment, as well as the intermittent presence of spontaneous EPSCs, see supplemental Figure 1, available at www.jneurosci.org as supplemental material, for a dynamic GIF of the stimulus recruitment protocol and interpretation of the results. The display includes ST-EPSCs recorded in each neuron recorded for each trial. The intensity meter shows the shock strength and the recruitment curve registers the peak amplitudes for the evoked events. The later panel overlays all trials and shows circuit diagrams for the response-based pathways.
Each of the three ST-EPSCs elicited in the two recorded neurons (neurons “a” and “b”) was activated at discrete shock intensity thresholds. The trial-to-trial variations characteristically were much greater in EPSC amplitudes than in event timing (see supplemental Fig. 1, dynamic GIF, available at www.jneurosci.org as supplemental material). Low-jitter ST-EPSCs were remarkably reliable and did not fail across trials at EPSC1. Together, these measures indicate activation of three independent ST axons whose responses are distinguished in their timing and amplitude characteristics (Fig. 2C). Once recruited, the EPSC amplitudes were unaltered by increasing the shock intensity (Fig. 2B) and the latency and jitter of the individual ST-evoked EPSCs were constant. This result conforms to the expected outcomes from the discrete recruitment of single axons directly connected to each neuron (Fig. 2C).
Convergent monosynaptic and polysynaptic ST-synced EPSCs have unitary characteristics in medial NTS
Shocks to ST often evoked synaptic events with inconsistent latencies and frequent failures. These characteristics are consistent with ST activation of polysynaptic pathways that were prone to interruptions in transmission along intervening neurons before reaching the recorded cells (Bailey et al., 2006a). In 22 (20 second, 2 higher order) of 42 medial NTS neurons, stimulus recruitment profiles revealed combinations of low- and/or high-jitter ST-EPSCs and typically each event had a different threshold (Fig. 3). Increasing shock intensity independently recruited a total of six different ST-synced EPSCs in the two neurons (Fig. 3A). The second-order neuron “a” (Fig. 3A, black traces) received two high-jitter inputs (polysynaptic) with relatively low and high thresholds each and a low-jitter EPSC recruited at middle intensity thresholds (Fig. 3B). Thus, neuron “a” of this pair received a primary afferent input and two additional convergent, polysynaptic EPSCs. Neuron “b” received three unique ST-EPSCs, but all were low jitter (Fig. 3A,B). Neuron “b” possessed the largest number of monosynaptic inputs to a single neuron found across 24 pairs among 81 unique, ST-synced synaptic events. In the case of neuron “b” (Fig. 3A, red traces), the closely matched latencies of inputs 1 and 2 fused into a compound EPSC, but input 3 arrived later and produced a distinct inflection rising from the late initial plateau of the three-event compound waveform (50–100 μA) (Fig. 3A). This example demonstrates that threshold stimulus intensity was not predictive of pathway complexity or latency (second vs higher order). As with monosynaptic EPSCs, ST-driven polysynaptic inputs had singular distinct threshold shock intensities that were all-or-none and triggered consistent waveforms (i.e., amplitude and decay kinetics) across trials. Polysynaptic events varied in both their timing and waveform shape indicative of the more convoluted processing in the individual pathways. Polysynaptic EPSCs also summed in compound waveforms and their influence characteristically varied in time and magnitude. At the extreme, failures in individual polysynaptic pathways resulted in component EPSCs dropping out of the compound waveform, an effect most evident in varied failures from trial to trial (see supplemental Fig. 2, dynamic GIF, available at www.jneurosci.org as supplemental material). These results within and between cells are consistent with a synchronous activation of multiple ST axons during a single shock to the ST and an organization model in which only a limited number of these afferent pathways directly and indirectly synapse on each neuron (Fig. 3C).
Figure 3.
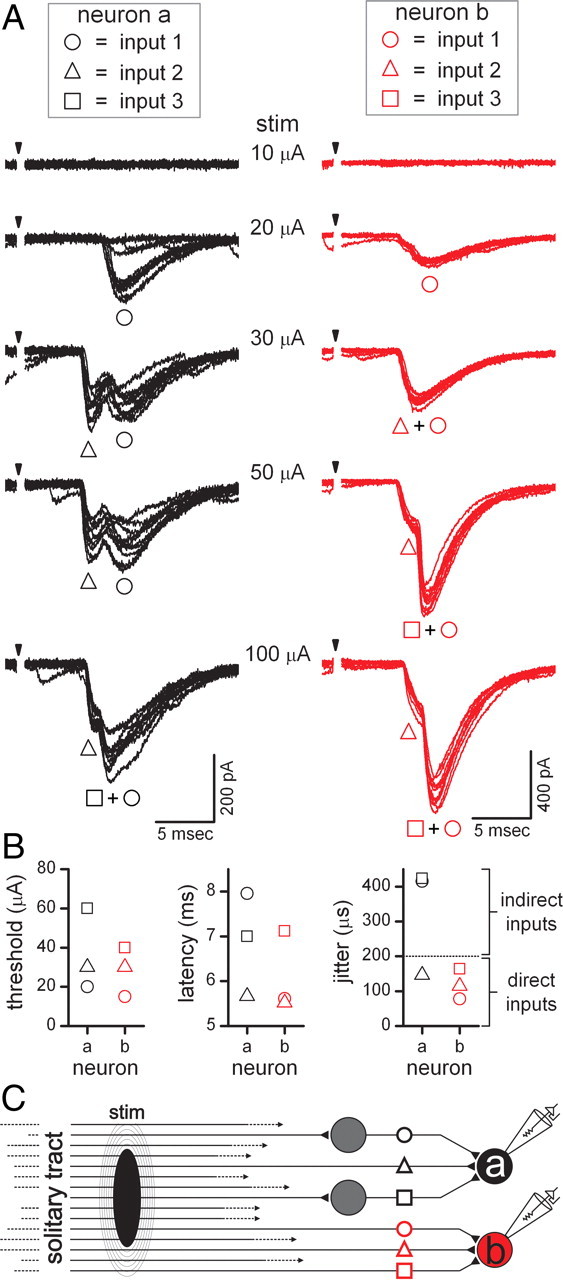
Second-order NTS neurons also received convergent solitary tract (ST) afferent input that arrived via polysynaptic pathways. A, In simultaneous recordings from two medial NTS neurons, neither neuron “a” (black traces) or “b” (red traces) responded to shocks (arrows) at 10 μA (8 trials overlaid, shock artifact blanked). At 20 μA, shocks evoked EPSCs in both neurons (black and red circles), but input 1 (black circle) in neuron “a” failed intermittently. At 30 μA shocks recruited a second set of inputs to each neuron (black and red triangles) with unique latencies, jitter, and waveform characteristics. In the case of input 1 (black circle) to neuron “a,” the time to peak and amplitude was little affected by recruitment of the earlier arriving input 2 (black triangle). Increments in ST stimulus intensity to 50 and 100 μA added a third set of inputs to each neuron (red and black squares, respectively). Thus, single shocks at high intensity activated a total of six ST afferents, each with a unique threshold, that either directly contacted the recorded neuron or activated intermediary neurons within polysynaptic pathways. B, Direct comparisons within and across the two neurons show that threshold shock intensity as well as latency and jitter were distinct across each individual input to each neuron, with the exception of input 2 to each cell. Latency jitter values of >200 μs (right) indicated polysynaptic connecting pathways from the ST. C, A wiring diagram illustrating the connecting pathways: neuron “a” was second order and received one monosynaptic (black triangle) and two polysynaptic inputs relayed by intermediary neurons (black circle and square). Neuron b was a second-order neuron that received three, convergent, direct monosynaptic ST inputs (red circle, triangle, and square) with no polysynaptic events detected. Note that indirect, or polysynaptic, pathways are represented diagrammatically as only a single intervening neuron but may involve serial connections through additional cells. stim, Stimulus.
Higher-order neurons
A relatively small group of NTS neurons recorded received only indirect ST-driven information (6 of 48 neurons). As with the high-jitter, polysynaptic ST inputs to second-order NTS neurons, ST-activated EPSCs to higher-order neurons had high jitter and were failure-prone (Fig. 4, neuron “a”). It is important to note that under our recording conditions, ST-evoked GABAergic inputs were not apparent, although recording at depolarized potentials revealed that many of these NTS neurons also received ST-activated polysynaptic IPSCs (data not shown) similar to previous reports (Andresen and Yang, 1995; Doyle and Andresen, 2001; Bailey et al., 2008). Such ST-driven IPSCs represent an additional source of polysynaptic convergence to these NTS neurons which we did not quantify in the present study.
Figure 4.
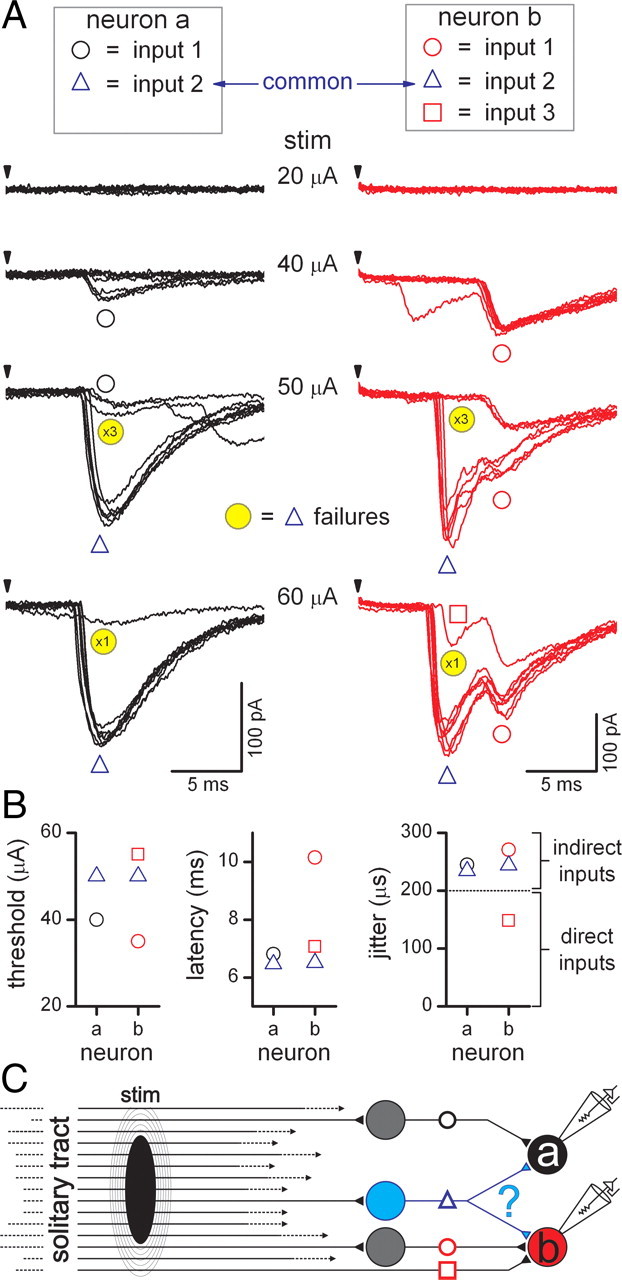
Solitary tract afferent divergence testing. To detect potentially shared sources of afferent information (divergence), we examined the thresholds and event information to test whether any single afferents activated inputs to each neuron during paired recordings. A, In two medial NTS neurons recorded simultaneously (neuron “a,” black traces, and neuron “b,” red traces), ST shocks (arrows) of 40 μA activated single inputs to each neuron (black and red circles, 8 trials overlaid, artifact blanked). High variability in the latency of these events (jitter >200 μs) suggests that these EPSCs were polysynaptic. At 50 μA, two additional high-jitter EPSCs (blue triangles) were recruited at identical thresholds and exhibited simultaneous synaptic failures (yellow circles). These failures reveal the underlying inputs 1 (black and red circles) to each neuron recruited at lower shock intensities that were obscured during the larger, earlier onset events (blue triangles). At 60 μA, synaptic failures in neuron “b” revealed another newly recruited underlying event (input 3, red square) that likely contributes to compound EPSCs when input 2 did not fail. Input 2 (blue triangles) failures in each neuron at 50 through to 60 μA were simultaneous, a finding that together with an identical stimulus threshold suggests that the recruitment of a single ST axon was responsible for triggering a common polysynaptic pathway to both neurons. B, Latency and jitter values for each input were different and indicated four polysynaptic inputs and one monosynaptic input (input 3, red square to neuron “b”) were recruited to both neurons in total. However, threshold values for input 2 (blue triangles) in both neurons was identical. C, The findings in this pair of neurons suggest a different element in pathway organization and connectivity. Activation of a single ST afferent may have excited a polysynaptic pathway that concluded with an intermediary neuron (blue neuron) sending divergent collaterals to both recorded neurons. stim, Stimulus.
Limited divergence of single ST afferents to multiple neurons
High intensities of ST shocks activated multiple ST afferent axons. Differences in stimulus intensity thresholds for each event suggested that individual inputs were triggered independently through afferent ST axons with distinct thresholds. Every ST-driven input exhibited an all-or-none stimulus-response profile regardless of pathway; monosynaptic or polysynaptic. Anatomical evidence suggests that single ST afferent axons can branch to distribute terminals within the vicinity of different neurons in NTS (Kubin et al., 2006). We reasoned that, for our pairs of recorded neurons, the proximity of the cell bodies and their presumed dendritic distributions might increase the likelihood of receiving branches from a common ST afferent axon. Inputs triggering synaptic events that arise from a common axon would be expected to have comparable threshold intensities. Therefore, to detect common inputs, we inspected and compared EPSC thresholds across all potentially shared input combinations (47 potentially shared inputs in 13 neuron pairs). Seven synaptic event pairs in six pairs of neurons had sufficiently similar thresholds (within 10% of full intensity range) to be suspected as triggered by a common ST axon. Of these 14 suspect events, four EPSC pairs were polysynaptic and three EPSC pairs were monosynaptic. After full analysis, only two neuron pairs exhibited sufficient evidence to support common sources of initiation—one pair with linked polysynaptic EPSCs and one pair with linked monosynaptic EPSCs.
In one case of suspected common sourced EPSCs, paired neurons “a” and “b” were adjacent to one another and ST-evoked EPSCs were triggered in both neurons at the same threshold intensity (Fig. 4A,B; input 2 in each neuron, blue triangles). Both suspected common EPSCs had similar latency and jitter (>200 μs) that were consistent with activation along a polysynaptic pathway (Fig. 4B). Each of these neurons received additional ST-synced EPSCs which appeared independent with unique thresholds and jitter (Fig. 4A–C, inputs 1 and 3). Examination of the records showed that the suspected common inputs failed frequently (Fig. 4A, yellow circles, 50 and 60 μA traces) and raised the possibility that a single neuron diverged to connect to both neurons (Fig. 4C). More focused analysis showed that input 2 failed in unison in both neurons repeatedly over multiple trials at a 100% cofailure rate (Fig. 5A,B; supplemental Fig. 2, animated GIF, available at www.jneurosci.org as supplemental material). Interestingly, the amplitudes of successful transmission of input 2 EPSCs were uncorrelated across neurons suggesting that the fluctuation in release probability was independent across neurons (Fig. 5B). However, the timing of input 2 EPSCs closely tracked changes in latency between the two EPSCs and produced a positive, linear correlation (p < 0.05, linear regression) from one neuron to the other (Fig. 5C). The cross-neuron synchrony of synaptic failures and high quantitative correlation of EPSC latencies is most likely accounted for by activation of a single ST axon (identical threshold) that excited a single pathway to a common intervening interneuron (Fig. 5, blue model pathway). Examination of the remaining three pairs of suspected common polysynaptic EPSCs exhibited low cofailure rates (31, 23, and 0%) and uncorrelated EPSC latencies (p > 0.05, linear regression), suggesting these EPSCs were not initiated by common source interneurons.
Figure 5.
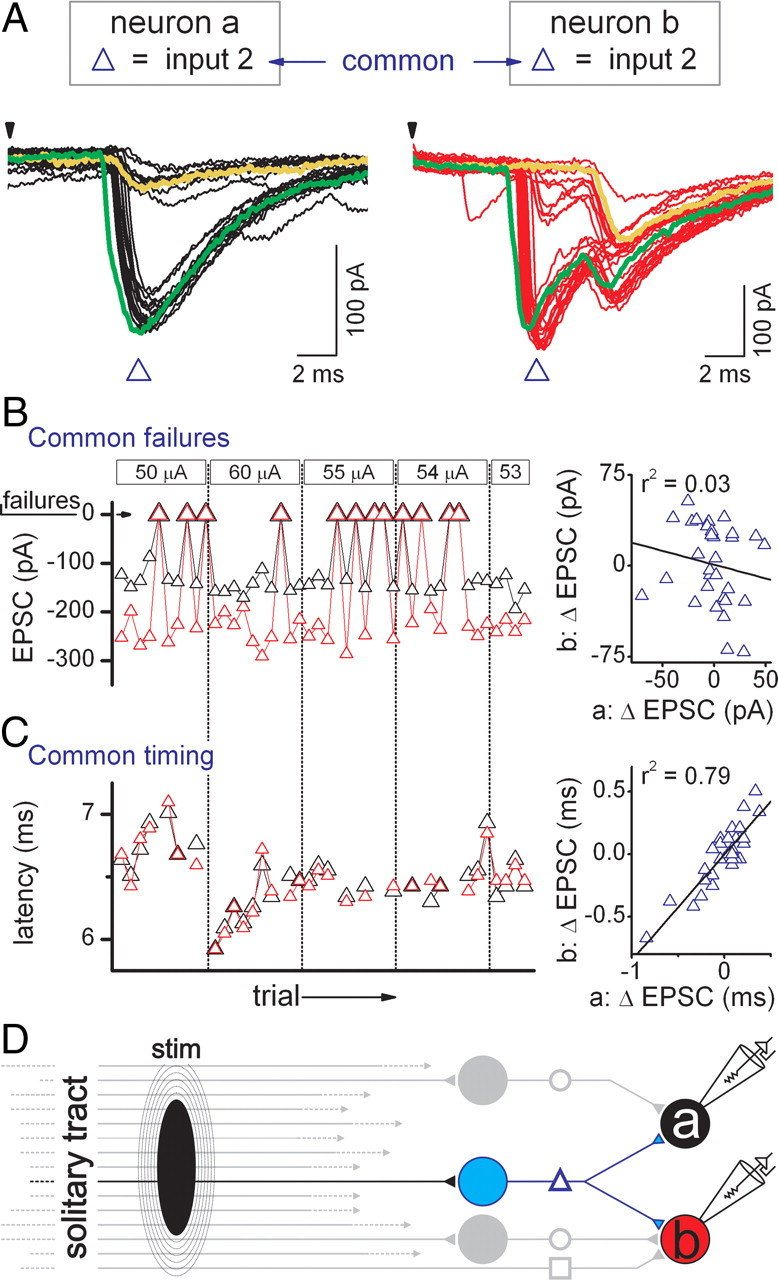
Polysynaptic pathways transfer activity along serial, multineuronal connections that are prone to failure. An analysis of failure sequences across neuron pairs examined the occurrence of simultaneous failures, or cofailures, that suggest a common input. A, Records (30 trials overlaid) from neurons “a” (black traces) and “b” (red traces) are the same neurons as in Figure 4. ST shocks were suprathreshold at intensities of 50, 54, and 55 μA. In this pair of neurons, failures of input 2 (blue triangle) in neuron “a” were always accompanied by simultaneous failures of input 2 (blue triangle) in neuron “b,” as exemplified in the yellow traces. Interestingly, earlier than normal arrival of input 2 EPSCs also occurred simultaneously in both neurons (green traces). B, Amplitudes of input 2 EPSCs in neurons “a” (black triangle) and “b” (red triangle) as well as zero-amplitude failures are plotted in the chronological order of acquisition as shock intensities were tested. Input 2 failures were synchronous 100% of the time across these two neurons but the change in EPSC amplitude from event to event was not correlated between the two neurons (right graph). C, Arrival times (latency) of input 2 EPSCs recorded in neurons “a” (black triangles) and “b” (red triangles) fluctuated (high jitter) across trials and stimulus intensities. In contrast to amplitude, changes in EPSC latency from event to event were highly correlated between the two recorded neurons (right graph). D, These data suggest input 2 in neuron “a” is linked to input 2 to neuron “b.” Both neurons shared a single common source (blue neuron) that contacted each and represents divergence of information initiated by activation of a single ST afferent. To better convey cofailures across both neurons, a subanalysis of the neurons of Figure 4 with ST-EPSCs recorded in each neuron for each trial is displayed in a dynamic GIF (supplemental Figure 2, available at www.jneurosci.org as supplemental material). This subanalysis input 2 (blue triangles) highlights cofailures on a trial-by-trial basis in the two recorded neurons. Failures (red cross) always occurred together, indicating a common input to each neuron. Note that small-amplitude slower-kinetic events are revealed with input 2 failures in each neuron (trials 5, 8, 14, etc.) and correspond to inputs 1 (black and red circles) and 3 (red square) to neurons “a” and “b” in Figure 4. stim, Stimulus.
One pair of neurons received ST-EPSCs that covaried to a degree consistent with reliance on a single common ST axon, i.e., a collateralizing branch. The suspected pair of neurons had cell bodies that were ∼40 μm apart and both received a single, monosynaptic ST input (Fig. 6). Both monosynaptic ST-EPSCs were recruited at the same threshold intensity with no failures. To facilitate synaptic failures, we subjected the ST–NTS responses to repeated bursts of five shocks at 50 Hz, a paradigm which substantially raises failure rates in most NTS neurons (Andresen and Peters, 2008). Analysis of repeated shocks showed that use-dependent synaptic failures occurred in near unison in both neurons, with a cofailure rate of 87% for EPSC2–ESPC5 (ESPC2–5) (Fig. 6C). The highly correlated incidences of both successes and failures between neurons “a” and “b” were not random (χ2 = 89.175, 1 df, p < 0.001). Thus, the synaptic response of one neuron was an excellent predictor of the EPSC in the second neuron. In contrast, in two additional suspected neurons, cofailure rates for EPSC2–5 were 31% (χ2 = 6.314, 1 df, p = 0.012) and 35% (Fig. 3C, input 2 to each neuron) (χ2 = 3.043, 1 df, p = 0.081) and thus consistent with unrelated sources. Failures in common (Fig. 6C) suggest a common site in which action potential conduction is interrupted along a single ST axon and the simplest configuration would be failure distal to a single ST axon branching to contact each neuron (Fig. 6D). Thus, given the low incidence of neurons demonstrating common inputs for neurons in close proximity, we conclude sharing information across neurons is relatively infrequent, compared with convergence, in NTS.
Figure 6.
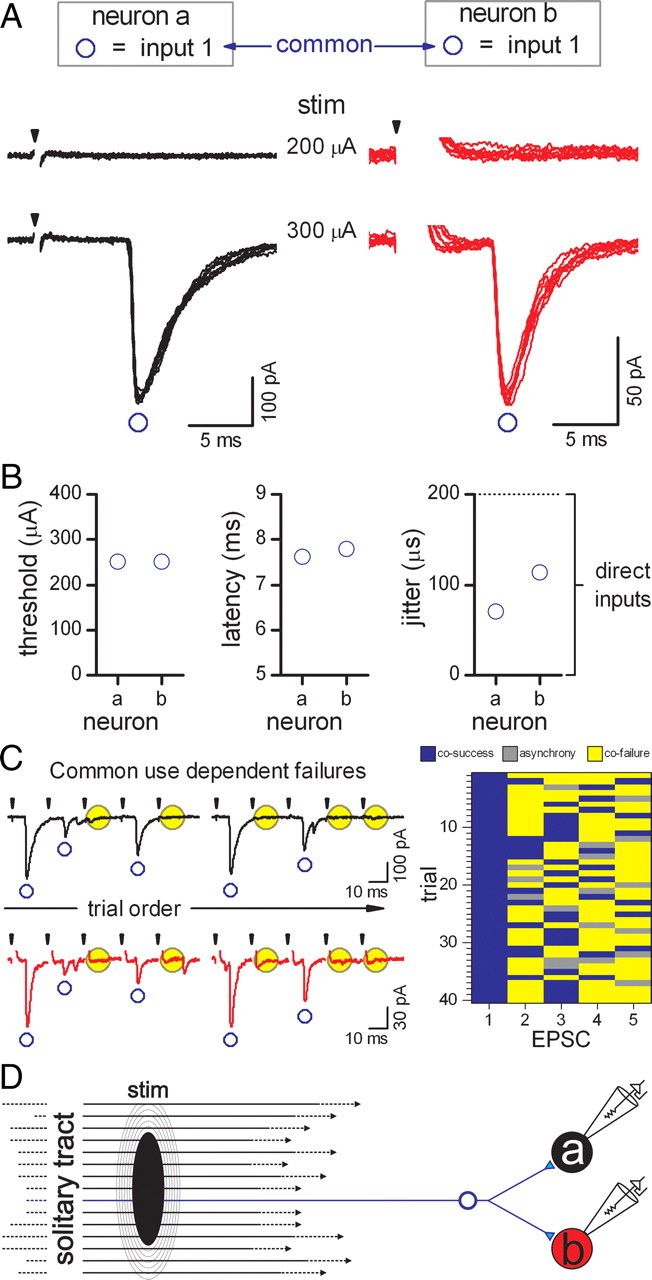
Afferent divergence of a single ST afferent axon contacting multiple second-order NTS neurons. A, Multiple trials (8 trials overlaid, artifact blanked) from neurons “a” (black traces) and “b” (red traces) recorded simultaneously indicated that input 1 to both neurons shared an equal recruitment threshold. B, Latencies and corresponding jitter were somewhat different across neurons. C, Although no failures were observed at EPSC1, trains of ST shocks produced intermittent failures in each neuron during use-dependent depression, i.e., at EPSC2, ESPC3, ESPC4, and ESPC5. Use-dependent failures in neurons “a” and “b” were found to occur simultaneously (left traces). The use-dependent cofailure rate between neurons “a” and “b” using an intermittent burst of five shocks was 87% (for EPSC2–5), such that there was a high level of synchrony between the neurons (image plot; blue, cosuccess; yellow, = cofailure; gray blocks; asynchrony). Monosynaptic EPSCs with similar thresholds were examined in three pairs of neurons, but only this pair suggested a pattern of coincidence (χ2 = 89.175, 1 df, p < 0.001). D, These data suggest shocks to the ST activated one afferent axon that branched to evoke EPSCs in both neurons and represents divergence of primary cranial afferent information across multiple NTS neurons. stim, Stimulus.
Most medial NTS neurons received direct input from one primary visceral afferent
Our paired recordings from medial NTS suggest several patterns ST afferent organization with medial NTS neurons. Approximately three-quarters of the neurons in medial NTS (Fig. 7A) (36 of 48 neurons) were contacted directly by ST afferents via low-jitter, nonfailing EPSCs and were classified as second-order NTS neurons. Of the remaining neurons studied, 13% (6 of 48) received only high-jitter, polysynaptic EPSCs and were classified as higher-order NTS neurons. The remaining neurons (6 of 48) exhibited no ST-synced synaptic events.
Figure 7.

Summary of occurrence and distribution of direct monosynaptic and polysynaptic excitatory inputs to neurons within the medial NTS. A, Of the 24 pairs sampled, six neurons did not exhibit EPSCs regardless of the shock intensity delivered at the ST (not connected, white, pie chart). Six neurons received one or more polysynaptic inputs but no monosynaptic inputs and were classified as higher-order neurons (red, pie chart). The remaining neurons (36 cells, 75%) received at least one monosynaptic input and were classified as second-order neurons (green, pie chart). Approximately two-thirds of second-order neurons received just one ST afferent input. The remaining second-order neurons received multiple monosynaptic inputs, but no more than three per cell were detected (green bar graph). Two-thirds of second-order NTS neurons were found to have no polysynaptic excitatory inputs. The remaining second-order cells received one or two polysynaptic excitatory inputs (blue bar graph). Overall, nearly half of the second-order neurons received only one monosynaptic afferent input, and the other half received a combination of monosynaptic and/or polysynaptic input (gray bar graph) B, A total of 81 excitatory inputs to 42 (connected) cells were detected and characterized. The amplitude of EPSC1 versus jitter indicates direct monosynaptic inputs (green circles and square = mean ± SEM) tended to be larger than polysynaptic inputs (blue circles and square = mean ± SEM) to second-order neurons and significantly greater than polysynaptic inputs to higher-order neurons (red circles and square = mean ± SEM, p < 0.05 versus monosynaptic inputs, one-way ANOVA). The distribution of monosynaptic inputs was shifted to the right such that several exhibited amplitudes of >200 pA (bar graph inset). Note that the amplitudes of 19 inputs could not be determined accurately due to compound EPSCs and were excluded from the amplitude graphs and statistical analysis. Polysynaptic inputs (blue and red) also exhibit significantly greater failure rates compared with monosynaptic EPSCs (green) (right graph, p < 0.05 versus monosynaptic inputs, one-way ANOVA). Together, ST-driven polysynaptic excitatory inputs to NTS neurons carried less synaptic weight than direct monosynaptic afferent inputs to second or higher-order neurons.
In general, most second-order NTS neurons received a single monosynaptic contact from the ST (Fig. 7A) (64% of second-order neurons, 23 of 36). Most of these second-order neurons received no polysynaptic EPSCs. However, in the remaining second-order neurons, additional convergent EPSCs were equally likely to be direct or indirect. Many second-order neurons received only a single ST-EPSC with no other synaptic inputs linked to ST (Fig. 7A) (44% of second-order neurons, 16 of 35). Whether direct or indirect, the total number of inputs converging on a single second-order neuron rarely exceeded three (Fig. 7A). Even in neurons classified as higher-order cells, ST-synced inputs did not exceed three (data not shown).
A total of 81 excitatory inputs were characterized in 42 neurons (47 monosynaptic, 34 polysynaptic). Recruitment thresholds ranged from 10 to 500 μA and 80% of inputs were first activated at shock intensities of <200 μA. Despite the relatively short potential path length, the measured range of ST-EPSC latencies was quite large and extended from 2 to 15.1 ms. The mean latency for monosynaptic EPSCs was shorter than polysynaptic EPSCs (5.74 ± 0.22 and 7.11 ± 0.46 ms respectively, p < 0.05, one-way ANOVA). Amplitudes of monosynaptic ST-EPSCs averaged more than twice that of polysynaptic ST-EPSCs to both second- and higher-order neurons (Fig. 7B) (Kruskal-Wallis one-way ANOVA on ranks, n = 62, with 19 amplitudes that could not be assessed due to compound EPSCs). Within neurons, monosynaptic ST-EPSCs were almost always larger than polysynaptic ST-EPSCs projecting to the same second-order neuron. In most neurons receiving both polysynaptic and monosynaptic inputs (10 of 12), polysynaptic EPSC had an average amplitude only 55 ± 22% of that of the largest monosynaptic EPSC to that neuron. In two neurons, polysynaptic EPSCs had larger amplitudes than the monosynaptic EPSC. The amplitudes of polysynaptic ST-EPSCs clustered at <200 pA (Fig. 7B, inset). Monosynaptic EPSC1s rarely failed whereas polysynaptic ST-EPSCs failed frequently, typically >5%. Although the general associations between high failures and high jitter were strong, exceptions were encountered occasionally. A few polysynaptic inputs that exhibited high jitter (>200 μs) did not fail at all on EPSC1 (Fig. 7B). In four cases, failure rates exceeded 5% despite the presence of low-jitter EPSCs that met the monosynaptic criterion (Fig. 7B). Thus, across all neurons, medial NTS is overwhelmingly composed of second-order neurons directly connected to limited numbers of ST afferents with substantial numbers of convergent EPSCs arriving via generally weaker polysynaptic EPSCs.
Discussion
As cranial visceral afferents enter the brain, the precise patterns of how those ST afferent axons contact NTS neurons determine the first stage of information processing. Analysis of stimulus recruitment profiles and the timing and waveforms of ST-evoked EPSCs within the medial NTS suggest three main points about the organization of ST-driven neurotransmission. (1) More than half of second-order neurons received convergent ST-driven information, albeit limited in number and equally likely to be polysynaptic as monosynaptic. (2) In considering direct ST afferent contacts only, two-thirds of second-order neurons received a single monosynaptic input. (3) Divergence of ST-driven signaling between pairs of neurons was infrequent. These synaptic patterns describe an ST–NTS network that is often driven by a single strong monosynaptic inputs and consequently by a single afferent type. A second group of second-order neurons, however, received multiple synaptic contacts that may mix afferent types. Thus, processing of cranial visceral afferent signaling in medial NTS relies on a highly parallel organization of afferent processing and this relatively sparse afferent information flow defines dedicated neurons with limited cross-afferent convergence, divergence and mixing.
Discriminating synaptic pathways
Our analysis of ST-activated EPSCs began with discrimination of monosynaptic from polysynaptic pathways. This discrimination relied on quantitative measures of latency variability of ST-EPSCs and the principle that only direct coupling through a single synapse met the <200 μs jitter criterion. Second-order NTS neurons identified anatomically by fluorescently labeled primary afferent terminals never exceeded 200 μs jitter (Andresen and Peters, 2008). Similarly, dye-identified second-order neurons contacted by carotid chemoreceptor or vagal afferents conformed to this jitter criterion (Kline et al., 2002; Zhang et al., 2009). The 200 μs jitter criterion successfully identified polysynaptic IPSCs initiated by ST shocks in NTS (Smith et al., 1998; Doyle and Andresen, 2001; Bailey et al., 2008). A second but less discriminating criterion often uses transmission failures to functionally separate direct from polysynaptic pathways. Neurons which are activated by pairs of closely timed afferent shocks (e.g., 5 ms) are considered monosynaptically innervated in extracellular and intracellular CNS recordings (Donoghue et al., 1985; Miles, 1986; Scheuer et al., 1996). In our recordings, failure rates of single-shock ST-EPSC classified as monosynaptic using jitter were nearly always 0%. In a few cases, however, higher failure rates were encountered despite <200 μs jitter and were classified as monosynaptic. Failure rates as an index of synaptic order, however, can be misleading. Some ST-evoked IPSCs in NTS neurons reliably follow 200 Hz ST trains (Doyle and Andresen, 2001). Conversely, in dye-identified second-order neurons, ST-EPSC failure rates of 30–40% were possible in response to bursts of ST shocks (Doyle and Andresen, 2001). Failures of ST-EPSCs in some neurons may also be modified by neuropeptides through a presynaptic mechanism rather than pathway failures between neurons (Bailey et al., 2006b). Together, this independent evidence suggests that while elevated failure rates are correlated with higher pathway complexity, failures are not as reliable an indicator of synaptic order as latency jitter.
Medial NTS neurons overwhelmingly second order
A major goal of this work was to determine whether there were patterns in the organizational relationship between ST afferents and NTS neurons. We randomly sampled medial NTS neurons two at a time and determined their connections using ST-initiated synaptic responses. The results suggest that neurons in the medial subnucleus are overwhelmingly second order to visceral sensory neurons. Together, such findings were consistent with a basic organizational module of a single ST axon leading directly to a single second-order neuron. Variations on that basic ST module included neurons that received 1 or 2 additional monosynaptic, polysynaptic, or mixed inputs. In each case, monosynaptic ST-EPSCs had unitary all-or-none intensity recruitment profiles. The intensity recruitment profiles for polysynaptic EPSCs were also all-or-none, indicating a single ST afferent activated the polysynaptic path. Electrical shocks to ST likely simultaneously activated large proportions of the thousands of ST axons. These basic ST modules were surprisingly isolated from this potentially enormous pool of local afferents. Polysynaptic inputs tended to be weaker and failed more frequently compared with monosynaptic inputs. Thus, polysynaptic inputs should have less influence on neuron activity than primary afferent inputs. Physiologically, this configuration facilitates more faithful transfer of highly focused information and may be the exclusive organization for particular afferents such as aortic baroreceptors (Andresen and Peters, 2008). Our electrophysiological approach did not define the modality or organ source of ST afferent terminals in this study. Convergent inputs may represent a single modality (e.g., baroreceptor) or represent mixed sources (e.g., cardiorespiratory) from different organs and/or sensory modalities (e.g., chemoreceptive or mechanosensitive). Likewise, some particular organizational constructs such as multiple convergent monosynaptic inputs may be favored by particular NTS phenotypes such as catecholaminergic neurons (Appleyard et al., 2007).
The ST–NTS pattern of excitatory convergence contrasted with cortical examples in which robust convergence is common. In cortex, single inputs fail often, 22% for white matter tract inputs to cerebellar cortex (Kanichay and Silver, 2008) or 50% mossy fiber failures to CA3 hippocampal neurons (Lawrence et al., 2004). Although unreliable cortical release can have near-quantal amplitudes, recruitment of multiple convergent inputs achieves reliable transmission (Allen and Stevens, 1994). At ST–NTS synapses, the converse prevails: single or few unfailing excitatory inputs with large unitary amplitudes. Our studies indicate that ST afferent convergence is limited, but these basic ST connections depend on a reliable process known to have intrinsically high release probability for glutamate, resulting in a very high safety factor (Bailey et al., 2006b; Andresen and Peters, 2008; Peters et al., 2008).
Common inputs across multiple neurons
Some classes of ST afferent axons branch to send collaterals across NTS (Kalia and Richter, 1985) and retrograde activation profiling suggests similar branching of single aortic baroreceptors in medial NTS (Donoghue et al., 1982a). In our slices, we found two pairs of neurons with ST-EPSCs with equivalent shock thresholds that likely shared common inputs. Evidence in our studies suggested one case that likely arose from a common interneuron source, exhibiting tightly correlated variations in latency and synchronous failures. In the other case, likely a single collateralizing ST axon produced low-jitter EPSCs with synchronous use-dependent failures in two neurons. We found no evidence to support single afferents driving both monosynaptic and polysynaptic inputs. Thus, afferent divergence seems rare between closely located medial NTS neurons. Patterns or organization may differ in other subregions, and our methods did not allow us to assess the cross-subregion divergence suggested by anatomical afferent tracing (Kubin et al., 2006). Our assay measures transmission from successfully depolarized terminals and, under other conditions, successful transmission, the number of contacts, and the potential for branch point failures might change (Bailey et al., 2006b; Peters et al., 2008).
Potential caveats of our approach include that it likely underestimates the number of ST-synced EPSCs across neurons so that clearly the precise proportions of monosynaptic and polysynaptic connections may also be affected by our methods of approach. First, some ST axons or receptive dendrites may be severed and this will result in underestimation of the number and amplitude of ST pathway connections. Such damage might be indicated by the 10–20% of NTS neurons that fail to respond to ST activation across slice studies (Appleyard et al., 2007; Bailey et al., 2008). Axon sectioning might also contribute to differences in event amplitudes if branches are cut. Second, detection of inputs may be limited in certain circumstances. For example, activation of compound or large events likely obscures detection of lower amplitude EPSCs recruited at higher shock intensities and lead to underestimation of ST-synced inputs (Hamann et al., 2003). Last, our study design deliberately minimized observation of IPSCs by recording near the chloride reversal potential. ST-evoked IPSCs represent an important uncounted population of convergent ST-activated polysynaptic pathways (Smith et al., 1998; Derbenev et al., 2006; Bailey et al., 2008).
Afferent pathway organization to NTS
Despite these caveats, the in vitro patterns of convergence resemble the proportions of convergent afferent inputs detected in intact animals using physiological or electrical activation of different afferent groups. Maximal shocks to multiple whole peripheral nerve trunks commonly trigger spikes within NTS identified as single afferent inputs in ∼85% of cases (Donoghue et al., 1985; Bonham and Hasser, 1993; Ootani et al., 1995; Mifflin, 1996). Convergence among cardiovascular afferents—arterial baroreceptors with cardiac mechanoreceptors—is similarly rare (<13%) in NTS neurons using pharmacological or physiological activation (Paton, 1998; Seagard et al., 1999). In vivo studies in which synaptic order was evaluated suggest that input from one nerve trunk met monosynaptic criteria while all convergent inputs from additional nerves were polysynaptic (Mifflin, 1996). Such in vivo results suggest that most NTS neurons conform to the most common basic ST module described by our slice results. Obtaining intracellular recordings in vivo from these small NTS neurons is difficult, and our present results establish several approaches in slices with sufficient resolution and control to discern timing, synaptic order, and cross-neuron interactions that could not be obtained in an intact CNS.
Summary
ST synaptic contacts define the position most neurons within the NTS network occupy. The organization of information flow from primary cranial visceral afferents into the brain, at its most basic, consists of a single afferent exciting a single NTS neuron. Additions of monosynaptic and/or polysynaptic inputs produce different configurations and subsets of organization that may be associated with particular projection pathways or efferent systems. This relatively compartmentalized organization may reflect the dedication of specific afferent modalities to particular pathways and may underwrite the network architecture for separation of discrete organ homeostatic control.
Footnotes
This work was supported by grants from the National Institutes of Health [Grant HL-41119 (M.C.A.) and Fellowship HL-88894 (J.H.P.)] and by National Health and Medical Research Council of Australia Overseas Training C. J. Martin Fellowship Grant 400405 (S.J.M.).
References
- Acuna-Goycolea C, Brenowitz SD, Regehr WG. Active dendritic conductances dynamically regulate GABA release from thalamic interneurons. Neuron. 2008;57:420–431. doi: 10.1016/j.neuron.2007.12.022. [DOI] [PubMed] [Google Scholar]
- Allen C, Stevens CF. An evaluation of causes for unreliability of synaptic transmission. Proc Natl Acad Sci U S A. 1994;91:10380–10383. doi: 10.1073/pnas.91.22.10380. [DOI] [PMC free article] [PubMed] [Google Scholar]
- Altschuler SM, Ferenci DA, Lynn RB, Miselis RR. Representation of the cecum in the lateral dorsal motor nucleus of the vagus nerve and commissural subnucleus of the nucleus tractus solitarii in rat. J Comp Neurol. 1991;304:261–274. doi: 10.1002/cne.903040209. [DOI] [PubMed] [Google Scholar]
- Andresen MC, Peters JH. Comparison of baroreceptive to other afferent synaptic transmission to the solitary tract nucleus. Am J Physiol Heart Circ Physiol. 2008;295:H2032–H2042. doi: 10.1152/ajpheart.00568.2008. [DOI] [PMC free article] [PubMed] [Google Scholar]
- Andresen MC, Yang M. Dynamics of sensory afferent synaptic transmission in aortic baroreceptor regions of nucleus tractus solitarius. J Neurophysiol. 1995;74:1518–1528. doi: 10.1152/jn.1995.74.4.1518. [DOI] [PubMed] [Google Scholar]
- Appleyard SM, Marks D, Kobayashi K, Okano H, Low MJ, Andresen MC. Visceral afferents directly activate catecholamine neurons in the solitary tract nucleus. J Neurosci. 2007;27:13292–13302. doi: 10.1523/JNEUROSCI.3502-07.2007. [DOI] [PMC free article] [PubMed] [Google Scholar]
- Bailey TW, Hermes SM, Andresen MC, Aicher SA. Cranial visceral afferent pathways through the nucleus of the solitary tract to caudal ventrolateral medulla or paraventricular hypothalamus: target-specific synaptic reliability and convergence patterns. J Neurosci. 2006a;26:11893–11902. doi: 10.1523/JNEUROSCI.2044-06.2006. [DOI] [PMC free article] [PubMed] [Google Scholar]
- Bailey TW, Jin YH, Doyle MW, Smith SM, Andresen MC. Vasopressin inhibits glutamate release via two distinct modes in the brainstem. J Neurosci. 2006b;26:6131–6142. doi: 10.1523/JNEUROSCI.5176-05.2006. [DOI] [PMC free article] [PubMed] [Google Scholar]
- Bailey TW, Appleyard SM, Jin YH, Andresen MC. Organization and properties of GABAergic neurons in solitary tract nucleus (NTS) J Neurophysiol. 2008;99:1712–1722. doi: 10.1152/jn.00038.2008. [DOI] [PubMed] [Google Scholar]
- Blitz DM, Regehr WG. Timing and specificity of feed-forward inhibition within the LGN. Neuron. 2005;45:917–928. doi: 10.1016/j.neuron.2005.01.033. [DOI] [PubMed] [Google Scholar]
- Bonham AC, Hasser EM. Area postrema and aortic or vagal afferents converge to excite cells in nucleus tractus solitarius. Am J Physiol. 1993;264:H1674–H1685. doi: 10.1152/ajpheart.1993.264.5.H1674. [DOI] [PubMed] [Google Scholar]
- Davies RO, Kubin L. Projection of pulmonary rapidly adapting receptors to the medulla of the cat: an antidromic mapping study. J Physiol. 1986;373:63–86. doi: 10.1113/jphysiol.1986.sp016035. [DOI] [PMC free article] [PubMed] [Google Scholar]
- Derbenev AV, Monroe MJ, Glatzer NR, Smith BN. Vanilloid-mediated heterosynaptic facilitation of inhibitory synaptic input to neurons of the rat dorsal motor nucleus of the vagus. J Neurosci. 2006;26:9666–9672. doi: 10.1523/JNEUROSCI.1591-06.2006. [DOI] [PMC free article] [PubMed] [Google Scholar]
- Donoghue S, Garcia M, Jordan D, Spyer KM. Identification and brain-stem projections of aortic baroreceptor afferent neurones in nodose ganglia of cats and rabbits. J Physiol. 1982a;322:337–352. doi: 10.1113/jphysiol.1982.sp014040. [DOI] [PMC free article] [PubMed] [Google Scholar]
- Donoghue S, Garcia M, Jordan D, Spyer KM. The brain-stem projections of pulmonary stretch afferent neurones in cats and rabbits. J Physiol. 1982b;322:353–363. doi: 10.1113/jphysiol.1982.sp014041. [DOI] [PMC free article] [PubMed] [Google Scholar]
- Donoghue S, Felder RB, Gilbey MP, Jordan D, Spyer KM. Post-synaptic activity evoked in the nucleus tractus solitarius by carotid sinus and aortic nerve afferents in the cat. J Physiol. 1985;360:261–273. doi: 10.1113/jphysiol.1985.sp015616. [DOI] [PMC free article] [PubMed] [Google Scholar]
- Doyle MW, Andresen MC. Reliability of monosynaptic transmission in brain stem neurons in vitro. J Neurophysiol. 2001;85:2213–2223. doi: 10.1152/jn.2001.85.5.2213. [DOI] [PubMed] [Google Scholar]
- Doyle MW, Bailey TW, Jin YH, Appleyard SM, Low MJ, Andresen MC. Strategies for cellular identification in nucleus tractus solitarius slices. J Neurosci Methods. 2004;137:37–48. doi: 10.1016/j.jneumeth.2004.02.007. [DOI] [PubMed] [Google Scholar]
- Hamann M, Billups B, Forsythe ID. Non-calyceal excitatory inputs mediate low fidelity synaptic transmission in rat auditory brainstem slices. Eur J Neurosci. 2003;18:2899–2902. doi: 10.1111/j.1460-9568.2003.03017.x. [DOI] [PubMed] [Google Scholar]
- Kalia M, Richter D. Morphology of physiologically identified slowly adapting lung stretch receptor afferents stained with intra-axonal horseradish peroxidase in the nucleus of the tractus solitarius of the cat. I. A light microscopic analysis. J Comp Neurol. 1985;241:503–520. doi: 10.1002/cne.902410409. [DOI] [PubMed] [Google Scholar]
- Kanichay RT, Silver RA. Synaptic and cellular properties of the feedforward inhibitory circuit within the input layer of the cerebellar cortex. J Neurosci. 2008;28:8955–8967. doi: 10.1523/JNEUROSCI.5469-07.2008. [DOI] [PMC free article] [PubMed] [Google Scholar]
- Kline DD, Takacs KN, Ficker E, Kunze DL. Dopamine modulates synaptic transmission in the nucleus of the solitary tract. J Neurophysiol. 2002;88:2736–2744. doi: 10.1152/jn.00224.2002. [DOI] [PubMed] [Google Scholar]
- Kubin L, Alheid GF, Zuperku EJ, McCrimmon DR. Central pathways of pulmonary and lower airway vagal afferents. J Appl Physiol. 2006;101:618–627. doi: 10.1152/japplphysiol.00252.2006. [DOI] [PMC free article] [PubMed] [Google Scholar]
- Lawrence JJ, Grinspan ZM, McBain CJ. Quantal transmission at mossy fibre targets in the CA3 region of the rat hippocampus. J Physiol. 2004;554:175–193. doi: 10.1113/jphysiol.2003.049551. [DOI] [PMC free article] [PubMed] [Google Scholar]
- Loewy AD. Central autonomic pathways. In: Loewy AD, Spyer KM, editors. Central regulation of autonomic functions. New York: Oxford; 1990. pp. 88–103. [Google Scholar]
- Mifflin SW. Inhibition of chemoreceptor inputs to nucleus of tractus solitarius neurons during baroreceptor stimulation. Am J Physiol. 1993;265:R14–R20. doi: 10.1152/ajpregu.1993.265.1.R14. [DOI] [PubMed] [Google Scholar]
- Mifflin SW. Convergent carotid sinus nerve and superior laryngeal nerve afferent inputs to neurons in the NTS. Am J Physiol Regul Integr Comp Physiol. 1996;271:R870–R880. doi: 10.1152/ajpregu.1996.271.4.R870. [DOI] [PubMed] [Google Scholar]
- Miles R. Frequency dependence of synaptic transmission in nucleus of the solitary tract in vitro. J Neurophysiol. 1986;55:1076–1090. doi: 10.1152/jn.1986.55.5.1076. [DOI] [PubMed] [Google Scholar]
- Ootani S, Umezaki T, Shin T, Murata Y. Convergence of afferents from the SLN and GPN in cat medullary swallowing neurons. Brain Res Bull. 1995;37:397–404. doi: 10.1016/0361-9230(95)00018-6. [DOI] [PubMed] [Google Scholar]
- Paton JF. Pattern of cardiorespiratory afferent convergence to solitary tract neurons driven by pulmonary vagal C-fiber stimulation in the mouse. J Neurophysiol. 1998;79:2365–2373. doi: 10.1152/jn.1998.79.5.2365. [DOI] [PubMed] [Google Scholar]
- Peters JH, McDougall SJ, Kellett DO, Jordan D, Llewellyn-Smith IJ, Andresen MC. Oxytocin enhances cranial visceral afferent synaptic transmission to the solitary tract nucleus. J Neurosci. 2008;28:11731–11740. doi: 10.1523/JNEUROSCI.3419-08.2008. [DOI] [PMC free article] [PubMed] [Google Scholar]
- Rancz EA, Ishikawa T, Duguid I, Chadderton P, Mahon S, Häusser M. High-fidelity transmission of sensory information by single cerebellar mossy fibre boutons. Nature. 2007;450:1245–1248. doi: 10.1038/nature05995. [DOI] [PMC free article] [PubMed] [Google Scholar]
- Saper CB. The central autonomic nervous system: Conscious visceral perception and autonomic pattern generation. Annu Rev Neurosci. 2002;25:433–469. doi: 10.1146/annurev.neuro.25.032502.111311. [DOI] [PubMed] [Google Scholar]
- Scheuer DA, Zhang J, Toney GM, Mifflin SW. Temporal processing of aortic nerve evoked activity in the nucleus of the solitary tract. J Neurophysiol. 1996;76:3750–3757. doi: 10.1152/jn.1996.76.6.3750. [DOI] [PubMed] [Google Scholar]
- Seagard JL, Dean C, Hopp FA. Role of glutamate receptors in transmission of vagal cardiac input to neurones in the nucleus tractus solitarii in dogs. J Physiol. 1999;520:243–253. doi: 10.1111/j.1469-7793.1999.00243.x. [DOI] [PMC free article] [PubMed] [Google Scholar]
- Smith BN, Dou P, Barber WD, Dudek FE. Vagally evoked synaptic currents in the immature rat nucleus tractus solitarii in an intact in vitro preparation. J Physiol. 1998;512:149–162. doi: 10.1111/j.1469-7793.1998.149bf.x. [DOI] [PMC free article] [PubMed] [Google Scholar]
- Travagli RA, Hermann GE, Browning KN, Rogers RC. Brainstem circuits regulating gastric function. Annu Rev Physiol. 2006;68:279–305. doi: 10.1146/annurev.physiol.68.040504.094635. [DOI] [PMC free article] [PubMed] [Google Scholar]
- Zhang W, Carreño FR, Cunningham JT, Mifflin SW. Chronic sustained hypoxia enhances both evoked EPSCs and norepinephrine inhibition of glutamatergic afferent inputs in the nucleus of the solitary tract. J Neurosci. 2009;29:3093–3102. doi: 10.1523/JNEUROSCI.2648-08.2009. [DOI] [PMC free article] [PubMed] [Google Scholar]