

Abstract
Inhibitory connectivity onto neocortical pyramidal cells was mapped using LSPS (laser-scanning photostimulation/glutamate uncaging). The average onset latency of IPSCs was shorter than that of EPSCs recorded in the same cells, indicating a specific mechanism for rapid network recruitment of inhibition. The majority of strong inhibitory synaptic inputs originated within 300 μm of the recorded cell's soma, had onset latencies between 4 and 10 ms, and high amplitude [short-latency IPSCs (slIPSCs)]. slIPSCs were GABAA receptor- mediated chloride currents that were evoked in an all-or-none manner. We tested whether slIPSCs resulted from somatic depolarization of presynaptic interneurons or from direct excitation of inhibitory presynaptic terminals via kainate receptors. Our evidence supports the former hypothesis: (1) slIPSCs had similar sensitivity to kainate and AMPA receptor blockers as electrically evoked EPSCs. (2) slIPSCs frequently had an notched rising phase suggestive of summated IPSCs resulting from repetitive firing of presynaptic neurons. (3) Latencies and interevent intervals were consistent with spike latencies and interspike intervals in fast-spiking (FS) interneurons. (4) slIPSCs were frequently evoked at spots where the recorded cell was also excited directly, but ∼15% of spots from which slIPSCs were evoked did not overlap with the recorded neuron's cell body. We propose that slIPSCs from FS interneurons represent a pool of powerful inhibitory signals that can be recruited by local excitation. Because of their magnitude, progressive recruitment, and short latency, slIPSCs are a effective mechanism of regulating excitability in neocortical circuits.
Introduction
Neocortical GABAergic interneurons shape network activity and information processing by providing feedforward and feedback inhibition onto principal neurons and onto themselves. They comprise a range of subtypes that can be discriminated on the basis of their morphology, electrophysiological properties, and marker protein expression (Markram et al., 2004; Bacci et al., 2005; Yuste, 2005; Wonders and Anderson, 2006). Arguably, the most profound distinction is drawn between fast-spiking (FS) and non-FS interneurons. FS interneurons, i.e., basket and chandelier cells, have high maximal firing rates (>200 Hz), synapse onto the soma and proximal dendrites (basket cells) (Marin-Padilla, 1972) or axon initial segments (chandelier cells) (Somogyi, 1977) of pyramidal neurons, and express the calcium-binding protein parvalbumin. The perisomatic or axonal inhibition exerted puts them in a position to exercise powerful control over pyramidal cell output and synchronization (Freund and Katona, 2007). Interneurons and pyramidal neurons receive both excitatory and inhibitory input. Whereas pyramidal cells are believed to be targeted by virtually all interneuron types and vice versa, interneurons preferentially target other interneurons of the same types through electrical and to a lesser extent chemical synapses (Gibson et al., 1999; Beierlein et al., 2000; Galarreta and Hestrin, 2002; Bacci et al., 2005).
Laser-scanning photostimulation/glutamate uncaging (LSPS) is a powerful technique to investigate connectivity of different types of neurons. Release of glutamate onto neuronal somata can cause suprathreshold depolarization (via direct activation of somatic glutamate receptors) and action potential generation, such that the location and laminar origin of presynaptic neurons can be determined. Studies using LSPS have revealed that excitatory and inhibitory neocortical connections display great laminar target sensitivity. For example, Dantzker and Callaway (2000) have shown that in rat somatosensory cortex, pyramidal cells and FS interneurons in layer 2/3 receive excitatory input mainly from layer 4/5a, whereas other interneuronal classes received the majority of inputs from layer 5b or 2. Different types of interneurons in layer 2/3 of mouse somatosensory cortex display strikingly different excitatory and inhibitory input maps (Xu and Callaway, 2009). In rat barrel cortex, layer 4 sends excitatory projections to layer 2/3 barrel cells, whereas layer 5a projects to cells in the septa between barrels (Shepherd and Svoboda, 2005). Layer 4 stellate cells receive excitatory input from within layer 4 in the same barrel, whereas layer 4 pyramidal cells receive significant excitatory inputs from infragranular layers. However, both cell types receive mainly intralaminar inhibitory inputs (Schubert et al., 2003).
In this study, we examine inhibitory connectivity in rat somatosensory cortex. We found that distinct patterns of connectivity can be distinguished when IPSCs are sorted according to their onset latency. We present several lines of evidence showing that under our experimental conditions, short-latency (<10 ms) IPSCs predominantly represent input from FS interneurons, and that ISPC latencies of as little as 3.2 ms are consistent with somatic depolarization and action potential generation in the presynaptic interneuron. Thus, short-latency IPSPs mediated by FS interneurons represent a powerful and rapidly recruited means of regulating neocortical excitability.
Materials and Methods
Slice preparation.
All experiments were performed according to protocols approved by the Stanford Institutional Animal Care and Use Committee. Sprague Dawley rats aged postnatal day (P) 16 to P20 were deeply anesthetized using 50 mg/kg sodium pentobarbital, and brains were removed and immediately transferred to ice-cold sucrose solution containing (in mm) 234 sucrose, 11 glucose, 24 NaHCO3, 2.5 KCl, 1.25 NaH2PO4, 2 MgSO4, and 0.5 CaCl2, equilibrated with a 95–5% mixture of O2 and CO2. Coronal neocortical slices (350–400 μm) were sectioned on a VT 1000S Vibratome (Leica) at 4°C in sucrose solution and transferred into a holding chamber filled with artificial CSF [ACSF (in mm): 126 NaCl, 26 NaHCO3, 2.5 KCl, 1.25 NaH3PO4, 2 CaCl2, 2 MgCl2, 10 glucose, equilibrated with 95% O2/5% CO2, pH 7.4]. After a recovery period of 1 h at 32°C, the holding chamber containing the slices was removed from the water bath and allowed to cool to room temperature.
Focal photolysis of caged glutamate/laser-scanning photostimulation.
Focal photolysis of caged glutamate was performed as described previously (Deleuze and Huguenard, 2006; Jin et al., 2006; Kumar et al., 2007). A pulsed 355 nm UV laser beam (DPSS Lasers) was directed into the back aperture of the 5 or 63× microscope objective and was controlled with mirror galvanometers (Model 6210; Cambridge Technology) using a locally developed software program. Focal photolysis of 4-methoxy-7-nitroindolinyl (MNI)-caged glutamate (Tocris; 100 μm) was triggered by 10–50 mW UV light pulses (300–800 μs). MNI-caged glutamate was supplied in a 30 ml recirculating bath solution. Typically, the bath solution was exchanged after 3–4 h, or sooner if significant rundown of direct responses was detected (see below). Determination of uncaging beam half width was determined by scanning the beam in 1 μm steps through the objective and measuring power via a UV sensitive light meter (Newport Power Meter Model 1815-C with Model 818-UV probe), which was obscured by a straight-edged razor blade placed at right angles to the scanning path. As the beam was stepped so that it became less progressively obscured by the blade, the light meter recorded increasing powers reflecting the integrated power of the entire beam. This cumulative power versus beam position curve was then differentiated to obtain a Gaussian curve from which the half width was determined.
Electrophysiological recordings.
Slices were transferred to a recording chamber and constantly superfused with oxygenated ACSF at a rate of ∼2 ml/min. Experiments were conducted at room temperature (23−25°C), all cells recorded were located in primary somatosensory cortex in limb and trunk areas. Cortical layers were identified visually from an overview image at 5× magnification, and neurons were visualized at 63× magnification using differential contrast optics with an Axioskop 2 FS microscope (Zeiss). Pyramidal cells were identified based on their larger size, tear-shaped morphology, and thick apical dendrite. Cells were routinely filled with 0.3% w/v biocytin for postrecording recovery to confirm their identity. Whole-cell recordings were obtained using borosilicate glass electrodes with a tip resistance of 2–4 MΩ. The pipette solution used for connectivity mapping contained (in mm) 130 Cs-gluconate, 8 CsCl, 10 HEPES, 4 EGTA, and 0.01 QX314 [N-(2,6-dimethylphenylcarbamoylmethyl) triethylammonium bromide], pH 7.3 adjusted with CsOH (290 mOsm). For all current-clamp recordings, the following internal solution was used (in mm): 120 K-gluconate, 11 KCl, 1 MgCl2, 1 CaCl2, 10 HEPES, 10 EGTA, pH 7.3 adjusted with KOH. NMDA receptor-mediated currents were blocked by 50 μm d-AP5 (Ascent Scientific). Either pipette solution was used for cell-attached recordings. Only recordings in which the series resistance was <25 MΩ and changed <30% during the recording were included in the data analysis, and no series resistance compensation was used. Membrane potentials were corrected for a liquid junction potential of 20 mV, and all voltages given subsequently include liquid junction potential correction. Signals were amplified with a Multiclamp 700A amplifier, sampled at 10 kHz (whole-cell recordings), filtered at 3 kHz, acquired using a Digidata 1320A digitizer, and analyzed using pClamp9 (all Molecular Devices). Cell-attached recordings were sampled at 50 kHz. Action potential waveforms resemble the inverted first derivative of the membrane potential, starting with a negative deflection and ending with a positive deflection. Action potential onset was determined to be the visually identified onset of the negative deflection, and the end was defined as 90% decay time of the positive deflection (after the later “bump” for non-FS interneurons). Kainate and AMPA receptor blockers (UBP301 and GYKI-52466, both Tocris, 50 μm each; and UBP302, Tocris, 30 μm) were applied in the bath solution. EPSCs were evoked by electrical stimulation using a concentric bipolar electrode (CB-XRC75, Frederick-Haer), and short-latency IPSCs (slIPSCs) were evoked by repeated glutamate uncaging at a given location. Events were evoked every 20–30 s. We typically recorded evoked PSCs during a 5–10 min control period, applied the blocker for 5 min, and then washed for 10–15 min. For quantification of PSC amplitudes, the last 6–10 events from each period were used. To account for potential time-dependent rundown of responses, “control” amplitudes for statistical analyses were calculated by averaging amplitudes measured during the initial control period and the end of the wash period. All recordings were performed in the presence of 50 μm d-APV (Ascent Scientific).
Synaptic input maps.
Maps consisted of 143–182 points spanning all cortical layers with a grid spacing of 90–100 μm. Points were stimulated in a pseudo-random pattern, designed to minimize sequential activation of adjacent grid points, with 5 s between stimuli. Typically, two maps were recorded at a holding potential of −65 mV to isolate EPSC input, where GABAergic activation results in small outward currents which do not interfere with the detection of the much larger inward glutamatergic currents. Subsequently, two maps were recorded at −5 mV, close to the cation equilibrium potential, to isolate IPSCs. At −5 mV, glutamatergic activation results in small inward currents which can be readily distinguished from outward GABAergic currents. In this way, direct excitation and synaptic inhibition could be simultaneously monitored in the same map. Direct glutamatergic currents are recorded when glutamate is released onto the cell body. These responses consistently have an onset latency of <3 ms and were distinguished from EPSCs on that basis. We excluded sweeps in which direct activation exceeded 100 pA, such that it would interfere with detection of synaptic responses. To construct maps, we determined the cumulative amplitude of PSCs with onset latencies of 5–50 ms (EPSCs) and 2–50 ms (IPSCs) after the stimulus for each sweep. The cumulative amplitude is the sum of the amplitudes of all EPSCs recorded within the detection time window, and therefore represents a compound measure of event frequency and amplitude. We used a relatively short time window to avoid confounding effects of polysynaptic activation, whose contribution to overall synaptic responses were additionally minimized by blockade of NMDA receptors. PSCs were detected using locally written software, and validated by visual examination of raw traces. We then corrected the cumulative amplitude for the expected spontaneous activity in the equivalent time window. When two maps using the same grid were recorded, they were averaged.
Statistics.
Data are given as average ± SEM. Statistical comparisons between two groups were calculated using Student's t tests, with p values <0.05 indicating significance. Paired t tests were used to analyze the results shown in Figures 2 D, 3 E, and 5 C; other comparisons were done using unpaired t tests. Comparisons between three groups were done using ANOVA followed by Tukey's honestly significant difference post test.
Figure 2.

slIPCs and rIPSC in layer 2/3 and layer 5 pyramidal cells. A, Input maps for slIPSCs (left panels) and rIPSCs (right panels) in eight layer 2/3 (A1) and seven layer 5 (A2) pyramidal cells. Cumulative IPSC amplitudes in individual input maps were averaged, and contour lines were derived by linear interpolation. Individual maps were rotated so that pia was oriented horizontally and aligned to the position of the soma on the x- and y-axes. The color scale represents weak to strong (blue to red) inputs. Pink represents activation above the highest level of the regular color scale to emphasize the weaker input patterns. B, Averaged inputs for 100 μm rows for slIPSC (black circles) and rISPC (open circles) cells in layer 2/3 (B1) and layer 5 (B2). C, Averaged inputs for 100 μm columns for slIPSC (black circles) and rISPC (open circles) cells in layer 2/3 (C1) and layer 5 (C2), fitted to Gaussian distributions. Fits for rIPSCs have lower amplitudes (layer 2/3; rIPSCs: 1.17; slIPSCs: 4.21. Layer 5; rIPSCs: 1.77; slIPSCs: 4.90) but larger half widths (layer 2/3; rIPSCs: 285 ± 46 μm; slIPSCs: 177 ± 19 μm. Layer 5; rIPSCs: 406 ± 54 μm; slIPSCs: 220 ± 21 μm). D, Average cumulative slIPSC and rIPSC amplitude evoked from each spot within 200 μm of each cell's soma. slISPC input (“short”) was significantly larger than rIPSC input (“reg.”) in layer 2/3 (D1) and layer 5 (D2) cells.
Figure 3.

Inhibitory input maps to FS and non-Fs interneurons. A, Left, Cell-type identification. Cell-attached recordings of action potentials evoked by glutamate uncaging onto somata of layer 5 cells. Three examples each from pyramidal cells (top left), non-FS interneurons (center left), and FS interneurons (bottom left). Right, Response to hyperpolarizing (−200 pA) and depolarizing (+200 pA) current injections in the three cell types, used to validate the identification method. Intracellular recordings are from the same cells as the third extracellularly recorded action potential in each row. B, Duration (see Materials and Methods) of each extracellularly recorded action potential versus the ratio of the maximum positive to maximum negative deflection. Neuronal types mostly segregate into distinct clusters. For additional identification, we used the presence of a pronounced secondary “bump” in the positive deflection (characteristic of non-FS interneurons) and morphology (to distinguish pyramidal from nonpyramidal cells). C, Input maps for slIPSCs (left panels) and rIPSCs (right panels) in four FS interneurons (C1) and eight non-FS interneurons (C2) in layer 5. Cumulative IPSC amplitudes were analyzed and depicted as in Figure 4. D, Averaged inputs for 100 μm rows for slIPSC (black circles) and rISPC (open circles) cells in FS interneurons (D1) and non-FS interneurons (D2). Non-FS interneurons received inputs from a much wider range of cortical lamina than FS cells, which tend to receive input mainly from cells in the same layer (V). E, Average cumulative slIPSC and rIPSC amplitude evoked from each spot within a 200 μm of each cell's soma. slISPC input was similar to rIPSC input in FS interneurons (E1), but non-FS interneurons received significantly less slIPSC than rIPSC input (E2).
Figure 5.

Kainate and AMPA receptor blockade. A, Individual example traces demonstrating the effect of 50 μm UBP301 (A1), 30 μm UBP302 (A2), and 50 μm GYKI-52466 (A3) on slIPSCs (top row) and electrically evoked EPSCs (bottom row). The traces in each row were recorded during the control period (left), in the presence of the blocker (middle), and toward the end of the wash (right). UBP301 and GYKI-52466 decreased slIPSc and EPSC amplitudes, whereas UBP302 did not. B, Time course of UBP301 (B1), UBP302 (B2), and GYKI-52466 (B3) action. slIPSCs (black circles) and EPSC (open triangles) amplitudes for the recordings from which the example traces in A were taken. C, Effects of UBP301 (C1), UBP302 (C2), and GYKI-52466 (GYKI; C3) on the amplitudes of slIPSCs (left panels) and EPSCs (right panels). UBP301 and GYKI-52466 reversibly reduced PSC amplitudes in each cell tested. Summary data in bottom panels shows normalized slIPSC and EPSC amplitudes. Unlike UBP301 and GYKI-52466, UBP302 had no significant effect on slIPSC and EPSC amplitudes.
Results
Inhibitory inputs to pyramidal cells are dominated by short-latency high-amplitude events
We used LSPS to map inhibitory inputs onto layer 2/3 and layer 5 pyramidal cells in primary somatosensory cortex of rats aged P16–P20. Focal photolysis of caged glutamate onto neuronal somata, but not other subcellular compartments, can cause suprathreshold depolarization which elicits synaptic responses in postsynaptic cells. We recorded pyramidal cells in voltage-clamp mode at −5 mV, which is near the cation reversal potential of 0 mV. The chloride reversal potential in our experiments was −68 mV, so that we were able to record IPSCs as large, outward currents. EPSCs and direct activation by LSPS directly onto the recorded cell evoked small inward currents which did not interfere with detection of IPSCs. This enabled us to directly examine inhibitory GABAA receptor-mediated synaptic inputs. Figure 1 A shows recordings from a representative layer 2/3 pyramidal cell. Stimulation in close proximity to the recorded cell's soma resulted in large (>100 pA) outward currents. Figure 1 B shows representative traces from that cell showing events with onset latencies of <10 ms (top) and >10 ms (bottom). The majority of large events had an onset latency of <10 ms.
Figure 1.

slIPSC characterization. A, Individual traces showing LSPS-evoked IPSCs in a layer 2/3 pyramidal neuron. The traces are superimposed on an image of the slice to indicate the approximate location of LSPS for each and the location of the recorded cell's soma (indicated by the pipette tip). The approximate locations of cortical layers 1–6 are indicated on the right. B, Subset of traces from A. The gray box indicates the first 10 ms after the LSPS stimulus. Traces were divided into those with onset latencies <10 ms (top) and >10 ms (bottom) for the first IPSC. Note that all large IPSCs (peak amplitude >20 pA) had an onset latency of <10 ms. The small early onset downward inflection in some traces represents direct currents caused by glutamate release onto the recorded cell's soma. C, Current/voltage relationship of slIPSCs indicating a reversal potential for slIPSCs between −65 and −70 mV. Currents evoked by uncaging glutamate onto the same location at holding potentials of −110, −80, −50, −20, and 10 mV (average of 5 layer 5 pyramidal cells). Example traces are shown on the left; the dotted line indicates the time point at which slIPSC amplitude was measured. The late time point was chosen to ensure that the direct activation had decayed. D, Bath application of 50 μm picrotoxin blocks slIPSCs but not direct activation. Example traces before and after picrotoxin application are shown in left panel; the middle panel shows the time course of slIPS amplitudes for that cell as picrotoxin is washed in. The right panel summarizes slIPSC amplitudes before and after picrotoxin application for 4 layer 5 pyramidal cells. Responses were evoked by repeated glutamate uncaging at the same location, and picrotoxin completely blocked slIPSCs in all cases while not affecting direct glutamatergic currents (left panel, bottom trace). E, Similar experiment as in D but using TTX. TTX (1 μm) completely blocked slIPSCs in all cases (right panel) but left the direct glutamatergic current unaffected (left panel, bottom trace). F, slIPSC amplitudes increase in a stepwise manner with increasing stimulation duration and can be evoked in an all-or-none manner (top panel). Example traces evoked in a layer 5 pyramidal cell by repeated glutamate uncaging at the same location. Middle panel plots the amplitudes of evoked events in that cell by stimuli with different stimulation durations and clearly shows the all-or-none and stepwise nature of slIPSCs. The latency of slIPSc decreased with increasing stimulation intensity (bottom panel). In this example, stimulation duration was positively correlated with slIPSC amplitude and negatively correlated with slIPSC latency (p < 0.0001 for both). Similar responses were obtained in 6 out of 6 cells tested.
Short-latency events are GABAA receptor-mediated synaptic events
We characterized these short-latency, high-amplitude events by repeatedly stimulating a location from which they could be evoked. Current/voltage curves were recorded (n = 5), showing that they were outwardly rectifying and had a reversal potential between −65 and −70 mV, which is around the calculated chloride reversal potential of −68 mV (Fig. 1 C). They were blocked by the GABAA receptor antagonist picrotoxin (50 μm; n = 4), whereas the glutamatergic direct currents evoked concomitantly (since the stimulation sites were close to the recorded cells' soma) were unaffected (Fig. 1 D). Short-latency events were also completely blocked by 1 μm TTX, a blocker of voltage-gated sodium channels, showing that they were action potential dependent (n = 6), whereas the direct glutamatergic inward current was again unaffected (Fig. 1 E). Changing the stimulation intensity by varying the laser pulse duration revealed stepwise increases in event amplitude and all-or-none responses (for an example, see Fig. 1 F, top panel; similar response patterns were seen in 6 out of 6 cells), which are characteristic of synaptically mediated currents. We conclude that the short-latency events are synaptic GABAA receptor-mediated IPSCs (slIPSCs). Event latency decreased with increasing stimulus intensity in all cells analyzed (for an example, see Fig. 1 F, bottom panel), which may reflect the fact that presynaptic cells reach spike threshold faster during stronger glutamatergic activation.
slIPSCs provide the majority of inputs to pyramidal cells and FS interneurons but not non-FS interneurons
LSPS studies commonly quantify only events with an onset latency of >10 ms, and it has been suggested that monosynaptic responses are unlikely to have shorter latencies because of the combined delays of time to reach spike threshold in the presynaptic neuron and subsequent synaptic delay (Dantzker and Callaway, 2000; Jin et al., 2006; Xu and Callaway, 2009). We therefore constructed inhibitory input maps for layer 2/3 (n = 8) and layer 5 (n = 7) pyramidal cells and separated inputs into those with an onset latency of 2–10 ms and 10–50 ms (Fig. 2 A1,A2). The maps depict cumulative inputs, i.e., the sum of the amplitudes of all detected outward events (see Materials and Methods). The inputs to pyramidal cells in both layers with the highest cumulative amplitudes indeed had onset latencies of <10 ms and originated perisomatically. Although IPSCs with onset latencies of >10 ms had significantly smaller cumulative amplitudes, they tended to originate from a wider cortical area—this is especially evident in layer 5 cells, in which we detected significant inputs from supragranular layers (Fig. 2 A2,B2).
We hypothesized that a specific type of interneuron is responsible for short-latency input. Specifically, the perisomatic origin of slIPSCs suggested that they might be mediated by FS interneurons, whose cell bodies are usually located close to that of their postsynaptic partners (and whose synapses mainly target pyramidal cell somata) (Thomson et al., 1996; Tamás et al., 1997; Xiang et al., 2002). FS interneurons in rodent neocortex have a high probability of synapsing onto each other (Gibson et al., 1999; Galarreta and Hestrin, 2002). Therefore, to provide further evidence that slIPSCs might reflect FS cell inputs, we tested whether they might also be observed in postsynaptic FS interneurons. FS and non-fast-spiking (non-FS) interneurons were identified based on their nonpyramidal soma, smaller size, lack of a thick apical dendrite, and the waveform of extracellularly recorded action potentials. As the use of a cesium-based internal solution and the sodium channel blocker QX314 precluded cell identification based on current-clamp spike properties, we recorded action potentials evoked by glutamate uncaging onto the cell's soma in cell-attached mode before acquiring whole-cell configuration (Fig. 3 A). We verified this approach in a separate set of experiments with potassium-based recording solutions by comparing extracellular action potential waveforms to those subsequently obtained via whole-cell current-clamp recordings in the same cells. FS and non-FS interneurons had significantly different action potential waveforms. FS interneurons had briefer spike durations than either pyramidal cells or non-FS interneurons (FS: 1.15 ± 0.07 ms, n = 14; non-FS: 2.16 ± 0.18 ms, n = 13; pyramidal: 3.69 ± 0.32, n = 14, p < 0.01 for all comparisons, ANOVA). The quotient of the maximum positive divided by the maximum negative deflection differed in the three cell types (FS: 0.42 ± 0.02 ms, n = 14; non-FS: 0.25 ± 0.02 ms, n = 13; pyramidal: 0.15 ± 0.01, n = 14, p < 0.01 for all comparisons, ANOVA). Additionally, non-FS interneurons had a characteristic secondary “bump” in the positive deflection, which was used as a third component in cell classification. The “bump” was not investigated in more detail but probably reflects complex spike repolarization because of sequential activation of multiple types of potassium channels. Taking these characteristics together, we were able to classify >90% of all neurons as pyramidal, FS, or non-FS (Fig. 3 B). We recorded inhibitory synaptic input maps from 12 interneurons (4 FS, 8 non-FS) and analyzed them based on IPSC latencies as we had done for pyramidal cells. FS interneurons, like pyramidal cells, received strong inhibitory inputs within the first 10 ms, and nearly all IPSCs originated within a 250 μm radius surrounding the soma, indicating that presynaptic cell bodies were located near the recorded cell and likely extended only a short axonal projection to it (Fig. 3 C1). These input maps are in qualitative agreement with those reported for FS interneurons in layer 2/3 of mouse somatosensory cortex (Xu and Callaway, 2009). Non-FS interneurons, however, received both short and regular latency IPSCs from a much wider cortical area spanning layers 2–6, and most inputs had latencies of >10 ms (Fig. 3 C2). Consistent with the heterogeneous nature of non-FS interneurons (Markram et al., 2004; Wonders and Anderson, 2006; Xu and Callaway, 2009), we found two distinct types of excitatory input maps onto non-FS cells (supplemental Fig. 1, available at www.jneurosci.org as supplemental material). However, the IPSC input maps did not differ systematically between these two classes of non-FS cells (data not shown).
IPSC onset latencies in pyramidal cells and FS interneurons differ from non-FS interneurons and from EPSC onset latencies in all cell types
Next, we constructed peristimulus time histograms of IPSCs and EPSCs in pyramidal cells, FS interneurons, and non-FS interneurons. Contrary to the synaptic input maps shown in Figures 2 and 3, this analysis considers only the timing of individual events, regardless of their amplitude. Figure 4 A shows example IPSC traces of a layer 5 pyramidal cell, an FS interneuron, and a non-FS interneuron, suggesting longer onset latencies in the non-FS interneuron. The quantification of IPSCs in all neurons of the specific subtype confirmed this (Fig. 4 B,D): The peak IPSC onset latencies in pyramidal cells and FS interneurons were 6.61 and 5.42 ms, respectively, compared with 10.17 ms in non-FS interneurons. Peak EPSC latencies were similar in all three neuronal types (pyramidal: 11.36 ms, non-FS: 12.54 ms, and FS: 11.95 ms) (Fig. 4 C,E). Thus, although there were no pronounced differences in EPSC latencies in the three cell types, IPSCs had shorter latencies in pyramidal cells and FS interneurons compared with non-FS interneurons. This suggests that PSC latency distributions are governed largely by properties of the presynaptic neurons, and more specifically, that FS interneurons and pyramidal neurons receive a large proportion of inhibitory inputs from a common class of interneurons.
Figure 4.

PSC peristimulus time histograms. A, Examples of LSPS-evoked ISPCs in a pyramidal cell (top), an FS interneuron (center), and a non-FS interneuron (bottom), all in layer 5. Stimulus time is indicated with a dotted line. B, Left, Histograms depicting the number of events detected in 19 layer 5 pyramidal cells [summary combining 7 cells from this study and 12 control cells from another study (our unpublished observations), top] 4 FS interneurons (center), and 8 non-FS interneurons (bottom). Black lines indicate fits to the following equation (the “pulse” function in Origin 7): y = y 0 + A(1 − e −(x − x0)/t1)p * e −( x − x 0)/t 2, where y 0, y-offset (background); x 0, center; A, amplitude; p, power; t 1 and t 2, decay constants. Fits were used to calculate times of peak number of evoked events (PYR, 6.61 ms; FS, 5.42 ms; non-FS, 10.17 ms). C, Same as B, but for EPSC latencies. Note that the events from 0 to 4 ms correspond to direct activation of the recorded cell. They were truncated for clarity and excluded for the “pulse” fits. Peak number of events are similar in the three cell types and occur later than for IPSCs (PYR: 11.36 ms, FS: 11.95 ms, non-FS: 12.54 ms). D, Cumulative fraction of evoked IPSCs in pyramidal cells (black line), FS (light gray line), and non-FS (dark gray line) interneurons from data in B from 4 to 100 ms after LSPS stimulus. Number of events per millisecond was baseline corrected by subtracting the average number of events per millisecond in the 100 ms preceding the LSPS stimulus. IPSCs in non-FS interneurons occur later than in the other two cell types–median IPSC latency: PYR, 16 ms; FS, 19 ms; non-FS, 30 ms. E, Same as D, but for EPSCs. There were no consistent differences in median EPSC latency between the three cell types (PYR, 18 ms; FS, 17 ms; non-FS, 20 ms).
Are slIPSCs elicited by somatic or presynaptic excitation?
Inhibitory presynaptic terminals can express kainate receptors (Clarke et al., 1997; Jiang et al., 2001; Kang et al., 2004; Jin and Smith, 2007; Ren et al., 2007) that might be activated by LSPS. A recent report indicates that layer 2/3 pyramidal cells target such kainate receptors on presynaptic terminals of FS to pyramidal cell synapses. Their activation causes calcium-dependent GABA release, providing a mechanism for rapidly coupling pyramidal cell activity to inhibition in nearby pyramidal cells (Ren et al., 2007). Thus, slIPSCs might result from direct LSPS activation of presynaptic kainate receptors. The facts that slIPSCs have very short latencies and are evoked from locations near the postsynaptic target argue for this possibility. Alternatively, slIPSCs could be caused by somatic depolarization of interneurons, via fast glutamate receptors located on their somata. If slIPSCs were mediated by activation of presynaptic kainate receptors (1) they would be preferentially blocked by kainate receptor preferring antagonists (greater degree of block than would be expected for AMPA receptor-mediated EPSCs); (2) slIPSC latency would be very brief, on the order of that expected for direct terminal depolarization and subsequent synaptic delay (<2 ms total; see Discussion), rather than that expected for FS interneuron depolarization and spike initiation followed by propagation and synaptic delays (see Fig. 8); and (3) they would be evoked together with direct activation of the recorded cell, since the release site must necessarily overlap with the recorded cells' soma.
Figure 8.

Possible scenarios for the origin of slIPSCs. A, “Somatic depolarization.” slIPSC evoked by somatic depolarization of an FS interneuron (gray). Glutamate (G) is released by LSPS leading to action potential generation within 1.15–5 ms, causing release of GABA (g) at an FS to pyramidal cell synapse. The IPSC propagates to the soma of the pyramidal cell (black) where it is recorded. Action potential propagation, synaptic delay, and propagation of the IPSC to the pyramidal cell soma is estimated to take ∼2–5 ms, with ≤1 ms needed for IPSC propagation. According to this model, the minimum latency of IPSCs generated through somatic depolarization would be 3.15 ms. B, “Presynaptic depolarization.” slIPSC evoked by depolarization of the presynaptic terminal. Glutamate is released onto the FS to pyramidal cell synapse and causes calcium-dependent GABA release via activation of presynaptic kainate receptors. We estimated this to take the same time as presynaptic depolarization after action potential invasion and subsequent synaptic delay. The IPSC then propagates to the pyramidal cell soma as in model A. According to this model, the minimum latency of IPSCs generated through direct synaptic depolarization would be 2 ms. The observed peak latency of slIPSCs of 6.61 ms (Fig. 4 B) is in better agreement with somatic depolarization presented in A.
slIPSCs are not preferentially affected by kainate receptor blockade
To test whether slIPSCs were caused by direct glutamate release onto presynaptic kainate receptors on FS interneuron to pyramidal cell synapses, we tested their sensitivity to the selective kainate receptor blocker UBP301 (50 μm) and compared it to the effects on electrically evoked EPSCs. At the concentration used, we expected near complete block of kainate receptors (KD = 5.94 μm) (More et al., 2003). UBP301 has only an ∼30-fold preference for kainate over AMPA receptors (apparent IC50(AMPA) = 164 μm in a neonatal rat spinal cord preparation) (More et al., 2003). Although the precise affinities of this antagonist for synaptic AMPA and kainate receptors in our preparation is not known (because of differences in tissue, age, and preparation, and potential differences in receptor subtype expression), we expected to see a partial blockade of AMPA receptor-mediated responses at the concentrations used. For this reason, we used block of electrically evoked EPSCs in pyramidal cells as a control, as postsynaptic responses are mainly AMPA receptor mediated in rats at the ages used in this study (Ali et al., 2001, 2003; Campbell et al., 2007). If slIPSCs were dependent on kainate receptor activation, they would be attenuated by UBP301 more strongly than EPSCs. Figure 5, A1, B1 and C1, shows results from 5 cells each in which the effect of UBP301 on slIPSCs and EPSCs was assayed. The amplitude of slIPSCs was reduced to 39.4 ± 9.2% of control in the presence of UBP301, and EPSC amplitudes were reduced to similar extent: 36.9 ± 3.6% of control (p < 0.05) (Fig. 5 C1). The moderate degree of PSC block and the similar effect on EPSCs and slIPSCs indicates that slIPSCs are largely independent of kainate receptor activation. Ren et al. (2007) showed immunohistochemically that presynaptic kainate receptors in FS cell to pyramidal cell terminals contain the GluR5 subunit. To specifically test whether GluR5-containing kainate receptors are involved in slIPSC generation, we performed another set of experiments using the GluR5 antagonist UBP302. Unlike UBP301, UBP302 (the active enantiomer of UBP296) exerts no significant block of AMPA receptors (More et al., 2004). UBP302 (30 μm) blocked neither slIPSCs nor electrically evoked EPSCs (Fig. 5 A2,B2,C2). In the presence of UBP302, the average slIPSC amplitude was 93.4% of control (p > 0.5; n = 7), and the average EPSC amplitude was 108.4% of control (p > 0.1; n = 6), indicating that slIPSCs (just like EPSCs) are not dependent on kainate receptors containing the GluR5 subunit.
To further confirm these results, we performed similar experiments using GYKI-52466. This selective AMPA receptor blocker has an ∼30-fold selectivity for AMPA over kainate receptors, with an IC50 ∼20 μm at AMPA receptors and >200 μm at kainate receptors (Paternain et al., 1995; Wilding and Huettner, 1995). EPSC amplitudes were expected to be attenuated by 80–90% in the presence of 50 μm GYKI-52466, and if slIPSCs were dependent on kainate receptor activation, they would be blocked to a much lesser degree. Figure 5 C3 shows that EPSC amplitudes were indeed significantly reduced (22.7 ± 5.2% of control, i.e., in good agreement with the expected values; p < 0.005, n = 4) and that slISPCs were blocked to a slightly larger degree (6.7 ± 1.1% of control; p < 0.01, n = 5) The larger block of slIPSCs compared with EPSCs likely results from a reduction in AMPA receptor- dependent depolarization of presynaptic neurons, such that a large proportion of responses become subthreshold for triggering action potentials. Together, these results show that the pharmacological profile of the glutamatergic component of slIPSCs did not differ significantly from that of EPSCs. Thus, we did not find evidence for a significant involvement of kainate receptors.
FS interneuron spike latencies are consistent with slIPSCs resulting from somatic depolarization
Next, we sought to determine whether slIPSC latencies were consistent with spike latencies of FS interneurons. We obtained cell-attached recordings from FS and non-FS interneurons, and pyramidal cells and recorded action potentials evoked by uncaging glutamate directly onto somata (Fig. 6 A). The stimulation intensities used were similar to those used in mapping experiments (200–600 μs). FS interneurons had significantly shorter spike latencies than non-FS or pyramidal neurons (Fig. 6 C) (FS: 3.13 ± 0.41 ms, n = 18; non-FS: 5.50 ± 0.61 ms, n = 42; pyramidal: 7.69 ± 0.66, n = 19; FS vs non-FS: p < 0.05; FS vs PYR: p < 0.01; PYR vs non-FS: not significant; ANOVA). The shortest recorded spike latencies were 1.15 ms for FS interneurons, 1.50 ms for non-FS interneurons, and 3.2 ms for pyramidal cells (Fig. 6 C). The peristimulus time histograms in Figure 4 indicate that the earliest time at which the number of IPSCs is elevated above background levels is between 4 and 6 ms after the uncaging pulse for all cell types, whereas the EPSCs rises above background levels at a later point in time, between 8 and 10 ms after the photostimulation. Given the minimum observed spike latency in FS interneurons (1.15 ms) and a synaptic and propagation delay of 2–5 ms (see Fig. 8), an IPSC latency of as little as 3.15 ms would be consistent with somatic depolarization of FS interneurons. FS interneuron synapses target the soma or proximal apical dendrite of pyramidal cells, whereas non-FS and pyramidal cell synapses target more distal locations (Thomson et al., 1996; Tamás et al., 1997; Xiang et al., 2002). The resulting shorter IPSC propagation distance would further lead to a shortening of the spike-to-IPSC interval for FS cells.
Figure 6.

Spike latencies and interevent intervals. A, Example traces recorded in cell-attached mode from an FS interneuron (top) and a non-FS interneuron (bottom). Three action potentials each were evoked during glutamate uncaging. The black triangle marks the time of the uncaging stimulus. The intervals between spikes were shorter in the FS interneuron. B, Example traces from whole-cell recordings in pyramidal cells showing event rising phases consisting of single IPSCs (top two traces) and summated individual IPSCs (all others). The dotted gray line indicates the time of the uncaging stimulus. Note that especially at short interevent intervals, it is increasingly difficult to identify individual events (third and forth trace from top, start of individual events are marked by gray arrowheads for clarity). C, Latency to the first action potential evoked by glutamate uncaging onto the somata of pyramidal cells, non-FS interneurons, and FS interneurons. Spikes were recorded in cell-attached mode. D, Interevent intervals for spikes in FS interneurons (dark gray), non-FS interneurons (light gray) and slIPSCs in pyramidal cells (black) in 1 ms bins. Most inter-IPSC intervals fell within the range of interspike intervals recorded in FS interneurons.
In a subset of cells, multiple spikes were evoked by glutamate uncaging (Fig. 6 A). The interspike interval was 4.72 ± 0.40 ms for FS interneurons (n = 7) and 10.77 ± 0.93 ms for non-FS interneurons (n = 8). We also observed that the rising phase of slIPSCs displayed steps, suggesting the summation of asynchronous individual events (see example traces in Fig. 6 B; also evident in Fig. 7). We sought to further explore whether repetitive firing of FS interneurons could account for the stepwise rising phase of slIPSCs. LSPS was performed using the 63× instead of the 5× microscope objective to more tightly focus the region of uncaging and limit (but not necessarily eliminate) the possibility of simultaneously activating multiple presynaptic cells. The histogram in Figure 6 D shows interevent intervals for spikes in FS and non-FS interneurons, and for slIPSCs in pyramidal cells. Seventeen percent of IPSCs (11/62) had intervals of <3.15 ms—the fastest recorded interspike interval—suggesting that they were caused by inputs from two separate presynaptic interneurons. However, 45% (28/62) of inter-ISPC intervals were within the range of interspike intervals in FS interneurons (i.e., 3.15–6.68 ms). This suggests that a significant proportion of individual composite slIPSCs result from repetitive spiking of the same presynaptic FS interneuron.
Figure 7.
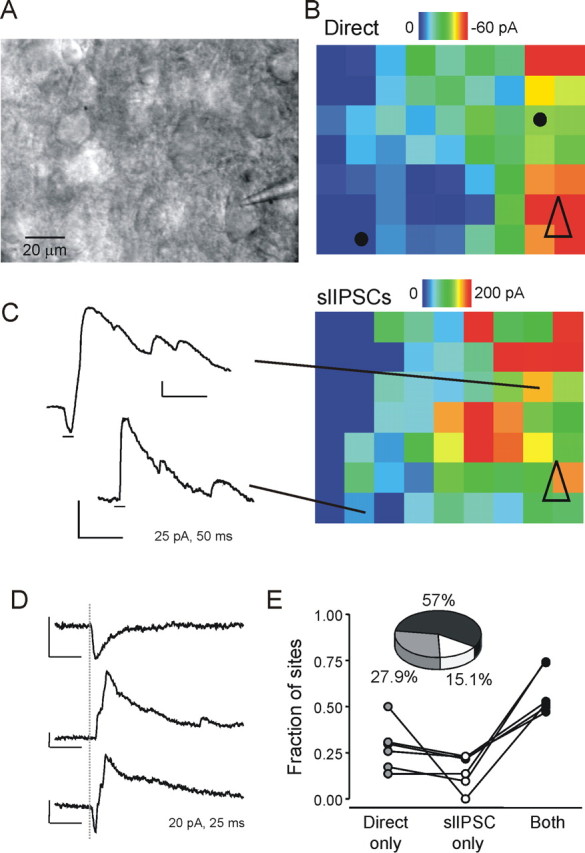
Lack of complete coincidence between direct activation and slIPSCs. A, Image of slice obtained with 63× objective, showing the patch pipette during whole-cell recording from a pyramidal neuron in the lower right-hand corner. B, Map of direct activation (peak negative amplitude within the first 3 ms) from the cell shown in A. Open black triangle indicates position of the soma. Black dots indicate position from which the example traces in C were evoked. C, Right, slIPSc map from the same cell showing the cumulative amplitude of all outward currents with latencies of 2–10 ms. Left, Example traces showing coincident direct activation and slIPSC (top) or slIPSC alone (bottom). Short black lines underneath the traces indicate the first 10 ms after stimulus. D, Another set of example traces from a different cell showing either simple direct activation (top), isolated slIPSCs (center), or coincident activation of both types of events (bottom). Gray dotted line indicates time of laser stimulus. E, Summary data from six maps acquired at high resolution using the 63× objective, showing the proportion of sites from which only direct activation, only slIPSCs or both types of activation were evoked.
slIPSCs are not always associated with concurrent direct activation
“High-resolution” maps acquired using the 63× microscope objective, with grid spacings of 10–15 μm, were used to determine how frequently slIPSCs and direct excitation were evoked from the same spot. An example map is shown in Figure 7. The maps depicting direct activation (inward current with latency of <3 ms) (Fig. 7 B) and slIPSCs (Fig. 7 C) show that the two types of activation generally exhibited overlapping patterns. However, there were instances in which slIPSCs were evoked at sites without direct excitation (see example trace Fig. 7 C). Figure 7 D shows more examples of the three types of excitation, direct only (top), slIPSC only (middle), and both (bottom). The summary data for maps from 6 layer 5 pyramidal neurons shows that slIPSC and direct activation coincided at 57% of stimulation sites, whereas direct activation alone occurred at nearly 28% of sites, and stimulation at 15% of sites resulted in slIPSCs only (Fig. 7 E). This would be incompatible with direct presynaptic terminal activation, which would necessarily also directly activate the postsynaptic cell.
Discussion
In this study, we investigated GABAA receptor-mediated inputs evoked by LSPS in neocortical pyramidal cells, FS, and non-FS interneurons. In pyramidal cells, the strongest LSPS-evoked IPSCs had a latency of <10 ms and originated within a 300 μm radius of the recorded cell. IPSCs with longer latencies originated from essentially all cortical lamina. Distinct patterns were seen for LSPS-evoked IPSCs in two different classes of interneurons: inputs onto FS interneurons originated mostly from sites close to the recorded cell's soma and tended to have short latencies, whereas IPSCs in non-FS interneurons had longer latencies and came from all cortical lamina. FS interneurons have a high connection probability with other FS interneurons (Gibson et al., 1999; Bacci et al., 2005). Thus, the similarity in IPSC latencies and sites of origin in FS interneurons and pyramidal cells suggests that slIPSCs in pyramidal cells mainly reflect FS to pyramidal cell connections.
IPSC latencies in pyramidal cells were shorter than EPSC latencies, leading us to test the hypothesis that LSPS-evoked slIPSCs result from activation of kainate receptors on inhibitory presynaptic terminals. Such receptors modulate IPSCs at a number of central synapses. This can lead to facilitation (Jiang et al., 2001; Kang et al., 2004; Ren et al., 2007) or inhibition (Clarke et al., 1997; Ali et al., 2001; Jin and Smith, 2007) of GABAergic neurotransmission. For example, activation of presynaptic kainate receptors on striatopallidal synapses inhibits GABA release via a PKC-dependent mechanism (Jin and Smith, 2007). However, presynaptic kainate receptors on inhibitory terminals onto neocortical pyramidal cells can, when activated by glutamate released from another pyramidal cell, induce pyramidal to pyramidal cell inhibition (Ren et al., 2007). At these synapses calcium influx through kainate receptors results in calcium-dependent calcium release from intracellular stores (Mathew and Hablitz, 2008). The short onset latencies of slIPSCs and their perisomatic region of origin would appear to support the hypothesis that glutamate release via LSPS directly activates kainate receptors on inhibitory presynaptic terminals onto pyramidal cells, causing GABA release. Alternatively, slIPSCs could arise in essentially the same way that LSPS-evoked EPSCs do: by somatic depolarization (in this case of interneurons), action potential generation, and subsequent neurotransmitter release. Last, action potential generation in pyramidal cells could lead to glutamate release and activation of presynaptic kainate receptors, leading to IPSCs in the recorded pyramidal cell, essentially as in the paired recordings described by Ren et al. (2007). The onset latency (significantly shorter than for LSPS-evoked pyramidal to pyramidal cell EPSCs) strongly argues against the last possibility, as does the average failure rate of pyramidal to pyramidal cell inhibition of ∼10% (Ren et al., 2007). Although our approach did not allow us to ascertain whether action potentials were actually generated, we observed essentially no failures in cells in which we repeatedly evoked slIPSCs from the same spot.
The data we present support a model of somatic depolarization and spike generation of interneurons rather than presynaptic depolarization (depolarization of presynaptic terminals). For one, slIPSCs were no more sensitive to kainate receptor blockade than electrically evoked synaptic EPSCs (Fig. 5). Since EPSCs are AMPA receptor mediated (see Results), slIPSCs appear to be, too. Second, slIPSC latency is in better agreement with somatic depolarization of FS interneurons. The schema in Figure 8 summarizes the possible scenarios and the resulting expected latencies. Somatic depolarization of the presynaptic FS neuron is depicted in Figure 8 A. As shown in this study, glutamate release onto an FS cell's soma leads to suprathreshold depolarization and action potential generation with latencies of as little as 1.15 ms—90% of FS interneurons generated the first spike between 1.2 and 5 ms after LSPS. Thus, we applied an estimate of 1.15–5 ms for the latency to spike. Based on latencies of electrically evoked synaptic responses, we used an estimate of 2–5 ms for action potential propagation to the synapse, synaptic delay, and propagation of the IPSC to the soma of the recorded cell. A maximum of 1 ms of this time is likely needed for PSC propagation to the recorded cell's soma: according to previous studies (Schubert et al., 2001; Brill and Huguenard, 2008), the propagation delay of direct responses evoked by LSPS in pyramidal cell dendrites within 100 μm from the soma is ≤1 ms. FS cells synapse onto the soma or proximal dendrite of pyramidal cells; therefore, IPSCs propagation distance will be short. Based on these results, we expect IPSCs resulting from somatic depolarization of FS interneurons to have average latencies of 3.15–10 ms. Presynaptic depolarization (Fig. 8 B) omits somatic depolarization and spike propagation to the synapse, but retains synaptic delay and PSC propagation to the recorded cell's soma. We assumed that depolarization resulting from kainate receptor activation has a similar time course than presynaptic depolarization during action potential invasion. Thus, presynaptic depolarization will result in shorter average IPSC latencies of 2–5 ms. The peak of the slIPSC latency distribution was 6.61 ms (Fig. 4 B), and is therefore in better agreement with the scenario of somatic depolarization. In contrast, the calculated latency for events evoked by presynaptic depolarization is in good agreement with the latency of 2–3 ms reported by Ren et al. (2007). We thus conclude that onset latencies of slIPSCs are consistent with somatic depolarization of FS interneurons rather than depolarization of presynaptic terminals.
In addition, slIPSCs were not necessarily evoked together with direct glutamatergic activation of the postsynaptic cell. If slIPScs were caused by activation of kainate receptors on interneuron to pyramidal synaptic terminals and given an estimated uncaging half width of 20 μm when the laser pulse is delivered through the 63× objective (see Materials and Methods), LSPS at such locations would necessarily cause glutamate release onto significant portions of the dendritic compartment of the recorded cell, which would produce significant direct activation of the postsynaptic cell. This is inconsistent with the failure to coactivate both presynaptic and postsynaptic responses from as many as 15% of uncaging sites (Fig. 7).
Other indirect evidence also argues against kainate receptor-dependent GABA release: the interval between individual components of summated slIPSCs is consistent with the interspike intervals of FS interneurons. Although we cannot rule out that summated IPSC components are caused by asynchronous activation of more than one presynaptic cell, the close correspondence of interevent and interspike intervals strongly suggests that a large proportion in fact arises from repeated firing of single presynaptic FS interneurons, which is a common occurrence with our LSPS protocol (Fig. 6 A). We also show that slIPSCs were dependent on voltage-gated sodium channels, i.e., they were blocked by TTX. However, Mathew and Hablitz (2008) demonstrated that kainate receptor-dependent GABA release occurs via calcium-dependent calcium release from intracellular stores and is not dependent on action potentials. In fact, the frequency of action potential independent IPSCs in pyramidal cells was increased in the presence of kainate.
In summary, LSPS does not evoke detectable GABA release via activation of presynaptic kainate receptors. We have shown previously that LSPS preferentially activates a pool of nonsynaptic glutamate receptors (Brill and Huguenard, 2008). Thus, we speculate that synapses are not as readily accessible to exogenously released glutamate as the extrasynaptic compartment, probably because they are effectively shielded from the extrasynaptic environment by astrocytes (Oliet et al., 2001; Syková, 2004). This might explain why we did not observe pyramidal cell inhibition mediated by presynaptic kainate receptors on inhibitory terminals, as described by Ren et al. (2007). In addition, we cannot exclude the possibility that presynaptic kainate receptor-mediated inhibition is less prevalent rat somatosensory cortex (used in this study) than in mouse visual cortex [used in the study by Ren et al. (2007)].
Other studies on inhibitory input maps (Dantzker and Callaway, 2000; Kumar et al., 2007; Xu and Callaway, 2009) have used detection windows starting 10 ms after laser stimulus, to avoid including kainate receptor evoked inhibition during LSPS stimulation of presynaptic terminals, but our results suggest that a significant proportion of inhibitory events occur with latencies <10 ms.
The distinction between two types (from presumptive FS vs non-FS interneurons) of input based on latency alone is not absolute. Studies using paired recordings have shown that FS interneuron onto pyramidal cell IPSCs are significantly larger than non-FS onto pyramidal cell IPSCs (Xiang et al., 2002; Yoshimura and Callaway, 2005). This will bias the analysis of LSPS data toward detection of FS interneuron mediated IPSCs. We should also caution that the latency criteria would favor detection of perisomatic inputs, since inputs from more distally localized synapses will have a longer propagation delay. However, dividing LSPS-evoked EPSCs into short and long latency inputs resulted in essentially identical maps (data not shown), suggesting that IPSC latencies indeed reveal inputs from different interneuronal classes.
Pyramidal cells, FS interneurons, and non-FS interneurons had distinct spikes latencies when activated by somatically targeted LSPS. Under physiological conditions, neurons integrate synaptic input that typically arrives within the dendritic compartment, and our experiments do not reveal how efficiently this integration proceeds in the three types of neurons. However, it does suggest that similar degrees of somatic depolarization lead to more rapid spike generation in FS interneurons. In this context, it should be pointed out that maximal direct currents evoked by LSPS onto the soma during mapping of inhibitory inputs did not differ significantly in FS and non-FS cells (FS: 606 ± 56 pA, n = 4; non-FS: 650 ± 87 pA, n = 11). Mechanisms for the accelerated excitation-spike coupling in FS interneurons may include expression and kinetics of sodium and potassium channel subunits (Martina and Jonas, 1997; Martina et al., 1998). The fast excitation-spike coupling is also in agreement with the role of FS interneurons in the generation of gamma oscillations (Bartos et al., 2007).
The division of interneurons into FS and non-FS is a simplification. FS interneurons are subdivided into basket cells, which can be subdivided further mainly based on their morphology (Markram et al., 2004) and chandelier cells (Szentágothai and Arbib, 1974). FS interneuron somata are usually located close to the somata of their postsynaptic partners (Yoshimura and Callaway, 2005), although long-range FS to pyramidal cell connections exist (Somogyi et al., 1983). A major difference between basket and chandelier cells is that the former target pyramidal cell somata and proximal dendrites (Marin-Padilla, 1972), whereas the latter target axons initial segments (Somogyi, 1977). Chandelier cells only comprise a small proportion of FS interneurons (Markram et al., 2004), and thus likely do not represent a major source of slIPSC input. The axon initial segment of pyramidal cells has a depolarized chloride reversal potential (Khirug et al., 2008); therefore, chandelier cell to pyramidal cell IPSCs can be depolarizing, and lead to long-lasting network activation (Szabadics et al., 2006; Molnár et al., 2008). To understand the network consequences of slIPSCs, it will be important to determine whether or not a significant proportion is mediated by chandelier cell activation.
In summary, we show that the strength and origin of IPSCs correlates with their onset latency, and that short-latency IPSCs are mainly mediated by FS interneurons. We thus demonstrate the feasibility of LSPS in qualitatively distinguishing cell type specific inputs. Establishing cell type specific input maps and investigating factors contributing to the dynamics of neuronal activity (such as the fact that FS interneurons reach spike threshold significantly faster than pyramidal cells) are crucial to understanding neuronal circuits and the output of cortical networks.
Footnotes
This work was supported by National Institute of Neurological Disorders and Stroke Grant NS12151 (J.R.H.) and an American Epilepsy Society postdoctoral fellowship (J.B.).
References
- Ali AB. Involvement of post-synaptic kainate receptors during synaptic transmission between unitary connections in rat neocortex. Eur J Neurosci. 2003;17:2344–2350. doi: 10.1046/j.1460-9568.2003.02677.x. [DOI] [PubMed] [Google Scholar]
- Ali AB, Rossier J, Staiger JF, Audinat E. Kainate receptors regulate unitary IPSCs elicited in pyramidal cells by fast-spiking interneurons in the neocortex. J Neurosci. 2001;21:2992–2999. doi: 10.1523/JNEUROSCI.21-09-02992.2001. [DOI] [PMC free article] [PubMed] [Google Scholar]
- Bacci A, Huguenard JR, Prince DA. Modulation of neocortical interneurons: extrinsic influences and exercises in self-control. Trends Neurosci. 2005;28:602–610. doi: 10.1016/j.tins.2005.08.007. [DOI] [PubMed] [Google Scholar]
- Bartos M, Vida I, Jonas P. Synaptic mechanisms of synchronized gamma oscillations in inhibitory interneuron networks. Nat Rev Neurosci. 2007;8:45–56. doi: 10.1038/nrn2044. [DOI] [PubMed] [Google Scholar]
- Beierlein M, Gibson JR, Connors BW. A network of electrically coupled interneurons drives synchronized inhibition in neocortex. Nat Neurosci. 2000;3:904–910. doi: 10.1038/78809. [DOI] [PubMed] [Google Scholar]
- Brill J, Huguenard JR. Sequential changes in AMPA receptor targeting in the developing neocortical excitatory circuit. J Neurosci. 2008;28:13918–13928. doi: 10.1523/JNEUROSCI.3229-08.2008. [DOI] [PMC free article] [PubMed] [Google Scholar]
- Campbell SL, Mathew SS, Hablitz JJ. Pre- and postsynaptic effects of kainate on layer II/III pyramidal cells in rat neocortex. Neuropharmacology. 2007;53:37–47. doi: 10.1016/j.neuropharm.2007.04.008. [DOI] [PMC free article] [PubMed] [Google Scholar]
- Clarke VR, Ballyk BA, Hoo KH, Mandelzys A, Pellizzari A, Bath CP, Thomas J, Sharpe EF, Davies CH, Ornstein PL, Schoepp DD, Kamboj RK, Collingridge GL, Lodge D, Bleakman D. A hippocampal GluR5 kainate receptor regulating inhibitory synaptic transmission. Nature. 1997;389:599–603. doi: 10.1038/39315. [DOI] [PubMed] [Google Scholar]
- Dantzker JL, Callaway EM. Laminar sources of synaptic input to cortical inhibitory interneurons and pyramidal neurons. Nat Neurosci. 2000;3:701–707. doi: 10.1038/76656. [DOI] [PubMed] [Google Scholar]
- Deleuze C, Huguenard JR. Distinct electrical and chemical connectivity maps in the thalamic reticular nucleus: potential roles in synchronization and sensation. J Neurosci. 2006;26:8633–8645. doi: 10.1523/JNEUROSCI.2333-06.2006. [DOI] [PMC free article] [PubMed] [Google Scholar]
- Freund TF, Katona I. Perisomatic inhibition. Neuron. 2007;56:33–42. doi: 10.1016/j.neuron.2007.09.012. [DOI] [PubMed] [Google Scholar]
- Galarreta M, Hestrin S. Electrical and chemical synapses among parvalbumin fast-spiking GABAergic interneurons in adult mouse neocortex. Proc Natl Acad Sci U S A. 2002;99:12438–12443. doi: 10.1073/pnas.192159599. [DOI] [PMC free article] [PubMed] [Google Scholar]
- Gibson JR, Beierlein M, Connors BW. Two networks of electrically coupled inhibitory neurons in neocortex. Nature. 1999;402:75–79. doi: 10.1038/47035. [DOI] [PubMed] [Google Scholar]
- Jiang L, Xu J, Nedergaard M, Kang J. A Kainate receptor increases the efficacy of GABAergic synapses. Neuron. 2001;30:503–513. doi: 10.1016/s0896-6273(01)00298-7. [DOI] [PubMed] [Google Scholar]
- Jin X, Prince DA, Huguenard JR. Enhanced excitatory synaptic connectivity in layer V pyramidal neurons of chronically injured epileptogenic neocortex in rats. J Neurosci. 2006;26:4891–4900. doi: 10.1523/JNEUROSCI.4361-05.2006. [DOI] [PMC free article] [PubMed] [Google Scholar]
- Jin XT, Smith Y. Activation of presynaptic kainate receptors suppresses gabaergic synaptic transmission in the rat globus pallidus. Neuroscience. 2007;149:338–349. doi: 10.1016/j.neuroscience.2007.07.017. [DOI] [PMC free article] [PubMed] [Google Scholar]
- Kang N, Jiang L, He W, Xu J, Nedergaard M, Kang J. Presynaptic inactivation of action potentials and postsynaptic inhibition of GABA(A) currents contribute to KA-induced disinhibition in CA1 pyramidal neurons. J Neurophysiol. 2004;92:873–882. doi: 10.1152/jn.01231.2003. [DOI] [PubMed] [Google Scholar]
- Khirug S, Yamada J, Afzalov R, Voipio J, Khiroug L, Kaila K. GABAergic depolarization of the axon initial segment in cortical principal neurons is caused by the Na-K-2Cl cotransporter NKCC1. J Neurosci. 2008;28:4635–4639. doi: 10.1523/JNEUROSCI.0908-08.2008. [DOI] [PMC free article] [PubMed] [Google Scholar]
- Kumar SS, Jin X, Buckmaster PS, Huguenard JR. Recurrent circuits in layer II of medial entorhinal cortex in a model of temporal lobe epilepsy. J Neurosci. 2007;27:1239–1246. doi: 10.1523/JNEUROSCI.3182-06.2007. [DOI] [PMC free article] [PubMed] [Google Scholar]
- Marin-Padilla M. Double origin of pericellular baskets of pyramidal cells of human motor cortex: a Golgi study. Brain Res. 1972;38:1–12. doi: 10.1016/0006-8993(72)90585-9. [DOI] [PubMed] [Google Scholar]
- Markram H, Toledo-Rodriguez M, Wang Y, Gupta A, Silberberg G, Wu CZ. Interneurons of the neocortical inhibitory system. Nat Rev Neurosci. 2004;5:793–807. doi: 10.1038/nrn1519. [DOI] [PubMed] [Google Scholar]
- Martina M, Jonas P. Functional differences in Na+ channel gating between fast-spiking interneurones and principal neurones of rat hippocampus. J Physiol. 1997;505:593–603. doi: 10.1111/j.1469-7793.1997.593ba.x. [DOI] [PMC free article] [PubMed] [Google Scholar]
- Martina M, Schultz JH, Ehmke H, Monyer H, Jonas P. Functional and molecular differences between voltage-gated K+ channels of fast-spiking interneurons and pyramidal neurons of rat hippocampus. J Neurosci. 1998;18:8111–8125. doi: 10.1523/JNEUROSCI.18-20-08111.1998. [DOI] [PMC free article] [PubMed] [Google Scholar]
- Mathew SS, Hablitz JJ. Calcium release via activation of presynaptic IP3 receptors contributes to kainate-induced IPSC facilitation in rat neocortex. Neuropharmacology. 2008;55:106–116. doi: 10.1016/j.neuropharm.2008.05.005. [DOI] [PMC free article] [PubMed] [Google Scholar]
- Molnár G, Oláh S, Komlósi G, Füle M, Szabadics J, Varga C, Barzó P, Tamás G. Complex events initiated by individual spikes in the human cerebral cortex. PLoS Biol. 2008;6:e222. doi: 10.1371/journal.pbio.0060222. [DOI] [PMC free article] [PubMed] [Google Scholar]
- More JC, Troop HM, Dolman NP, Jane DE. Structural requirements for novel willardiine derivatives acting as AMPA and kainate receptor antagonists. Br J Pharmacol. 2003;138:1093–1100. doi: 10.1038/sj.bjp.0705148. [DOI] [PMC free article] [PubMed] [Google Scholar]
- More JC, Nistico R, Dolman NP, Clarke VR, Alt AJ, Ogden AM, Buelens FP, Troop HM, Kelland EE, Pilato F, Bleakman D, Bortolotto ZA, Collingridge GL, Jane DE. Characterisation of UBP296: a novel, potent and selective kainate receptor antagonist. Neuropharmacology. 2004;47:46–64. doi: 10.1016/j.neuropharm.2004.03.005. [DOI] [PubMed] [Google Scholar]
- Oliet SH, Piet R, Poulain DA. Control of glutamate clearance and synaptic efficacy by glial coverage of neurons. Science. 2001;292:923–926. doi: 10.1126/science.1059162. [DOI] [PubMed] [Google Scholar]
- Paternain AV, Morales M, Lerma J. Selective antagonism of ampa receptors unmasks kainate receptor-mediated responses in hippocampal neurons. Neuron. 1995;14:185–189. doi: 10.1016/0896-6273(95)90253-8. [DOI] [PubMed] [Google Scholar]
- Ren M, Yoshimura Y, Takada N, Horibe S, Komatsu Y. Specialized inhibitory synaptic actions between nearby neocortical pyramidal neurons. Science. 2007;316:758–761. doi: 10.1126/science.1135468. [DOI] [PubMed] [Google Scholar]
- Schubert D, Staiger JF, Cho N, Kötter R, Zilles K, Luhmann HJ. Layer-specific intracolumnar and transcolumnar functional connectivity of layer V pyramidal cells in rat barrel cortex. J Neurosci. 2001;21:3580–3592. doi: 10.1523/JNEUROSCI.21-10-03580.2001. [DOI] [PMC free article] [PubMed] [Google Scholar]
- Schubert D, Kötter R, Zilles K, Luhmann HJ, Staiger JF. Cell type-specific circuits of cortical layer IV spiny neurons. J Neurosci. 2003;23:2961–2970. doi: 10.1523/JNEUROSCI.23-07-02961.2003. [DOI] [PMC free article] [PubMed] [Google Scholar]
- Shepherd GMG, Svoboda K. Laminar and columnar organization of ascending excitatory projections to layer 2/3 pyramidal neurons in rat barrel cortex. J Neurosci. 2005;25:5670–5679. doi: 10.1523/JNEUROSCI.1173-05.2005. [DOI] [PMC free article] [PubMed] [Google Scholar]
- Somogyi P. Specific axo-axonal interneuron in visual cortex of the rat. Brain Res. 1977;136:345–350. doi: 10.1016/0006-8993(77)90808-3. [DOI] [PubMed] [Google Scholar]
- Somogyi P, Kisvárday ZF, Martin KA, Whitteridge D. Synaptic connections of morphologically identified and physiologically characterized large basket cells in the striate cortex of cat. Neuroscience. 1983;10:261–294. doi: 10.1016/0306-4522(83)90133-1. [DOI] [PubMed] [Google Scholar]
- Syková E. Extrasynaptic volume transmission and diffusion parameters of the extracellular space. Neuroscience. 2004;129:861–876. doi: 10.1016/j.neuroscience.2004.06.077. [DOI] [PubMed] [Google Scholar]
- Szabadics J, Varga C, Molnár G, Oláh S, Barzó P, Tamás G. Excitatory effect of GABAergic axo-axonic cells in cortical microcircuits. Science. 2006;311:233–235. doi: 10.1126/science.1121325. [DOI] [PubMed] [Google Scholar]
- Szentágothai J, Arbib MA. Conceptual models of neural organization. Neurosci Res Program Bull. 1974;12:305–510. [PubMed] [Google Scholar]
- Tamás G, Buhl EH, Somogyi P. Fast IPSPs elicited via multiple synaptic release sites by different types of GABAergic neurone in the cat visual cortex. J Physiol. 1997;500:715–738. doi: 10.1113/jphysiol.1997.sp022054. [DOI] [PMC free article] [PubMed] [Google Scholar]
- Thomson AM, West DC, Hahn J, Deuchars J. Single axon IPSPs elicited in pyramidal cells by three classes of interneurones in slices of rat neocortex. J Physiol. 1996;496:81–102. doi: 10.1113/jphysiol.1996.sp021667. [DOI] [PMC free article] [PubMed] [Google Scholar]
- Wilding TJ, Huettner JE. Differential antagonism of alpha-amino-3-hydroxy-5-methyl-4-isoxazolepropionic acid-preferring and kainate-preferring receptors by 2,3-benzodiazepines. Mol Pharmacol. 1995;47:582–587. [PubMed] [Google Scholar]
- Wonders CP, Anderson SA. The origin and specification of cortical interneurons. Nat Rev Neurosci. 2006;7:687–696. doi: 10.1038/nrn1954. [DOI] [PubMed] [Google Scholar]
- Xiang Z, Huguenard JR, Prince DA. Synaptic inhibition of pyramidal cells evoked by different interneuronal subtypes in layer V of rat visual cortex. J Neurophysiol. 2002;88:740–750. doi: 10.1152/jn.2002.88.2.740. [DOI] [PubMed] [Google Scholar]
- Xu X, Callaway EM. Laminar specificity of functional input to distinct types of inhibitory cortical neurons. J Neurosci. 2009;29:70–85. doi: 10.1523/JNEUROSCI.4104-08.2009. [DOI] [PMC free article] [PubMed] [Google Scholar]
- Yoshimura Y, Callaway EM. Fine-scale specificity of cortical networks depends on inhibitory cell type and connectivity. Nat Neurosci. 2005;8:1552–1559. doi: 10.1038/nn1565. [DOI] [PubMed] [Google Scholar]
- Yuste R. Origin and classification of neocortical interneurons. Neuron. 2005;48:524–527. doi: 10.1016/j.neuron.2005.11.012. [DOI] [PubMed] [Google Scholar]