

These results show that MR imaging can be used to accurately and objectively quantify fat in vivo and that MR imaging has the potential to serve as a noninvasive biomarker in the early detection and quantitative assessment of hepatic steatosis.
Abstract
Purpose:
To validate quantitative imaging techniques used to detect and measure steatosis with magnetic resonance (MR) imaging in an ob/ob mouse model of hepatic steatosis.
Materials and Methods:
The internal research animal and resource center approved this study. Twenty-eight male ob/ob mice in progressively increasing age groups underwent imaging and were subsequently sacrificed. Six ob/+ mice served as control animals. Fat fraction imaging was performed with a chemical shift–based water-fat separation method. The following three methods of conventional fat quantification were compared with imaging: lipid extraction and qualitative and quantitative histologic analysis. Fat fraction images were reconstructed with single- and multiple-peak spectral models of fat and with and without correction for T2* effects. Fat fraction measurements obtained with the different reconstruction methods were compared with the three methods of fat quantification, and linear regression analysis and two-sided and two-sample t tests were performed.
Results:
Lipid extraction and qualitative and quantitative histologic analysis were highly correlated with the results of fat fraction imaging (r2 = 0.92, 0.87, 0.82, respectively). No significant differences were found between imaging measurements and lipid extraction (P = .06) or quantitative histologic (P = .07) measurements when multiple peaks of fat and T2* correction were included in image reconstruction. Reconstructions in which T2* correction, accurate spectral modeling, or both were excluded yielded lower agreement when compared with the results yielded by other techniques. Imaging measurements correlated particularly well with histologic grades in mice with low fat fractions (intercept, −1.0% ±1.2 [standard deviation]).
Conclusion:
MR imaging can be used to accurately quantify fat in vivo in an animal model of hepatic steatosis and may serve as a quantitative biomarker of hepatic steatosis.
© RSNA, 2010
Supplemental material: http://http://radiology.rsna.org/lookup/suppl/doi:10.1148/radiol.09090131/-/DC1
Introduction
Nonalcoholic fatty liver disease (NAFLD) is the most common cause of chronic liver disease (1), and its prevalence parallels the current epidemic of obesity and diabetes (2). NAFLD is closely linked with diseases of the metabolic syndrome, such as type II diabetes mellitus, obesity, and hyperlipidemia, and it has a strong association with insulin resistance (2,3). The hallmark of NAFLD is fatty infiltration of hepatocytes (hepatic steatosis). However, in many patients, steatosis can progress to inflammation and fibrosis (1,2,4,5) and eventually cirrhosis, which is a predisposing risk factor for hepatocellular carcinoma and liver failure (4–7). Methods for early detection and assessment of NAFLD through quantitative measurement of steatosis are needed for earlier intervention to avoid progression to cirrhosis.
The earliest biomarker of NAFLD is hepatic steatosis, which currently requires biopsy for definitive diagnosis. Biopsy has an inherent limitation of high sampling variability due to the heterogeneous nature of steatosis (8). Although currently the standard of care, biopsy is costly, may put the patient at risk for potentially severe complications (9), and—as a result—is not suitable for repeated evaluation (2,9). Thus, a noninvasive alternative to biopsy is needed.
Magnetic resonance (MR) imaging has the potential to address the important unmet need of rapid, safe, noninvasive quantitative in vivo fat detection and assessment over the entire liver. Current techniques for MR fat quantification include chemical shift–based methods, such as spectroscopy (10), gradient-echo in-phase and out-of-phase imaging (11–13), and three-point Dixon techniques (14–17).
For MR imaging to be considered an accurate quantitative fat assessment method, several existing confounding factors must be addressed. These factors include T2* decay, the complex nuclear MR spectrum of fat, and T1 and noise biases. The presence of an increased level of iron in the liver is a common finding in patients with NAFLD (2,18,19); this shortens T2* and degrades the fat quantification abilities of many MR imaging methods. Second, most current chemical shift–based fat-water separation techniques model fat as a single peak at −210 Hz relative to water (at 1.5 T) (11,14,20–22), although several other spectral peaks arising from fat exist (23). These multiple spectral peaks must be considered in the fat signal model to achieve accurate quantification of the total fat signal. In addition, differences in T1 values between water and fat can lead to overestimation of fat when rapid T1-weighted sequences are used (11,24), making the measured fat fraction T1 dependent (T1 bias). Use of magnitude images causes apparent nonzero fat fractions in low-signal-intensity areas (25).
One approach used to quantify fat is the chemical shift–based MR technique known as iterative decomposition of water and fat with echo asymmetry and least-squares estimation (IDEAL). The IDEAL water-fat decomposition method enables robust separation of fat and water (16,21,26), and modifications allow additional measurement and correction of T2* (27). This method can also be used to address T1- and noise-related biases, as well as to provide accurate spectral modeling (20,28,29). Although validation has already been performed for correction of T1 (21,25) and noise biases (20), correction methods for T2* decay and accurate spectral modeling that consider multiple spectral fat peaks have not been validated in vivo. In this study, we performed reconstructions with and without combinations of T2* correction and modeling of the multiple peaks of fat to validate these correction factors.
Although MR imaging fat quantification methods have been validated in phantoms, in vivo validation is still required because phantoms may not accurately simulate fatty accumulation in tissue. The use of animal experiments is advantageous because the animal’s liver can be used for comparison with other reference standards. For example, extensive histologic assessment and biochemical total lipid extraction, both of which are highly invasive and/or destructive techniques, are not suitable for use in human studies because patients cannot undergo repeated biopsy. The ob/ob mouse is an excellent model of hepatic steatosis because of its expression of many NAFLD traits (30). These mice are genetically leptin deficient, which causes excessive overeating and development of obesity, steatosis, steatohepatitis, and diabetes, among other symptoms of NAFLD (31,32).
The purpose of this study was to validate quantitative imaging techniques used to detect and measure steatosis with MR imaging in an ob/ob mouse model of hepatic steatosis.
Materials and Methods
This study was a collaborative effort between the University of Wisconsin and GE Healthcare; however, there was no direct financial support from GE Healthcare for this study. In addition, all experiments were performed at the University of Wisconsin. The authors who were not employees of GE Healthcare had control of data and information that might have presented a conflict of interest.
Animal Preparation
Animal research protocols for this prospective study were approved by our institutional research animal resource center. Twenty-eight 5-week-old (at the start of the study) male ob/ob mice (Harlan-Sprague-Dawley, Indianapolis, Ind) were housed in pairs with food and water ad libitum. All mice were 5 weeks old at the start of the study. Obese mice (ob/ob) were divided into four groups, imaged, and subsequently sacrificed at 5 (n = 6), 7 (n = 10), 9 (n = 6), and 13 (n = 6) weeks of age because the severity of steatosis and obesity increases throughout this age range (31,33). Six 5-week-old lean littermate control mice (ob/+) were examined and sacrificed at 9 weeks of age; mice with this genotype do not exhibit obesity, hepatic steatosis, or signs of NAFLD.
Prior to imaging, mice were anesthetized with an intraperitoneal injection of pentobarbital (40 mg per kilogram of body weight) (Ovation Pharmaceuticals, Deerfield, Ill). Immediately after imaging, mice were euthanized with CO2, their tissues were perfused with phosphate-buffered saline, and their livers were immediately excised. All animal preparation was performed by one individual (C.D.G.H., 4 years of experience with small animal handling). The body temperature of the mice may decrease when they are sedated. This decrease in temperature can cause a shift in the proton resonance frequency of water (Δf), as shown in the following equation:
where α is equal to 0.01 ppm/°C according to Taylor et al (34), γ/2π is equal to 42.58 MHz/T and is the gyromagnetic ratio of protons, and B0 is the strength of the main magnetic field. In the worst case, a 10°C decrease in body temperature (ΔT) would cause a shift in the water resonance of less than 13 Hz at 3.0 T. This shift is small compared with a shift of 420 Hz, and simulations indicate that this error would have negligible effects on water-fat separation with the IDEAL technique. In addition, a 10°C decrease in body temperature would likely be fatal to the mice. Given that all mice survived anesthesia, it is highly unlikely that body temperature confounded any of the fat fraction measurements obtained in this study.
Imaging Sequence and Parameters
Imaging was performed with a 3.0-T clinical imager (Signa TwinSpeed HDx; GE Healthcare, Waukesha, Wis) with a custom-built quadrature birdcage coil sized for rodents (C.D.G.H., 4 years of imaging experience). The coil had an inner diameter of 8 cm and a length of 11.5 cm. Data were collected by using a three-dimensional spoiled gradient-echo sequence and reconstructed with a T2*-corrected IDEAL algorithm (27).
Imaging parameters for the T2*-corrected IDEAL sequence were as follows: flip angle, 5°; first echo time, 2.1 msec; repetition time, 30 msec; field of view, 12 × 7 cm; matrix, 256 × 154; bandwidth, ±100 kHz; one signal acquired; 28 sections; and section thickness, 0.8 mm. A total of 15 echoes were acquired, with three interleaved five-echo time/repetition time acquisitions and the first echo time at 2.1 msec. Each repetition time had an echo spacing of 3.7 msec, and each repetition time was shifted by 1.2 msec, making the effective echo spacing for the equally spaced echoes 1.2 msec. Total imaging time was 7 minutes 24 seconds, and true spatial resolution was 0.5 × 0.5 × 0.8 mm. Sedation of mice with pentobarbital led to no perceptible breathing artifacts.
Image Reconstruction
Several modifications have been made to the IDEAL algorithm to correct for the confounding factors of noise and T1 biases, T2* decay, and the spectral complexity of fat. The modified T2*-corrected IDEAL algorithm uses a magnitude discrimination method to calculate fat fraction without noise bias (20), and in this study, we used a low flip angle (5°) to minimize T1 bias (20,24). The IDEAL technique also uses a region-growing algorithm for field map estimation, rather than phase unwrapping, to prevent fat-water swaps on reconstructed images (35).
The T2*-corrected IDEAL algorithm accounts and corrects for T2* decay by decoupling the effects of T2* from those induced by the chemical shift of fat by using a modified signal model with a complex field map (27), which enables simultaneous estimation of water, fat, and T2*. In addition, a multipeak IDEAL reconstruction method that accounts for multiple spectral peaks of fat has been developed recently but not validated in vivo (28,29). Bydder et al (24) also reported a related approach with phantom validation. The multipeak reconstruction uses a self-calibrated fat signal evolution model that accounts for multiple spectral peak amplitudes in the acquired data for use in the modified IDEAL algorithm (28). In this manner, multiple peaks of fat are included in the algorithm for accurate spectral modeling.
Reconstructions were performed with the same set of acquired complex data to create four distinct sets of images per mouse (C.D.G.H., H.Y.; 3 and 8 years of experience, respectively, in data reconstruction). Data were reconstructed with and without T2* correction, and both of these options were constructed with (multipeak) and without (single peak) accurate spectral modeling; the previously described self-calibrated multipeak IDEAL technique was used for inclusion of multiple peaks of fat. The same regions of interest (ROIs) were chosen for all reconstructions for each mouse.
One potential method to reduce imaging time is to use a shorter echo train. A shorter echo train would yield a shorter repetition time, which is desirable for breath-hold applications; however, this may reduce the accuracy of T2* estimation and correction (28). Previous work has suggested that acquisition of six echoes may provide a reasonable compromise between accurate T2* correction and imaging time (27). To investigate this effect as a potential means to reduce imaging time, data were also reconstructed by using only the first six acquired echoes (truncating the last nine echoes); the same four reconstructions and ROI selection as described for the full 15-echo data set were performed.
Reconstructions yielded a fat image (Sf), a water image (Sw), a field map, and an R2* map. The water and fat images were used to obtain a fat fraction image (η) on a pixel-by-pixel basis, as follows:
Fat fraction images have the advantage of avoiding B1 coil sensitivity profiles and enabling normalized and useful quantitative fat measurement (21).
Histologic Assessment
A sample of the left lateral lobe was excised from all mouse livers, fixed in formalin, and stained with hematoxylin-eosin. Although the liver weights ranged greatly for all mice because of age and genotype (average weight, 2.19 g ± 0.88 [standard deviation]), sample sizes were similar (100–150 mg). Subjective grading of steatosis was performed by a surgical pathologist (T.F.W., 36 years of experience) who was blinded to imaging and lipid extraction results. Grading results were expressed as the percentage of cells affected by steatosis in 5% increments (qualitative histologic analysis) and additionally according to Brunt et al (36).
Digitized hematoxylin-eosin–stained slides were also analyzed with image analysis software (Image Pro Plus 6.2; Media Cybernetics, Bethesda, Md) to obtain a quantitative histologic measurement of steatosis (quantitative histologic analysis). According to the methods described in previous reports (13), a histogram of pixel intensity is generated from the image. The area above a set threshold is measured, and the results are expressed as a fat percentage by area (13,37,38).
Lipid Extraction
Total hepatic lipid content was determined with a modified Folch extraction procedure, which used less-toxic organic solvents (39) (C.D.G.H., 6 years of experience). The liver was separated into the five major lobes, including the remaining majority of the left lateral lobe, and lipids were extracted separately from all lobes. Fat percentage was expressed as the mass of total lipids recovered in the lobe divided by the mass of the lobe. The mass fat fractions from individual lobes were used to calculate a normalized average by weight of the lobe to report a mass fat fraction across the entire liver (hereafter, mass fat fraction).
Imaging Data Analysis
ROI measurements were obtained in the five major lobes on the fat fraction images (C.D.G.H., 4 years of experience). Since the lobes ranged greatly in size and position, ROI size ranged from 6 to 32 mm2. ROIs were chosen to encompass as much of the individual lobe as possible while attempting to avoid major blood vessels. One ROI was chosen per lobe. A normalized average by area of ROI measurement was calculated by using all lobes to report a fat fraction percentage across the entire liver (hereafter, imaging fat fraction). ROI measurements were obtained in the same locations of each mouse for all image reconstructions. To calculate fat fractions across the entire liver for lipid extraction, a normalized average by mass of each lobe was calculated by using mass fat fractions from all five lobes.
Statistical Analyses
All statistical analyses were performed by using Excel software (version 10.6841.6839 SP3; Microsoft, Redmond, Wash) with assistance from a statistician with more than 8 years of experience. Linear regression analysis was performed between average fat fractions across the entire liver for each imaging fat fraction reconstruction and average fat fractions across the entire liver for qualitative and quantitative histologic analyses and lipid extraction for every mouse. Error bars on resulting plots represent the corresponding measured standard deviation. Perfect agreement between imaging fat fraction and another fat quantification method would have a slope of 1.0 and an intercept of 0.0.
Two-sided t tests at the .05 significance level were used to determine whether the estimated slope and intercept were significantly different from 1.0 and 0.0, respectively. To determine whether significant differences exist between imaging fat fractions and the results of qualitative and quantitative histologic analyses and lipid extraction, two-sample t tests at the .05 significance level were performed. Bonferroni-adjusted P values less than .05 indicated significant differences between distributions.
Although a high degree of correlation and a linear relationship was expected between the histologic grade and the imaging fat fraction, a one-to-one relationship between a qualitative technique and a quantitative technique was not expected. These two techniques involve different methods of fat assessment; while histologic analysis reports the percentage of cells affected by steatosis, imaging yields the fat fraction. Thus, a two-sided t test and a two-sample t test were not performed against the slopes and distributions, respectively.
Results
Figure 1 shows the progression of steatosis through generated fat, water, and calculated fat fraction images of a representative control ob/+ mouse and two ob/ob mice of increasing age. Opposite the fat fraction images are the corresponding hematoxylin-eosin–slides of these mice. Histologic grading was consistent with imaging findings; both fat fraction measurements and histologic grading scores consistently increase with age and among ob/ob mice.
Figure 1:

Representative coronal IDEAL water, fat, and fat fraction MR images show the progression of steatosis in ob/ob mice compared with that in a control ob/+ mouse. Corresponding slides show increasing macro- and microvesicular steatosis accumulation corresponding to imaging findings. (Hematoxylin-eosin stain [H&E]; original magnification, ×100.) T2* correction and accurate spectral modeling were used for these images. A marked increase in visceral and subcutaneous fat and hepatic steatosis can be seen in the ob/ob mice compared with the ob/+ mouse, and these features are exaggerated in the 13-week-old ob/ob mouse compared with the 7-week-old ob/ob mouse. Fat fraction images enable quantification of fat and enable confirmation of visual suspicion of steatosis: For instance, 0.0% ± 4.5, 14.4% ± 3.9, and 24.7% ± 6.6 fat was measured in the ob/+ mouse, 7-week old ob/ob mouse, and 13-week old ob/ob mouse, respectively. Histologic grading revealed 0%, 50%, and 85% of cells were affected by steatosis in the representative ob/+ mouse, 7-week old ob/obmouse, and 13-week old ob/ob mouse, respectively.
Fat fraction measurements from each reconstruction were plotted against histologic grades and are shown in Figure 2, with statistical results summarized in Table 1. Large standard deviations for imaging fat fractions, results of quantitatitve histologic analysis, and mass fat fractions are seen for all plots, which reflect the heterogeneity of fat deposits across the liver. These plots show a linear relationship between histologic grading and imaging fat fraction and may be useful for conversion between imaging and histologic steatosis assessment. All reconstructions have intercepts that are not significantly different from 0.0, which indicates that imaging is sensitive at low fat fractions, as these two techniques agree particularly well at low fat fractions. For three mice, estimated fat was not adequately described within the five percentage increments by the pathologist (66%, 82%, and 68%). These estimates were included unaltered as points in Figure 2.
Figure 2a:

Graphs show histologic grading results (obtained with qualitative histologic analysis) plotted against imaging fat fraction measurements. (a, b) Single peak (a)without and (b) with T2* correction. (c, d) Multipeak (c)without and (d) with T2* correction. Statistical parameters are summarized in Table 1. The highest correlation of determination (r2) is seen for the reconstruction with accurate spectral modeling and T2* correction. Intercepts from all methods are not significantly different from 0.0, indicating all IDEAL correction methods are accurate at low fat fractions. Error bars represent measured standard deviation.
Figure 2b:

Graphs show histologic grading results (obtained with qualitative histologic analysis) plotted against imaging fat fraction measurements. (a, b) Single peak (a)without and (b) with T2* correction. (c, d) Multipeak (c)without and (d) with T2* correction. Statistical parameters are summarized in Table 1. The highest correlation of determination (r2) is seen for the reconstruction with accurate spectral modeling and T2* correction. Intercepts from all methods are not significantly different from 0.0, indicating all IDEAL correction methods are accurate at low fat fractions. Error bars represent measured standard deviation.
Figure 2c:

Graphs show histologic grading results (obtained with qualitative histologic analysis) plotted against imaging fat fraction measurements. (a, b) Single peak (a)without and (b) with T2* correction. (c, d) Multipeak (c)without and (d) with T2* correction. Statistical parameters are summarized in Table 1. The highest correlation of determination (r2) is seen for the reconstruction with accurate spectral modeling and T2* correction. Intercepts from all methods are not significantly different from 0.0, indicating all IDEAL correction methods are accurate at low fat fractions. Error bars represent measured standard deviation.
Figure 2d:

Graphs show histologic grading results (obtained with qualitative histologic analysis) plotted against imaging fat fraction measurements. (a, b) Single peak (a)without and (b) with T2* correction. (c, d) Multipeak (c)without and (d) with T2* correction. Statistical parameters are summarized in Table 1. The highest correlation of determination (r2) is seen for the reconstruction with accurate spectral modeling and T2* correction. Intercepts from all methods are not significantly different from 0.0, indicating all IDEAL correction methods are accurate at low fat fractions. Error bars represent measured standard deviation.
Table 1.
Comparison of 15-Echo Fat Fraction Measurements with Qualitative Histologic Grading
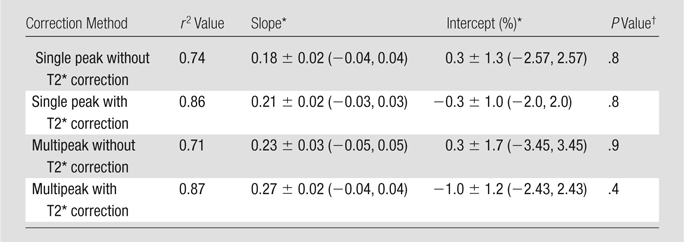
Data are means ± standard deviations. Data in parentheses are 95% confidence intervals.
P value greater than .05 indicates no significant difference between obtained intercept and 0.0.
The fat fraction measurements from each reconstruction were plotted against the quantitative histologic intensity segmentation technique. These plots are shown in Figure E1 (online), and the statistical results are shown in Table 2. An ambiguity was observed in the computer segmentation–based analysis of histologic slides. According to the pathologist, white areas on the slides obtained in ob/+ mice were not fat deposits but corresponded to other histologic and cellular features that appeared white on hematoxylin-eosin–stained slides. Although ob/ob slides also have these features, nonfat white areas are negligible compared with the large area of confirmed fat vacuoles, which ob/+ mice lack. We concluded that threshold-based segmentation could not be used to distinguish nonfat white areas from fat vacuoles. As a result, the intensity segmentation technique reported fat deposits for the control mice, which caused the intercepts of these plots to be different from 0.0. The locations of the intercepts also resulted in increased slope values, as seen if the control mice were excluded from linear regression. However, no points were excluded from analysis or from the figures.
Table 2.
Comparison of 15-Echo Fat Fraction Measurements with Quantitative Histologic Grading
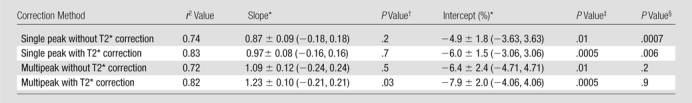
Data are means ± standard deviations. Data in parentheses are 95% confidence intervals.
P > .05 indicates no significant difference between obtained slope and 1.0.
P > .05 indicates no significant difference between obtained intercept and 0.0.
P > .05 indicates no significant difference between imaging fat fraction and quantitative histologic fat fractions.
Figure 3 shows the comparison of all IDEAL reconstructions to lipid extraction mass fat fractions, with statistical results summarized in Table 3. A bias in the intercepts of the plots of Figure 3 exists and is likely due to a discrepancy between lipid extraction and imaging fat fractions; it was expected that the intercepts of these plots would be 0.0. Total lipid extractions, such as the Folch-based methods, are nonspecific and result in the extraction of all lipids, including those that may be invisible with MR imaging. Conventional MR proton techniques cannot be used to detect bound or aggregated lipids, such as those found in lipid membranes or lipoproteins, since these lipids have solidlike behavior and short T2 values (40–42). The ob/+ fat fractions are more affected by MR-invisible lipids than are the ob/ob fat fractions, given that the latter fat fractions are dominated by stored triglycerides. As a result of this discrepancy, nonzero intercepts were generated, which also increased estimated slope values and provided an explanation for errors in the results. For example, if the ob/+ mice were excluded from linear regression for the reconstruction with accurate spectral modeling and T2* correction, near perfect agreement of mass fat fraction with imaging fat fraction was seen, and the y intercept increased to −0.029 ± 0.02 (−0.063 ± 0.01 with all mice). However, no points were excluded from analysis or figures.
Figure 3a:

Graphs show lipid extraction mass fat fractions plotted against imaging fat fraction measurements. (a, b) Single peak (a) without and (b) with T2* correction. (c, d) Multipeak (c) without and (d) with T2* correction. Statistical parameters are summarized in Table 3. Dashed lines=line of unity, error bars=measured standard deviation. All reconstructions showed an intercept that was significantly different from 0.0; however, only reconstructions that included multiple peaks of fat showed slopes that were not significantly different from 1.0.
Figure 3b:

Graphs show lipid extraction mass fat fractions plotted against imaging fat fraction measurements. (a, b) Single peak (a) without and (b) with T2* correction. (c, d) Multipeak (c) without and (d) with T2* correction. Statistical parameters are summarized in Table 3. Dashed lines=line of unity, error bars=measured standard deviation. All reconstructions showed an intercept that was significantly different from 0.0; however, only reconstructions that included multiple peaks of fat showed slopes that were not significantly different from 1.0.
Figure 3c:

Graphs show lipid extraction mass fat fractions plotted against imaging fat fraction measurements. (a, b) Single peak (a) without and (b) with T2* correction. (c, d) Multipeak (c) without and (d) with T2* correction. Statistical parameters are summarized in Table 3. Dashed lines=line of unity, error bars=measured standard deviation. All reconstructions showed an intercept that was significantly different from 0.0; however, only reconstructions that included multiple peaks of fat showed slopes that were not significantly different from 1.0.
Figure 3d:

Graphs show lipid extraction mass fat fractions plotted against imaging fat fraction measurements. (a, b) Single peak (a) without and (b) with T2* correction. (c, d) Multipeak (c) without and (d) with T2* correction. Statistical parameters are summarized in Table 3. Dashed lines=line of unity, error bars=measured standard deviation. All reconstructions showed an intercept that was significantly different from 0.0; however, only reconstructions that included multiple peaks of fat showed slopes that were not significantly different from 1.0.
Table 3.
Comparison of 15-Echo Fat Fraction Measurements with Lipid Extraction Results

Data are means ± standard deviations. Data in parentheses are 95% confidence intervals.
P > .05 indicates no significant difference between obtained slope and 1.0.
P > .05 indicates no significant difference between obtained intercept and 0.0.
P > .05 indicates no significant difference between imaging fat fraction and mass fat fractions.
Lower correlation between imaging fat fractions and all other fat quantification techniques was seen for reconstructions without T2* correction. Fat fractions for all compared techniques were underestimated for reconstructions that excluded T2* correction, multiple peaks of fat, or both. Both T2* correction and multiple peaks of fat must be included to enable one to accurately quantify fat in vivo. Further, reconstruction including multiple spectral fat peaks and T2* correction consistently displays high correlation with other fat quantification methods, and no significant differences between imaging fat fractions and quantitative histologic or lipid extraction results are seen. Further, imaging fat fractions with T2* correction displayed better overall agreement compared with fat fractions without T2* correction. On the basis of information from slopes, intercepts, r2 values, and three P values of each compared technique, we concluded that the reconstruction, including multiple spectral fat peaks and T2* correction, was the most accurate reconstruction for fat quantification.
A comparison of fat fraction measurements from data reconstructed with six and 15 echoes is shown in Figure E2 (online). These data were reconstructed using T2* correction and multiple spectral fat peaks. This plot demonstrates equivalence between six echo reconstructions and 15 echo reconstructions, given the high correlation and nearly ideal slope and intercept. In the interest of space, the six echo plots versus the 15 echo plots for each reconstruction are not shown, but they also display equivalence. Linear regression results for each reconstruction all show excellent correlation with r2 values greater than 0.95.
Discussion
We have demonstrated close agreement between MR imaging and three conventional methods for the quantitative assessment of hepatic steatosis. These results also demonstrate that corrections for confounding factors of T2* decay, accurate spectral modeling, noise-, and T1-related bias are necessary for accurate fat quantification in the liver. Our results provide validation that MR imaging enables accurate fat quantification in mice and has potential for use in the quantitative assessment of hepatic steatosis in clinical practice.
Previous work in which researchers compared another modality or technique with MR imaging often involved the use of conventional two-point Dixon, spectroscopy, and/or fat or water suppression imaging techniques. The primary weakness of these methods is that they do not correct for confounding factors of T1 and noise biases, T2* decay, or accurate spectral modeling. In addition, we performed multiple comparisons within the same study rather than one comparison, with emphasis toward the clinical current standard of qualitative histologic analysis and lipid extraction (mass fat fraction). For example, Yokoo et al (43) and Kim et al (44) addressed confounding factors and compared results with spectroscopy only and use of the two-point Dixon technique for fat quantification, respectively. To our knowledge, no other published studies have addressed all known confounding factors for accurate fat quantification over the entire liver and compared imaging fat fraction with quantitative and qualitative histologic analysis and lipid extraction.
Our study had several limitations. First, this technique suffered from a long imaging time that was necessary to achieve the spatial resolution and signal-to-noise ratio performance needed to image mice. Clinical implementation will require a shortened imaging time with parallel imaging acceleration and shortened echo train lengths that decrease the repetition time. Second, although no respiratory artifacts were encountered, the mice were heavily sedated, and free breathing would likely be an issue in patients, unless breath-hold imaging times could be achieved in the clinical application of these methods. Third, the signal model assumes that water and fat share the same T2* decay. No methods currently exist with which to address the potential problem of differing T2* decays between water and fat, although this has been recognized (24,27). This potential discrepancy may have introduced bias in our results, although it is likely that this is a second-order effect that represents a minor source of error in comparison with the effect of other correction factors (shared component of T2* decay, accurate spectral modeling of fat, T1 bias, and noise-related bias). Future work will focus on the development of signal models that allow independent correction of T2* decay for water and fat.
We also investigated the use of shorter echo trains that are needed to reduce the repetition time as a means to reduce examination time to facilitate transition of these findings into practice, and our results revealed near equivalence of fat fraction measurements between six- and 15-echo reconstructions. A second way to reduce examination time is the implementation of parallel imaging with this pulse sequence. Recent work at our institution has demonstrated the feasibility of breath-hold imaging in patients with use of two-dimensional parallel imaging acceleration (28,45). With the use of two-dimensional parallel imaging methods to achieve a 22-second breath hold, we predict that respiratory artifacts will be largely avoided.
The use of animals in our study was critical to have large sample sizes and a true mass fat fraction across the entire liver, since the entire liver was harvested and tested. Such testing is not possible in humans because of the small size of biopsy samples, and an animal model enabled abundantly more extensive and thorough testing than is allowed in humans. If large volumes of human tissue are harvested, however, substantial biohazards may arise; our laboratory facility was not compatible with processing human tissue.
Although these methods can be validated in an animal model by using correlation with destructive techniques, such as histologic analysis and hepatic lipid extraction, additional clinical validation is required with a biopsy and imaging correlation study. In addition, the reproducibility of this method must be determined before the clinical utility of these methods can be ascertained. Although unforeseen discrepancies may arise between these results from mice to patients, our results have demonstrated the need for correction methods that address confounding factors, including T2* decay, multiple spectral peaks of fat, noise bias, and T1-related bias.
In summary, we have demonstrated that MR imaging with T2* correction and accurate spectral modeling correlate strongly with conventional fat quantification methods. These results show that MR imaging can be used to accurately and objectively quantify fat in vivo and that MR imaging has the potential to serve as a noninvasive biomarker in the early detection and quantitative assessment of hepatic steatosis.
Advances in Knowledge.
Quantification of fat with MR imaging correlates strongly with qualitative and quantitative histologic assessment and quantitative lipid extraction over a wide range of steatosis in vivo.
Correction for T2* decay and accurate spectral modeling are essential for accurate fat quantification in the liver.
Implications for Patient Care.
Quantification of fat with MR imaging may provide an accurate noninvasive alternative to biopsy, which is the current standard in the detection and assessment of steatosis.
Noninvasive assessment of steatosis with chemical shift–based MR imaging is feasible in an animal model and is a potential clinical biomarker in the early detection and quantitative grading of hepatic steatosis.
Supplementary Material
Acknowledgments
We thank Kazuhiko Shinki, PhD, for his statistical assistance.
Received January 21, 2009; revision requested March 6; revision received May 22; accepted June 12; final version accepted August 5.
Funding:This research was supported by the National Institutes of Health (grant 1UL1RR025011).
See Materials and Methods for pertinent disclosures.
Abbreviations:
- IDEAL
- iterative decomposition of water and fat with echo asymmetry and least-squares estimation
- NAFLD
- nonalcoholic fatty liver disease
- ROI
- region of interest
References
- 1.Sass DA, Chang P, Chopra KB. Nonalcoholic fatty liver disease: a clinical review. Dig Dis Sci 2005;50(1):171–180 [DOI] [PubMed] [Google Scholar]
- 2.Harrison SA, Neuschwander-Tetri BA. Nonalcoholic fatty liver disease and nonalcoholic steatohepatitis. Clin Liver Dis 2004;8(4):861–879,ix [DOI] [PubMed] [Google Scholar]
- 3.Marchesini G, Brizi M, Morselli-Labate AM, et al. Association of nonalcoholic fatty liver disease with insulin resistance. Am J Med 1999;107(5):450–455 [DOI] [PubMed] [Google Scholar]
- 4.McCullough AJ. The clinical features, diagnosis and natural history of nonalcoholic fatty liver disease. Clin Liver Dis 2004;8(3):521–533 [DOI] [PubMed] [Google Scholar]
- 5.Brunt EM. Nonalcoholic steatohepatitis. Semin Liver Dis 2004;24(1):3–20 [DOI] [PubMed] [Google Scholar]
- 6.Cuadrado A, Orive A, García-Suárez C, et al. Non-alcoholic steatohepatitis (NASH) and hepatocellular carcinoma. Obes Surg 2005;15(3):442–446 [DOI] [PubMed] [Google Scholar]
- 7.Smedile A, Bugianesi E. Steatosis and hepatocellular carcinoma risk. Eur Rev Med Pharmacol Sci 2005;9(5):291–293 [PubMed] [Google Scholar]
- 8.Ratziu V, Charlotte F, Heurtier A, et al. Sampling variability of liver biopsy in nonalcoholic fatty liver disease. Gastroenterology 2005;128(7):1898–1906 [DOI] [PubMed] [Google Scholar]
- 9.Bravo AA, Sheth SG, Chopra S. Liver biopsy. N Engl J Med 2001;344(7):495–500 [DOI] [PubMed] [Google Scholar]
- 10.Thomsen C, Becker U, Winkler K, Christoffersen P, Jensen M, Henriksen O. Quantification of liver fat using magnetic resonance spectroscopy. Magn Reson Imaging 1994;12(3):487–495 [DOI] [PubMed] [Google Scholar]
- 11.Fishbein MH, Gardner KG, Potter CJ, Schmalbrock P, Smith MA. Introduction of fast MR imaging in the assessment of hepatic steatosis. Magn Reson Imaging 1997;15(3):287–293 [DOI] [PubMed] [Google Scholar]
- 12.Ma J. Breath-hold water and fat imaging using a dual-echo two-point dixon technique with an efficient and robust phase-correction algorithm. Magn Reson Med 2004;52(2):415–419 [DOI] [PubMed] [Google Scholar]
- 13.Hussain HK, Chenevert TL, Londy FJ, et al. Hepatic fat fraction: MR imaging for quantitative measurement and display—early experience. Radiology 2005;237(3):1048–1055 [DOI] [PubMed] [Google Scholar]
- 14.Glover GH. Multipoint Dixon technique for water and fat proton and susceptibility imaging. J Magn Reson Imaging 1991;1(5):521–530 [DOI] [PubMed] [Google Scholar]
- 15.Glover GH, Schneider E. Three-point Dixon technique for true water/fat decomposition with B0 inhomogeneity correction. Magn Reson Med 1991;18(2):371–383 [DOI] [PubMed] [Google Scholar]
- 16.Reeder SB, Pineda AR, Wen Z, et al. Iterative decomposition of water and fat with echo asymmetry and least-squares estimation (IDEAL): application with fast spin-echo imaging. Magn Reson Med 2005;54(3):636–644 [DOI] [PubMed] [Google Scholar]
- 17.Wong WF, Northrup SR, Herrick RC, Glombicki AP, Wood RP, Morrisett JD. Quantitation of lipid in biological tissue by chemical shift magnetic resonance imaging. Magn Reson Med 1994;32(4):440–446 [DOI] [PubMed] [Google Scholar]
- 18.George DK, Goldwurm S, MacDonald GA, et al. Increased hepatic iron concentration in nonalcoholic steatohepatitis is associated with increased fibrosis. Gastroenterology 1998;114(2):311–318 [DOI] [PubMed] [Google Scholar]
- 19.Bonkovsky HL, Jawaid Q, Tortorelli K, et al. Non-alcoholic steatohepatitis and iron: increased prevalence of mutations of the HFE gene in non-alcoholic steatohepatitis. J Hepatol 1999;31(3):421–429 [DOI] [PubMed] [Google Scholar]
- 20.Liu CY, McKenzie CA, Yu H, Brittain JH, Reeder SB. Fat quantification with IDEAL gradient echo imaging: correction of bias from T(1) and noise. Magn Reson Med 2007;58(2):354–364 [DOI] [PubMed] [Google Scholar]
- 21.Reeder SB, McKenzie CA, Pineda AR, et al. Water-fat separation with IDEAL gradient-echo imaging. J Magn Reson Imaging 2007;25(3):644–652 [DOI] [PubMed] [Google Scholar]
- 22.Dixon WT. Simple proton spectroscopic imaging. Radiology 1984;153(1):189–194 [DOI] [PubMed] [Google Scholar]
- 23.Yeung DK, Griffith JF, Antonio GE, Lee FK, Woo J, Leung PC. Osteoporosis is associated with increased marrow fat content and decreased marrow fat unsaturation: a proton MR spectroscopy study. J Magn Reson Imaging 2005;22(2):279–285 [DOI] [PubMed] [Google Scholar]
- 24.Bydder M, Yokoo T, Hamilton G, et al. Relaxation effects in the quantification of fat using gradient echo imaging. Magn Reson Imaging 2008;26(3):347–359 [DOI] [PMC free article] [PubMed] [Google Scholar]
- 25.Henkelman RM. Measurement of signal intensities in the presence of noise in MR images. Med Phys 1985;12(2):232–233 [DOI] [PubMed] [Google Scholar]
- 26.Reeder SB, Wen Z, Yu H, et al. Multicoil Dixon chemical species separation with an iterative least-squares estimation method. Magn Reson Med 2004;51(1):35–45 [DOI] [PubMed] [Google Scholar]
- 27.Yu H, McKenzie CA, Shimakawa A, et al. Multiecho reconstruction for simultaneous water-fat decomposition and T2* estimation. J Magn Reson Imaging 2007;26(4):1153–1161 [DOI] [PubMed] [Google Scholar]
- 28.Yu H, Shimakawa A, McKenzie CA, Brodsky E, Brittain JH, Reeder SB. Multiecho water-fat separation and simultaneous R2* estimation with multifrequency fat spectrum modeling. Magn Reson Med 2008;60(5):1122–1134 [DOI] [PMC free article] [PubMed] [Google Scholar]
- 29.Yu H, Shimakawa A, McKenzie CA, Brittain JH, Reeder SB. IDEAL water-fat decomposition with multipeak fat spectrum modeling. Presented at the 16th meeting of the International Society for Magnetic Resonance in Medicine, Toronto, Ontario, Canada,May 3–9, 2008 [Google Scholar]
- 30.Nanji AA. Animal models of nonalcoholic fatty liver disease and steatohepatitis. Clin Liver Dis 2004;8(3):559–574 [DOI] [PubMed] [Google Scholar]
- 31.Shore SA. Obesity and asthma: lessons from animal models. J Appl Physiol 2007;102(2):516–528 [DOI] [PubMed] [Google Scholar]
- 32.Koteish A, Diehl AM. Animal models of steatosis. Semin Liver Dis 2001;21(1):89–104 [DOI] [PubMed] [Google Scholar]
- 33.Menahan LA. Age-related changes in lipid and carbohydrate metabolism of the genetically obese mouse. Metabolism 1983;32(2):172–178 [DOI] [PubMed] [Google Scholar]
- 34.Taylor BA, Hwang KP, Elliott AM, Shetty A, Hazle JD, Stafford RJ. Dynamic chemical shift imaging for image-guided thermal therapy: analysis of feasibility and potential. Med Phys 2008;35(2):793–803 [DOI] [PubMed] [Google Scholar]
- 35.Yu H, Reeder SB, Shimakawa A, Brittain JH, Pelc NJ. Field map estimation with a region growing scheme for iterative 3-point water-fat decomposition. Magn Reson Med 2005;54(4):1032–1039 [DOI] [PubMed] [Google Scholar]
- 36.Brunt EM, Janney CG, Di Bisceglie AM, Neuschwander-Tetri BA, Bacon BR. Nonalcoholic steatohepatitis: a proposal for grading and staging histological lesions. Am J Gastroenterol 1999;94(9):2467–2474 [DOI] [PubMed] [Google Scholar]
- 37.Boyles TH, Johnson S, Garrahan N, Freedman AR, Williams GT. A validated method for quantifying macrovesicular hepatic steatosis in chronic hepatitis C. Anal Quant Cytol Histol 2007;29(4):244–250 [PubMed] [Google Scholar]
- 38.Marsman H, Matsushita T, Dierkhising R, et al. Assessment of donor liver steatosis: pathologist or automated software? Hum Pathol 2004;35(4):430–435 [DOI] [PubMed] [Google Scholar]
- 39.Hara A, Radin NS. Lipid extraction of tissues with a low-toxicity solvent. Anal Biochem 1978;90(1):420–426 [DOI] [PubMed] [Google Scholar]
- 40.Govindaraju V, Meyerhoff DJ, Maudsley AA, Vermathen M, Weiner MW. Effects of brain membranes on 1H nuclear magnetic resonance signal intensity of ethanol in vitro. Alcohol Alcohol 1997;32(6):671–681 [DOI] [PMC free article] [PubMed] [Google Scholar]
- 41.Yang Y, Bai G, Zhang X, Ye C, Liu M. 1H NMR spectroscopic evidence of interaction between ibuprofen and lipoproteins in human blood plasma. Anal Biochem 2004;324(2):292–297 [DOI] [PubMed] [Google Scholar]
- 42.Fossel ET, Hoefeler H. Observation of intracellular potassium and sodium in the heart by NMR: a major fraction of potassium is “invisible”. Magn Reson Med 1986;3(4):534–540 [DOI] [PubMed] [Google Scholar]
- 43.Yokoo T, Bydder M, Hamilton G, et al. Nonalcoholic fatty liver disease: diagnostic and fat-grading accuracy of low-flip-angle multiecho gradient-recalled-echo MR imaging at 1.5 T. Radiology 2009;251(1):67–76 [DOI] [PMC free article] [PubMed] [Google Scholar]
- 44.Kim H, Booth CJ, Pinus AB, et al. Induced hepatic fibrosis in rats: hepatic steatosis, macromolecule content, perfusion parameters, and their correlations—preliminary MR imaging in rats. Radiology 2008;247(3):696–705 [DOI] [PubMed] [Google Scholar]
- 45.Brau AC, Beatty PJ, Skare S, Bammer R. Comparison of reconstruction accuracy and efficiency among autocalibrating data-driven parallel imaging methods. Magn Reson Med 2008;59(2):382–395 [DOI] [PMC free article] [PubMed] [Google Scholar]
Associated Data
This section collects any data citations, data availability statements, or supplementary materials included in this article.