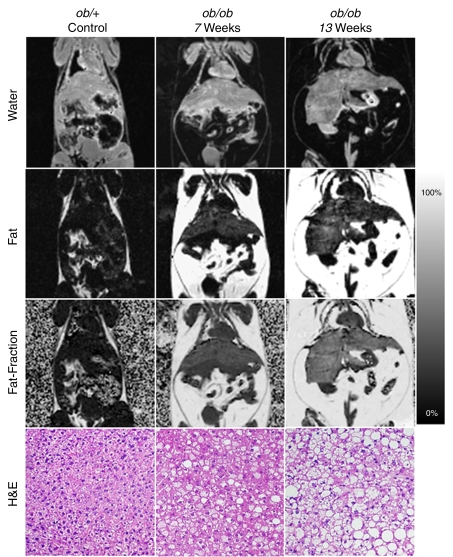
Figure 1:
Representative coronal IDEAL water, fat, and fat fraction MR images show the progression of steatosis in ob/ob mice compared with that in a control ob/+ mouse. Corresponding slides show increasing macro- and microvesicular steatosis accumulation corresponding to imaging findings. (Hematoxylin-eosin stain [H&E]; original magnification, ×100.) T2* correction and accurate spectral modeling were used for these images. A marked increase in visceral and subcutaneous fat and hepatic steatosis can be seen in the ob/ob mice compared with the ob/+ mouse, and these features are exaggerated in the 13-week-old ob/ob mouse compared with the 7-week-old ob/ob mouse. Fat fraction images enable quantification of fat and enable confirmation of visual suspicion of steatosis: For instance, 0.0% ± 4.5, 14.4% ± 3.9, and 24.7% ± 6.6 fat was measured in the ob/+ mouse, 7-week old ob/ob mouse, and 13-week old ob/ob mouse, respectively. Histologic grading revealed 0%, 50%, and 85% of cells were affected by steatosis in the representative ob/+ mouse, 7-week old ob/obmouse, and 13-week old ob/ob mouse, respectively.

