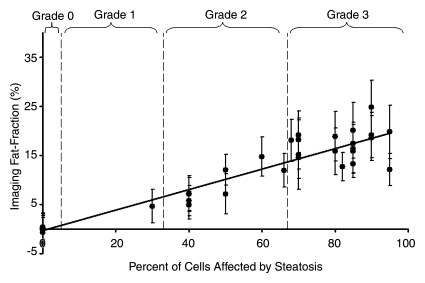
Figure 2b:
Graphs show histologic grading results (obtained with qualitative histologic analysis) plotted against imaging fat fraction measurements. (a, b) Single peak (a)without and (b) with T2* correction. (c, d) Multipeak (c)without and (d) with T2* correction. Statistical parameters are summarized in Table 1. The highest correlation of determination (r2) is seen for the reconstruction with accurate spectral modeling and T2* correction. Intercepts from all methods are not significantly different from 0.0, indicating all IDEAL correction methods are accurate at low fat fractions. Error bars represent measured standard deviation.

