

Introduction
The present short review will address three questions: What is the evidence that breast density is a major risk factor for breast cancer? How is breast density best assessed and what factors influence breast density? How do you utilize breast density in the preventative setting?
What is the evidence that breast density is a major risk factor for breast cancer?
McCormack and dos Santos Silva have reviewed the data on the association of percentage mammographic density (PMD) with risk of breast cancer in a systematic meta-analysis of data for >14,000 cases and 226,000 noncases from 42 studies [1]. They found that PMD was consistently associated with risk of breast cancer. Associations were stronger in studies in the general population, rather than in symptomatic women, for percentage density rather than for Wolfe categories, and in studies of incident cancer rather than prevalent cancer. The breast cancer risk associated with density did not differ by age, menopausal status or ethnicity and cannot be explained by the masking of cancers by dense tissue [2].
A total of 10 cohort studies have been reported to date, all carried out as case-control studies nested within cohorts that used quantitative methods to classify PMD [2-10]. The interval between the mammogram used to classify PMD and the date of diagnosis of breast cancer varied from 1 year to 10 years. Methods of classifying PMD in analysis varied among these studies, but all showed a substantial increase in breast cancer risk across over the partitions of PMD examined, with most odds ratios being between 4 and 5. PMD is associated with a risk of breast cancer at screening and between screening examinations [2,11].
Mammographic density expressed as either a percentage of the area of the breast (PMD) or as the area of dense tissue (cm2) in a mammogram are both positively associated with risk of breast cancer, but PMD is the stronger association [5].
Conclusion
PMD has a consistent strong influence on breast cancer risk, is independent of other risk factors, has a larger gradient in risk than most other risk factors, has an increased risk that extends for at least 10 years after the mammogram used to classify density, and carries a risk not explained by masking.
How is breast density best assessed and what factors influence breast density?
Measurement
Examples of mammographic density of varying extents are shown in Figure 1. Four principal methods have been used to date to assess mammographic density. First, Wolfe described four categories of density: N1, predominately fat; P1 and P2, ductal prominence in, respectively, <25% or >25% of the breast; and DY, extensive dysplasia [12,13]. The Breast Imaging Reporting and Data System (BI-RADS) also has four categories: 1, predominately fat; 2, scattered densities; 3, heterogeneously dense; and 4, extremely dense [14]. The third method involves visual estimation of the proportion of the breast occupied by radiologically dense breast tissue [15]. Finally, there are computer-assisted methods of measurement (Cumulus and other similar programs) based on interactive thresholding [16]. Cumulus is illustrated in Figure 2. An observer places thresholds at the edge of the breast (red line) and at the edge of the density (green line), and the areas so defined are recoded by the computer. PMD is calculated by dividing the dense area by the total area times 100 and can be treated in analysis as either a continuous variable or a categorical variable.
Figure 1.

Examples of mammographic density. (a) 0%. (b) <10%. (c) <25%. (d) <50%. (e) <75%. (f) >75%.
Figure 2.
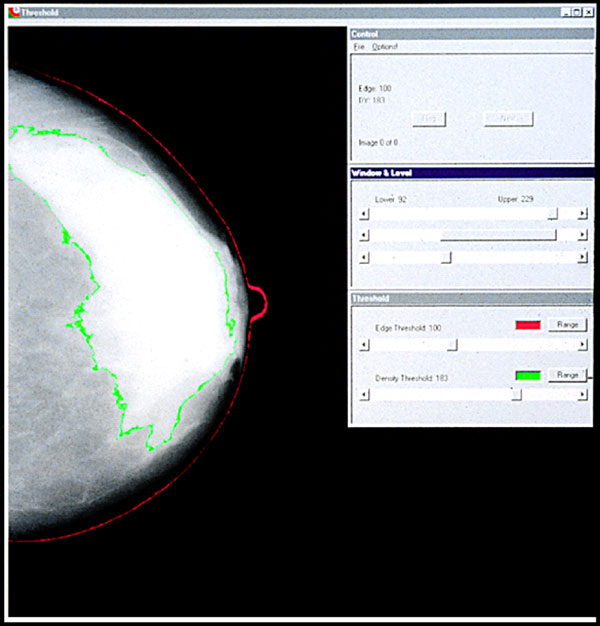
Computer-assisted measurement of mammographic density.
These methods differ in their ease of application and in their reliability. The Wolfe categories have largely been replaced in the literature by quantitative methods of classification or by the BI-RADS score, which is completed in a large proportion of routine mammograms in the USA. Quantitative assessment of mammograms using Cumulus or other similar methods of measurement has been used mostly in research studies as it requires a trained observer and digitized film images, or processed images from digital mammography. Reliability between readers in the use of these methods is modest for BI-RADS (κ ~ 0.6) [17], intermediate for quantitative estimation by a radiologist (intraclass correlation coefficient ~0.7) [15] and good for Cumulus (intraclass correlation coefficient ~0.9 or greater) [2].
All current methods of assessment use only the two dimensions of the mammogram, and none take into account variations in image production or processing. Despite this, the methods have all been shown to have an association with risk of breast cancer. Quantitative methods are more time consuming than are qualitative methods, and require a trained observer and digitized images, but are more reliable and can provide information about the separate components of the ratio of percentage density.
Conclusion
All current methods of assessing density have advantages and disadvantages, and no method is ideal. All methods have measurement error. The breast cancer risk associated with density may be substantially underestimated. Densities on digital and film mammograms are not identical.
Influences
Age, mammographic density and incidence of breast cancer
The distribution of PMD changes with increasing age [5,18,19], reflecting the reduction in glandular tissue and accompanying increase in fat that occurs with increasing age [20]. The decline in density with age may seem paradoxical, as breast cancer incidence increases with age, but this apparent paradox may be resolved by reference to a model of breast cancer incidence proposed by Pike and colleagues [21]. The model is based on the concept that breast tissue age, or breast tissue exposure rather than chronological age, is the relevant measure for describing the incidence of breast cancer. Breast tissue age is closely associated with exposure of breast tissue to hormones and growth factors, and to the effects that menarche, pregnancy and menopause have on these exposures and on susceptibility to carcinogens. As shown in Figure 3, breast tissue exposure is greatest at the time of menarche, falls with pregnancy, is further reduced in the perimenopausal period, and is least after the menopause. Pike and colleagues showed that cumulative breast tissue exposure, given by the area under the curve in Figure 3a, describes the age-incidence curve for breast cancer shown in Figure 3b.
Figure 3.

(a) Pike model of mammary carcinogenesis. (b) Age-specific incidence of breast cancer - observed and predicted by the Pike model. Reprinted by permission from Macmillan Publishers Ltd: Pike and colleagues, Nature © 1983 [21].
Breast cancer risk factors
As further described below, average PMD is reduced with increasing age [19]. PMD is also less extensive in women who are parous, less extensive in those with a larger number of live births [22,23], and is reduced by menopause [18,24,25]. After adjustment for age and other potential influences, a family history of breast cancer is associated with more extensive PMD [26]. PMD has consistently been found to be inversely associated with body weight [27,28], and greater birth weight and adult height are positively associated both with PMD [27,29] and with an increased risk of breast cancer [30-33].
Factors that change mammographic density
Combined hormone therapy, but not estrogen alone, is associated with an increase in risk of breast cancer [34] and an increase in PMD [35,35-37]. PMD in postmenopausal women is reduced by tamoxifen [38] and raloxifene [39], drugs that reduce breast cancer incidence, and PMD in premenopausal women is reduced by a gonadotrophin-releasing hormone agonist [40]. Cuzick and colleagues, in a study published to date only in abstract form, have reported an association between a reduction in PMD following use of tamoxifen and reduction in breast cancer incidence [41]. The clinical or biological significance of any given change in PMD is currently unknown.
Heritability
The breast cancer risk factors whose influence was described above account for only 20 to 30% of the variation in PMD observed in the population [24], and genetic factors might explain some of the unexplained variation of PMD. In collaboration with John Hopper (Melbourne, Australia) we carried out two twin studies of substantial size to estimate the proportion of the variance in PMD that could be explained by genetic factors [42]. Mammograms were obtained in 951 twin pairs aged 40 to 70 years, in Australia and North America, and information was collected on the factors associated with variations in PMD. Details of the findings are given in [42]. The proportion of the residual variation in PMD accounted for by additive genetic factors (heritability) was estimated to be 60% (95% confidence interval = 54 to 66%) from Australian twins, 67% (95% confidence interval = 59 to 75%) from North American twins, and 63% (95% confidence interval = 59 to 67%) in the combined studies [42]. These data thus provide an almost exact replication of evidence that is consistent with a strong genetic influence on PMD. A subsequent study with 553 twin pairs found similar results [43]. PMD thus has the characteristics of a quantitative trait.
Conclusion
The association of density with age resembles Pike and colleagues' log-incidence breast tissue exposure model. Mammographic density is influenced by several factors, including drugs that influence the risk of breast cancer. The genetic influence is stronger than that of other risk factors.
How do you use breast density in the preventive setting?
The ability to predict the future occurrence of disease in individuals allows the improved design and application of preventive strategies, improved planning of intervention trials, revision of the risks and benefits associated with preventive interventions, and improved clinical decision-making [44]. Cardiovascular medicine provides a paradigm for an approach to disease prevention based on risk prediction, and modification of risk factors has been estimated to account for approximately one-half of the 40% reduction in age-specific mortality from cardiovascular disease observed over the past three decades, the remainder of the reduction being attributed to improvements in treatment [45].
Prediction of the risk of developing breast cancer is less well developed than for cardiovascular disease [44]. The most widely used current method of predicting risk of breast cancer is the Gail model [46], which includes age, age at menarche, age at first live birth, number of previous benign breast biopsies, and number of first-degree relatives with breast cancer.
The addition of PMD (described by the BI-RADS method) to the Gail model increased the concordance statistic from 0.607 to 0.642, more than did the addition of the seven SNPs found reproducibly to be associated with breast cancer (concordance statistic = 0.632). These levels of individual prediction are no better than modest.
Conclusion
Individual risk prediction using PMD is modest, with or without other risk factors. Group risk prediction may be useful in trial design. Mammographic density has not yet been shown to meet criteria for surrogacy in any setting.
Future research
Research in progress in several centers can be expected in the next few years to identify the genetic variants associated with differences in PMD [47]. Events in early life are believed to have an important influence on later risk of breast cancer [48], and research into the factors that influence breast development and breast tissue composition in early life may provide insight into more effective methods of breast cancer prevention [49]. Despite the recognized importance of PMD as a risk factor for breast cancer, we still lack reliable, automated, quantitative and volumetric methods of measuring this risk factor - the development of such methods should be a high priority.
Abbreviations
BI-RADS: Breast Imaging Reporting and Data System; PMD: percentage mammographic density; SNP: single nucleotide polymorphism.
Competing interests
The authors declare that they have no competing interests.
Acknowledgements
This article has been published as part of Breast Cancer Research Volume 11 Suppl 3 2009: Controversies in Breast Cancer 2009. The full contents of the supplement are available online at http://breast-cancer-research.com/content/11/S3.
References
- McCormack VA, dos Santos Silva I. Breast density and parenchymal patterns as markers of breast cancer risk: a meta-analysis. Cancer Epidemiol Biomarkers Prev. 2006;15:1159–1169. doi: 10.1158/1055-9965.EPI-06-0034. [DOI] [PubMed] [Google Scholar]
- Boyd NF, Guo H, Martin LJ, Sun L, Stone J, Fishell E, Jong RA, Hislop G, Chiarelli A, Minkin S, Yaffe MJ. Mammographic density and the risk and detection of breast cancer. N Engl J Med. 2007;356:227–236. doi: 10.1056/NEJMoa062790. [DOI] [PubMed] [Google Scholar]
- Kato I, Beinart C, Bleich A, Su S, Kim M, Toniolo PG. A nested case-control study of mammographic patterns, breast volume, and breast cancer (New York City, NY, United States) Cancer Causes Control. 1995;6:431–438. doi: 10.1007/BF00052183. [DOI] [PubMed] [Google Scholar]
- Saftlas AF, Hoover RN, Brinton LA, Szklo M, Olson DR, Salane M, Wolfe JN. Mammographic densities and risk of breast cancer. Cancer. 1991;67:2833–2838. doi: 10.1002/1097-0142(19910601)67:11<2833::AID-CNCR2820671121>3.0.CO;2-U. [DOI] [PubMed] [Google Scholar]
- Byrne C, Schairer C, Wolfe J, Parekh N, Salane M, Brinton LA, Hoover R, Haile R. Mammographic features and breast cancer risk: effects with time, age, and menopause status. J Natl Cancer Inst. 1995;87:1622–1629. doi: 10.1093/jnci/87.21.1622. [DOI] [PubMed] [Google Scholar]
- Torres-Mejia G, De Stavola B, Allen D, Perez-Gavilan J, Ferreira J, Fentiman I, dos Santos Silva I. Mammographic features and subsequent risk of breast cancer: a comparison of qualitative and quantitative evaluations in the Guernsey prospective studies. Cancer Epidemiol Biomarkers Prev. 2005;14:1052–1059. doi: 10.1158/1055-9965.EPI-04-0717. [DOI] [PubMed] [Google Scholar]
- van Gils CH, Hendriks JH, Otten JD, Holland R, Verbeek AL. Parity and mammographic breast density in relation to breast cancer risk: indication of interaction. Eur J Cancer Prev. 2000;9:105–111. doi: 10.1097/00008469-200004000-00006. [DOI] [PubMed] [Google Scholar]
- Thomas DB, Carter RA, Bush WH Jr, Ray RM, Stanford JL, Lehman CD, Daling JR, Malone K, Davis S. Risk of subsequent breast cancer in relation to characteristics of screening mam-mograms from women less than 50 years of age. Cancer Epidemiol Biomarkers Prev. 2002;11:565–571. [PubMed] [Google Scholar]
- Maskarinec G, Pagano I, Lurie G, Kolonel LN. A longitudinal investigation of mammographic density: the multiethnic cohort. Cancer Epidemiol Biomarkers Prev. 2006;15:732–739. doi: 10.1158/1055-9965.EPI-05-0798. [DOI] [PubMed] [Google Scholar]
- Boyd NF, Byng JW, Jong RA, Fishell EK, Little LE, Miller AB, Lockwood GA, Tritchler DL, Yaffe MJ. Quantitative classification of mammographic densities and breast cancer risk: results from the Canadian National Breast Screening Study. J Natl Cancer Inst. 1995;87:670–675. doi: 10.1093/jnci/87.9.670. [DOI] [PubMed] [Google Scholar]
- Sala E, Warren R, McCann J, Duffy S, Day N, Luben R. Mammographic parenchymal patterns and mode of detection: implications for the breast screening programme. J Med Screen. 1998;5:207–212. doi: 10.1136/jms.5.4.207. [DOI] [PubMed] [Google Scholar]
- Wolfe JN. Breast patterns as an index of risk for developing breast cancer. Am J Roentgenol. 1976;126:1130–1139. doi: 10.2214/ajr.126.6.1130. [DOI] [PubMed] [Google Scholar]
- Wolfe JN. Risk for breast cancer development determined by mammographic parenchymal pattern. Cancer. 1976;37:2486–2492. doi: 10.1002/1097-0142(197605)37:5<2486::AID-CNCR2820370542>3.0.CO;2-8. [DOI] [PubMed] [Google Scholar]
- American College of Radiology. Breast Imaging Reporting and Data System (BI-RADS) American College of Radiology; 1998. http://www.biraids.at [Google Scholar]
- Jong R, Fishell E, Little L, Lockwood G, Boyd NF. Mammographic signs of potential relevance to breast cancer risk: the agreement of radiologists' classification. Eur J Cancer Prev. 1996;5:281–286. doi: 10.1097/00008469-199608000-00008. [DOI] [PubMed] [Google Scholar]
- Byng JW, Boyd NF, Fishell E, Jong RA, Yaffe MJ. The quantitative analysis of mammographic densities. Phys Med Biol. 1994;39:1629–1638. doi: 10.1088/0031-9155/39/10/008. [DOI] [PubMed] [Google Scholar]
- Kerlikowske K, Grady D, Barclay J, Frankel SD, Ominsky SH, Sickles EA, Ernster V. Variability and accuracy in mammographic interpretation using the American college of radiology breast imaging reporting and data system. J Natl Cancer Inst. 1998;90:1801–1809. doi: 10.1093/jnci/90.23.1801. [DOI] [PubMed] [Google Scholar]
- Grove JS, Goodman MJ, Gilbert FI, Clyde D. Factors associated with breast structures in breast cancer patients. Cancer. 1979;43:1895–1899. doi: 10.1002/1097-0142(197905)43:5<1895::AID-CNCR2820430546>3.0.CO;2-R. [DOI] [PubMed] [Google Scholar]
- Wolfe JN. Breast parenchymal patterns and their changes with age. Radiology. 1976;121(3 Pt 1):545–552. doi: 10.1148/121.3.545. [DOI] [PubMed] [Google Scholar]
- Milanese TR, Hartmann LC, Sellers TA, Frost MH, Vierkant RA, Maloney SD, Pankratz VS, Degnim AC, Vachon CM, Reynolds CA, Thompson RA, Melton LJ, Goode EL, Visscher DW. Age-related lobular involution and risk of breast cancer. J Natl Cancer Inst. 2006;98:1600–1607. doi: 10.1093/jnci/djj439. [DOI] [PubMed] [Google Scholar]
- Pike MC, Krailo MD, Henderson BE, Casagrande JT, Hoel DG. 'Hormonal' risk factors, 'breast tissue age' and the age-incidence of breast cancer. Nature. 1983;303:767–770. doi: 10.1038/303767a0. [DOI] [PubMed] [Google Scholar]
- Boyd NF, Lockwood GA, Byng J, Tritchler DL, Yaffe M. Mammographic densities and breast cancer risk. Cancer Epidemiol Biomarkers Prev. 1998;7:1133–1144. [PubMed] [Google Scholar]
- Martin LJ, Boyd N. Potential mechanisms of breast cancer risk associated with mammographic density: hypotheses based on epidemiological evidence. Breast Cancer Res. 2008;10:1–14. doi: 10.1186/bcr1831. [DOI] [PMC free article] [PubMed] [Google Scholar]
- Vachon CM, Kuni CC, Anderson K. Association of mammographically defined percent breast density with epidemiologic risk factors for breast cancer (United States) Cancer Causes Control. 2000;11:653–662. doi: 10.1023/A:1008926607428. [DOI] [PubMed] [Google Scholar]
- Boyd N, Martin L, Stone J, Little L, Minkin S, Yaffe M. A longitudinal study of the effects of menopause on mammographic features. Cancer Epidemiol Biomarkers Prev. 2002;11(10 Pt 1):1048–1053. [PubMed] [Google Scholar]
- Ziv E, Shepherd J, Smith-Bindman R, Kerlikowske K. Mammographic breast density and family history of breast cancer. J Natl Cancer Inst. 2005;95:556–558. doi: 10.1093/jnci/95.7.556. [DOI] [PubMed] [Google Scholar]
- Brisson J, Morrison AS, Kopans DB. Height and weight, mammographic features of breast tissue, and breast cancer risk. Am J Epidemiol. 1984;119:371–381. doi: 10.1093/oxfordjournals.aje.a113755. [DOI] [PubMed] [Google Scholar]
- Grove JS, Goodman MJ, Gilbert F, Mi MP. Factors associated with mammographic pattern. Br J Radiol. 1985;58:21–25. doi: 10.1259/0007-1285-58-685-21. [DOI] [PubMed] [Google Scholar]
- Sellers TA, Vachon CM, Pankratz VS, Janney CA, Fredericksen Z, Brandt KR, Huang Y, Couch FJ, Kushi LH, Cerhan JR. Association of childhood and adolescent anthropometric factors, physical activity, and diet with adult mammographic breast density. Am J Epidemiol. 2007;166:456–464. doi: 10.1093/aje/kwm112. [DOI] [PubMed] [Google Scholar]
- Lawlor DA, Okasha M, Gunnell D, Smith GD, Ebrahim S. Associations of adult measures of childhood growth with breast cancer: findings from the British Women's Heart and Health Study. Br J Cancer. 2003;89:81–87. doi: 10.1038/sj.bjc.6600972. [DOI] [PMC free article] [PubMed] [Google Scholar]
- Hunter DJ, Willett WC. Diet, body size, and breast cancer. Epidemiol Rev. 1993;15:110–132. doi: 10.1093/oxfordjournals.epirev.a036096. [DOI] [PubMed] [Google Scholar]
- Ekbom A. Growing evidence that several human cncers may originate in utero. Semin Cancer Biol. 1998;8:237–244. doi: 10.1006/scbi.1998.0073. [DOI] [PubMed] [Google Scholar]
- Ekbom A, Thurfjell E, Hsieh CC, Trichopoulos D, Adami HO. Perinatal characteristics and adult mammographic patterns. Int J Cancer. 1995;61:177–180. doi: 10.1002/ijc.2910610206. [DOI] [PubMed] [Google Scholar]
- Chlebowski RT, Hendrix SL, Langer RD, Stefanick ML, Gass M, Lane D, Rodabough RJ, Gilligan MA, Cyr MG, Thomson CA, Khandekar J, Petrovitch H, McTiernan A. WHI Investigators. Influence of estrogen plus progestin on breast cancer and mammography in healthy postmenopausal women. The Women's Health Initiative Randomized Trial. JAMA. 2003;289:3243–3253. doi: 10.1001/jama.289.24.3243. [DOI] [PubMed] [Google Scholar]
- Greendale GA, Reboussin BA, Slone S, Wasilauskas C, Pike MC, Ursin G. Postmenopausal hormone therapy and change in mammographic density. J Natl Cancer Inst. 2003;95:30–37. doi: 10.1093/jnci/95.1.30. [DOI] [PubMed] [Google Scholar]
- Lundstrom E, Wilczek B, von Palffy Z, Soderqvist G, von Schoultz B. Mammographic breast density during hormone replacement therapy: differences according to treatment. Am J Obstet Gynecol. 1999;181:348–352. doi: 10.1016/S0002-9378(99)70560-0. [DOI] [PubMed] [Google Scholar]
- Rutter CM, Mandelson MT, Laya MB, Seger DJ, Taplin S. Changes in breast density associated with initiation, discontinuation, and continuing use of hormone replacement therapy. JAMA. 2001;285:171–176. doi: 10.1001/jama.285.2.171. [DOI] [PubMed] [Google Scholar]
- Cuzick J, Warwick J, Pinney E, Warren RML, Duffy SW. Tamoxifen and breast density in women at increased risk of breast cancer. J Natl Cancer Inst. 2004;96:621–628. doi: 10.1093/jnci/djh106. [DOI] [PubMed] [Google Scholar]
- Freedman M, San Martin J, O'Gorman J, Eckert S, Lippman ME, Lo SB, Walls EL, Zeng J. Digitized mammography: a clinical trial of postmenopausal women randomly assigned to receive raloxifene, estrogen, or placebo. J Natl Cancer Inst. 2001;93:51–56. doi: 10.1093/jnci/93.1.51. [DOI] [PubMed] [Google Scholar]
- Spicer DV, Ursin G, Parisky YR, Pearce JG, Shoupe D, Pike A, Pike MC. Changes in mammographic densities induced by a hormonal contraceptive designed to reduce breast cancer risk. J Natl Cancer Inst. 1994;86:431–436. doi: 10.1093/jnci/86.6.431. [DOI] [PubMed] [Google Scholar]
- Cuzick J, Warwick J, Pinney L, Warren R, Cawthorn S, Howell A, Duffy S. Change in breast density as a biomarker of breast cancer risk reduction [abstract] Proc Natl Acad Sci USA. 2008;0:1. [Google Scholar]
- Boyd NF, Dite GS, Stone J, Gunasekara A, English DR, McCredie MRE, Giles GG, Tritchler D, Chiarelli A, Yaffe MJ, Hopper JL. Heritability of mammographic density, a risk factor for breast cancer. N Engl J Med. 2002;347:886–894. doi: 10.1056/NEJMoa013390. [DOI] [PubMed] [Google Scholar]
- Ursin G, Lillie EO, Lee E, Cockburn M, Schork NJ, Cozen W, Parisky YR, Hamilton AS, Astrahan MA, Mack T. The relative importance of genetics and environment on mammographic density. Cancer Epidemiol Biomarkers Prev. 2009;18:102–112. doi: 10.1158/1055-9965.EPI-07-2857. [DOI] [PubMed] [Google Scholar]
- Freedman AN, Seminara D, Gail MH, Hartge P, Colditz GA, Ballard-Barbash R, Pfeiffer M. Cancer risk prediction models: a workshop on development, evaluation, and application. J Natl Cancer Inst. 2005;97:715–723. doi: 10.1093/jnci/dji128. [DOI] [PubMed] [Google Scholar]
- Ford ES, Ajani UA, Croft JB, Critchley JA, Labarthe DR, Kottke TE, Giles WH, Capewell S. Explaining the decrease in U.S. deaths from coronary disease, 1980-2000. N Engl J Med. 2007;356:2388–2398. doi: 10.1056/NEJMsa053935. [DOI] [PubMed] [Google Scholar]
- Gail MH, Brinton LA, Byar DP, Corle DK, Green SB, Schairer C, Mulvihill JJ. Projecting individualized probabilities of developing breast cancer for white females who are being examined annually. J Natl Cancer Inst. 1989;81:1879–1886. doi: 10.1093/jnci/81.24.1879. [DOI] [PubMed] [Google Scholar]
- Kelemen LE, Sellers TA, Vachon CM. Can genes for mammographic density inform cancer aetiology? Nat Rev Cancer. 2008;8:812–823. doi: 10.1038/nrc2466. [DOI] [PMC free article] [PubMed] [Google Scholar]
- Colditz GA, Frazier LA. Models of breast cancer show that risk is set by events of early life: prevention efforts much shift focus [review] Cancer Epidemiol Biomarkers Prev. 1995;4:567–571. [PubMed] [Google Scholar]
- Boyd NF, Martin LJ, Chavez S, Gunasekara A, Salleh A, Melnichouk O, Yaffe M, Minkin S, Bronskill MJ. Breast-tissue composition and other risk factors for breast cancer in young women: a cross-sectional study. Lancet Oncol. 2009;10:569–580. doi: 10.1016/S1470-2045(09)70078-6. [DOI] [PubMed] [Google Scholar]