

Abstract
Kirsten RAS (KRAS) is a small GTPase that plays a key role in Ras/mitogen-activated protein kinase signaling; somatic mutations in KRAS are frequently found in many cancers. The most common KRAS mutations result in a constitutively active protein. Accurate detection of KRAS mutations is pivotal to the molecular diagnosis of cancer and may guide proper treatment selection. Here, we describe a two-step KRAS mutation screening protocol that combines whole-genome amplification (WGA), high-resolution melting analysis (HRM) as a prescreen method for mutation carrying samples, and direct Sanger sequencing of DNA from formalin-fixed, paraffin-embedded (FFPE) tissue, from which limited amounts of DNA are available. We developed target-specific primers, thereby avoiding amplification of homologous KRAS sequences. The addition of herring sperm DNA facilitated WGA in DNA samples isolated from as few as 100 cells. KRAS mutation screening using high-resolution melting analysis on wgaDNA from formalin-fixed, paraffin-embedded tissue is highly sensitive and specific; additionally, this method is feasible for screening of clinical specimens, as illustrated by our analysis of pancreatic cancers. Furthermore, PCR on wgaDNA does not introduce genotypic changes, as opposed to unamplified genomic DNA. This method can, after validation, be applied to virtually any potentially mutated region in the genome.
Kirsten RAS (KRAS) is a member of the Ras gene family, which encodes small G proteins with intrinsic GTPase activity. These proteins play a key role in Ras/mitogen-activated protein kinase signaling, which is involved in multiple pathways including proliferation, differentiation, and apoptosis. It has been suggested that KRAS mutations are related, with a random CpG island methylation pattern that may lead to CpG island methylator phenotype-low tumors.1
KRAS is an important etiological factor in many cancers. Somatic mutations in KRAS are found in 75 to 90% of pancreatic adenocarcinomas, 35 to 50% of colorectal carcinomas, and 30% of lung adenocarcinomas. In other cancers, KRAS mutations are less frequent or only present in specific subsets, such as subsets of bladder, endometrial, thyroid, and liver cancers.2,3,4,5 Mutations in KRAS negatively predict success of anti-epidermal growth factor receptor therapies. Gain-of-function KRAS mutations lead to epidermal growth factor receptor-independent activation of intracellular signaling pathways, resulting in tumor cell proliferation, protection against apoptosis, increased invasion and metastasis, and activation of tumor-induced angiogenesis.6
The most common KRAS mutations are found in exon 2 (codons 12 and 13) and, more rarely, in exon 3 (codons 59 and 61). These mutations alter the conformation of KRAS, causing impaired GTPase activity that results in constitutive activation of the protein.7 Accurate detection of KRAS mutations is pivotal to the molecular diagnosis of cancer and may guide proper treatment selection. KRAS mutation analysis has been shown to be important for disease stratification in clinical trials of epidermal growth factor receptor inhibitors8,9 and for the detection of MUTYH mutants after KRAS mutation prescreening.10 In the near future, it is expected that at least 50% of all recurrent colorectal tumors will be screened for KRAS mutations.
Various methods have been described for the detection of KRAS mutations, such as a mutagenic PCR assay,11 pyrosequencing,12 and real-time PCR13; however, Sanger sequencing on PCR products remains the golden standard.6,14,15 Recently, high-resolution melting (HRM) analysis was added as a method for mutation scanning and genotyping,16,17,18 including analysis of KRAS mutations in heterogenic tumor populations. This method is a valuable addition to Sanger-based sequencing, because it detects heterozygous genetic changes in samples containing only 10% of mutant cells,19,20,21 whereas direct Sanger sequencing requires the mutation to be present at a level of at least 20% of the sample.20 HRM also has been described for methylation detection and the detection of internal tandem duplications.22,23 In addition, HRM has a high sensitivity and specificity for the detection of variants in a background of normal DNA.24,25
For mutation analysis, the majority of tissues are available as formalin-fixed, paraffin-embedded (FFPE) material. The genomic DNA (gDNA) that can be isolated from FFPE tissue is usually fragmented because of formalin fixation. At the same time, for most cases, including preoperative biopsies, the available (FFPE) tissue, and thus gDNA, is limiting. As a result, the number of genetic assays that can be performed is restricted.26,27
One approach designed to overcome this limitation is whole-genome amplification (WGA), which ideally generates a new whole genome sample of amplified DNA (wgaDNA) that is indistinguishable from the original, but with a higher DNA concentration.28 We used a primer extension preamplification method that has been successfully applied to FFPE tissue.29,30 We have studied HRM as a prescreening method for somatic mutation detection in combination with WGA on gDNA from FFPE tissue. This approach is sensitive and specific and can open the archives for large scale mutation analysis.31,32,33,34
Materials and Methods
Samples
We previously performed somatic KRAS mutation analyses in a series of colorectal cancers.35 A subset of 60 tumors (14 FF and 46 FFPE) was used to determine the sensitivity and specificity of the assay on FF and FFPE tissue. The tumor cell percentage in the series was 50 to 80%. Additionally, we isolated gDNA from five preoperative biopsies from pancreatic adenocarcinomas and three 0.3-mm tissue punch cores that were isolated from matching resection specimens. Guided by an H&E-stained section, the extremely small tumor fields were dissected from the biopsies.
DNA was extracted using a standard proteinase K method as described elsewhere.36 All samples were handled according to the medical ethical guidelines described in the Code Proper Secondary Use of Human Tissue established by the Dutch Federation of Medical Sciences (http://www.federa.org, accessed June 2, 2009).
gDNA concentrations were measured using PICOgreen (Invitrogen/Molecular Probes, Leiden, The Netherlands) according to the manufacturer's protocol. For WGA and PCR, gDNA is brought to a standard concentration of 5 ng/μl in 10 mmol/L Tris (pH 8.0) and 0.1 mmol/L EDTA and is stored in two-dimensional bar-coded sample tubes (Thermo Fisher Scientific, NH) for process standardization and robotic analysis.
Whole-Genome Amplification
Primer extension preamplification WGA using thermostable DNA polymerases (KBioscience, Hoddesdon, UK) was performed according to the manufacturer's protocol using 25 ng of gDNA in a final reaction volume of 25 μl. For FFPE samples and other samples from which limited gDNA was available, herring sperm DNA (Promega Madison, WI) was added to a final concentration of 2 ng/μl per reaction. Thermal cycling was performed in a Bio-Rad I-cycler. After an initial denaturation step of 10 minutes at 94°C, 40 cycles of 30 seconds at 94°C, 30 seconds at 37°C, and ramping at a speed of 0.1°C/s to 55°C and 4 minutes at 55°C were performed.
Mutation Scanning and Detection
Oligonucleotides were obtained from Operon (Ebersberg, Germany). The primer sequences for the amplification of KRAS codons 12 and 13 were KRAS_C1213_M13F (5′-TGTAAAACGACGGCCAGT-TCGACCCAGGATCCAACTT-GCTGAAAATGACTGAATATAAACTTG-3′) and KRAS_C1213_M13R (5′-CAGGAAACAGCTATGACCATGA-TCCAGTACTTGAGAGAATTCCATC-TAGCTGTATCGTCAAGGCACTC-3′. Stuffer sequences (underlined) were added between M13 tails (in italics) and the KRAS-specific part (bold) of the primer. The total length of the amplicon, inclusive of the M13 tails and stuffers, is 166 bp.
Duplicate PCRs were performed in 10-μl reactions in white 96-well plates (AB0800/W; ABgene, Epsom, UK) that are suitable for HRM. The reactions included iQ Supermix (catalog number 170-8860; Bio-Rad, Veenendaal, NL), 2 pmol primers, and 1 μmol/L SYTO9 (Invitrogen). PCRs were performed with an initial denaturation step of 10 minutes at 95°C, followed by 40 cycles of 5 seconds at 95°C, 10 seconds at 60°C, and 10 seconds at 72°C, and a final elongation step of 10 minutes at 72°C.
Sanger DNA sequencing was performed on gDNA and wgaDNA at the sequence core of the Leiden Genome Technology Center, using the same PCR products as those submitted to HRM. Before Sanger sequencing, PCR fragments were purified using a filter system according to the manufacturer's protocol (Montage; Millipore, Millerica, MA). DNA was eluted in 25 μl of sterile water. Sanger sequencing was subsequently performed with 5 to 10 ng of DNA and 6 pmol of an M13 primer (PR_M13F: 5′-TGTAAAACGACGGCCAGT-3′; PR_M13R: 5′-CAGGAAACAGCTATGACC-3′) on an ABI 3700 DNA Analyzer using Big Dye Terminator Chemistry (Applied Biosystems, Carlsbad, CA). All sequences were visually analyzed with Mutation Surveyor DNA variant analysis software (version 2.61; Softgenetics, State College, PA).
HRM was performed in a LightScanner (Idaho Technology, Salt Lake City, UT) after the addition of 15 μl of mineral oil (Sigma-Aldrich, St. Louis, MO); Light Scanner software (version 1.1.0.566; Idaho Technology) was used for analysis. High-salt addition,24 1.5 μl of 1 M KCl, and 0.5 M Tris-HCl (pH 8.0) was added post-PCR to the 10-μl PCR products, followed by four additional temperature cycles (30 seconds 94°C, 30 seconds 72°C). The sensitivity and specificity of the HRM were calculated. The sensitivity was determined as the number of true positives divided by the sum of the true positive and false negative samples. The specificity of the samples was determined as the number of true negatives divided by the sum of the true negatives and false positives. Mineral oil overlay, high-salt addition, and PCR product purification was performed in a post-PCR setting.
Results
Detection of KRAS Mutations in gDNA Using HRM
KRAS PCR and HRM analyses were performed on gDNA in duplicate before and after the addition of high salt. All duplicate samples with an aberrant melting pattern were identified as carrying a possible mutation. The data were compared with the Sanger-sequencing results. An overview of the results is shown in Table 1. Six FFPE samples (5%) failed to give an interpretable HRM pattern in one of the duplicates. None of these gave contradictory sequence results and was included in further analysis (Supplemental Table S1, see http://jmd.amjpathol.org).
Table 1.
False Positives and False Negatives in KRAS (wga)HRM and Sequencing
| ID | Type | gDNA | wgaDNA (no salt) | (g-wga)DNA sequencing |
|---|---|---|---|---|
| 972 | FF | Var | Var (FN) | c12. GGT>GTT |
| 755 | FF | WT | FP (WT*) | WT |
| 819 | FF | WT | WT (FP) | WT |
| 826 | FF | WT | WT (FP) | WT |
| 977 | FFPE | Var | Var (FN) | c13. GGC>GAC |
| 998 | FFPE | Var | Var (FN*) | c13. GGC>GAC |
| 811 | FFPE | Var | Var (FN) | c12. GGT>GAT |
| 761 | FFPE | Var | Var (FN) | c12. GGT>GTT |
| 768 | FFPE | Var | Var (FN) | c12. GGT>GTT |
| 785 | FFPE | Var | Var (FN) | c12. GGT>GTT |
| 806 | FFPE | Var | Var (FN*) | c12. GGT>GTT |
| 013 | FFPE | FP | WT (WT) | WT |
| 023 | FFPE | FP | WT (WT) | WT |
| 750 | FFPE | FP* | WT (FP) | WT |
| 958 | FFPE | FP | WT (WT) | WT |
| 975 | FFPE | FP* | WT (WT) | WT |
Overview of false positives (FPs) and false negatives (FNs) in HRM performed with or without WGA. In the wgaDNA column, the HRM results on samples without the addition of high salt are shown between brackets. HRM results after the addition of a high salt solution on samples performed in duplicate (results for samples marked with an asterisk are based on a single result). The last column shows the concordant gDNA and wgaDNA results of Sanger sequencing on one of the duplicates. The complete overview of all tested samples is listed in Supplemental Table S1 at http://jmd.amjpathol.org. FF, freshly frozen tissue; Var, KRAS-variant; WT, KRAS wild-type.
In the set of 60 tumors, we observed an overall sensitivity of 100% (33 of 33) and a specificity of 81% (22 of 27) for the detection of KRAS codon 12 or 13 variations. The specificity of gDNA from FFPE tissue (75%; 15 of 20) was lower than in FF tissue (100%; 7 of 7), probably as a result of poor gDNA quality intrinsic to the material (Table 2).
Table 2.
Sensitivity and Specificity in (wga)HRM
| FFPE |
FF |
Combined |
||||
|---|---|---|---|---|---|---|
| DNA type | gDNA | wgaDNA | gDNA | wgaDNA | gDNA | wgaDNA |
| WT | 15 | 20 (19) | 7 | 6 (5) | 22 | 26 (24) |
| Var | 26 | 26 (19) | 7 | 7 (6) | 33 | 33 (25) |
| FN | 0 | 0 (7) | 0 | 0 (1) | 0 | 0 (8) |
| FP | 5 | 0 (1) | 0 | 1 (2) | 5 | 1 (3) |
| All | 46 | 14 | 60 | |||
| % Sensitivity | 100 | 100 (73) | 100 | 100 (86) | 100 | 100 (76) |
| % Specificity | 75 | 100 (95) | 100 | 86 (71) | 81 | 96 (89) |
Sensitivity and specificity calculated for HRM in FFPE, freshly frozen (FF), and combined FFPE and FF gDNA and wgaDNA samples in the presence of high salt. In the wgaDNA columns, HRM results on samples without the addition of high salt are shown between brackets. FP, false positives; FN, false negative; Var, KRAS-variant; WT, KRAS wild-type.
HRM on WGA DNA from Archival Tissues
To evaluate the sensitivity and specificity of HRM on WGA-treated DNA from tumor specimens of different origins and quality, we performed WGA on the gDNA samples with known KRAS mutation status. To assess the DNA quality pre- and post-WGA, a multiplex PCR containing three fragments (150, 255, and 511 bp) was performed. In all of the samples, at least the 255-bp band was visible (data not shown).
Herring sperm DNA was added up to 50 ng to all samples before WGA as driver DNA to prevent the amplification of excess small random PCR products.
After WGA, 1/1, 1/5, and 1/10 dilutions of the wgaDNA were made to determine the amount of input wgaDNA that was required for HRM PCR. The addition of 2 μl of the 1/5 dilution to a 10-μl PCR gave the best results, and we were able to detect the different mutations in control samples (Figure 1).
Figure 1.
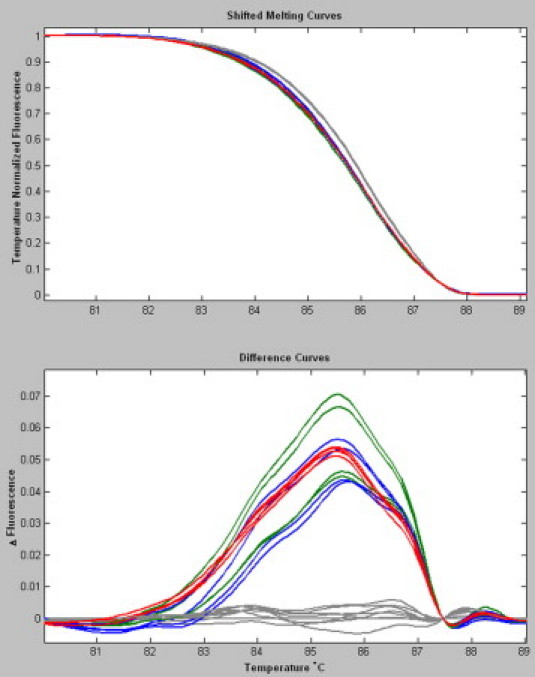
HRM curves in samples treated with or without WGA. HRM shifted melting curves and difference curves of three different KRAS codon 12 and 13 mutations in duplicate, with or without WGA treatment. g.35G>A (p.12G>D) DNA lower green, wgaDNA upper green; g.38G>A (p.13G>D) DNA lower blue, wgaDNA upper blue; g.35G>T (p.12G>V) red; and a series of eight wild-type samples (gray).
We combined 25 ng of gDNA with 25 ng of herring sperm DNA in each WGA reaction for the subset of 60 tumors. In these experiments, the researchers were blinded to the HRM and Sanger sequence results obtained for the gDNA samples. Subsequently, KRAS PCR was performed in duplicate, and HRM analysis was performed before and after high-salt addition. Three samples (2.5%) failed to give an interpretable HRM pattern in one set of the duplicates. For each product, one of the duplicates was purified and Sanger sequenced. HRM and resequencing of the WGA PCR samples revealed no discrepancies with the original samples (Table 1 and Supplemental Table S1, see http://jmd.amjpathol.org). The sensitivity and specificity of the HRM was calculated. WGA-HRM proved to be 100% (33 of 33) sensitive and 96% (26 of 27) specific in the presence of post-PCR high salt. Without high salt, the sensitivity and specificity were lower (76% (25 of 33) and 89% (24 of 27), respectively) (Table 2).
Detection Limits for HRM of wgaDNA
To determine the limits of HRM to detect a possible KRAS mutation in wgaDNA from FFPE tissue, we performed WGA on a twofold serial dilution of gDNA carrying a g.35GGT>GTT (p.12G>V) mutation. The gDNA input ranged from 10 to 0.08 ng, the latter corresponding to the gDNA equivalent of ∼10 to 12 cells. After WGA, HRM was performed in duplicate on WGA samples diluted 1/5. A mutant allele was detected in WGA products corresponding with 600 pg (equivalent to ∼100 cells) or higher. HRM on wgaDNA originating from lower input gDNA resulted in low fluorescence of the mutant allele, thus impairing the analysis and interpretation. We performed direct Sanger sequencing on all wgaDNA samples. The KRAS mutation was found in all dilutions, although the mutant allele was difficult to identify due to background noise in samples with lower than 600 pg input gDNA. KRAS mutations were easily detected in sequences from WGA PCR isolates corresponding to 100 cells or more (Figure 2).29
Figure 2.
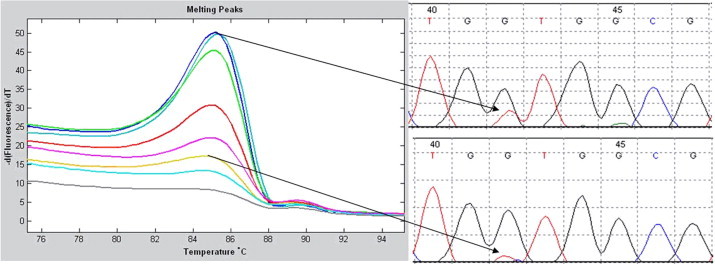
Detection limit of KRAS mutations in a PCR of serial diluted wgaDNA. Left panel: Twofold serial dilution of gDNA starting with 10 ng (upper curve) to 0.08 ng of input (lowest curve) shows the detection limit for KRAS mutations in a PCR on wgaDNA. Upper right panel: Sanger sequence on wgaDNA corresponds with 10 ng of gDNA input in the WGA. Lower right panel: Sanger sequence on wgaDNA corresponds with 0.625 ng of (±100 cells) gDNA input in the WGA.
KRAS Mutation Detection in Pancreatic Adenocarcinomas
We further evaluated KRAS HRM and Sanger sequencing in wgaDNA from archived clinical specimens. gDNA from pancreatic adenocarcinomas was isolated from a single slide (samples 1a–4a) and from four combined slides (1b–4b). For comparison, we also isolated gDNA from three 0.3-mm tissue punch cores that were isolated from matching resection specimens. After gDNA isolation, this sample was split into a minor (5f) and major (5p) fraction; the major fraction contained a sixfold higher gDNA concentration. As expected, the gDNA concentrations of the isolates were low or not measurable (Table 3). Subsequently, WGA was performed on the fractions, and HRM and Sanger sequencing were performed on the wgaDNA. For the samples 1b and fp, gDNA was also tested.
Table 3.
WGA HRM Results in Histological Specimens from Pancreatic Adenocarcinomas
| Sample | Tumor sections | Concentration gDNA (ng/μl) | wgaDNA HRM + high salt | wgaDNA sequence |
|---|---|---|---|---|
| 1a | 1 | 2.2 | VAR | WT |
| 1b | 4 | 9.9 | WT | WT |
| 2a | 1 | Low | Low signal | c12. GGT>GAT |
| 2b | 4 | 2.9 | Low signal | c12. GGT>GAT |
| 3a | 1 | Low | Low signal | c12. GGT>GTT |
| 3b | 4 | 3.3 | VAR | c12. GGT>GTT |
| 4a | 1 | Low | Low signal | WT |
| 4b | 4 | Low | Low signal | WT |
| 5f | Fraction | Low | VAR | c12. GGT>GAT |
| 5p | Three punches | 12.1 | VAR | c12. GGT>GAT |
Concentration measurements are performed on gDNA isolates from a single slide (samples 1a–4a), from four combined slides (samples 1b–4b), and from a matching resection specimen with minor (5f) and major fractions (5p). For a number of samples, the gDNA concentration was not measurable (low). WGA is performed on all samples. HRM results in the presence of high salt. Samples marked low signal had an unclear HRM pattern. The last column shows the KRAS Sanger-sequencing results on the purified HRM sample.
WGA was performed on 10 ng of gDNA and adjusted to 50 ng with herring sperm DNA. For samples where the gDNA concentration was not measurable, 15 μl of the raw isolate was added to the WGA reaction together with 50 ng with herring sperm DNA. HRM revealed concordant KRAS-variant curves in samples 5f and 5p, whereas samples 1a and 1b gave contradictory results for HRM. The variant curves for sample 3b were interpretable, whereas the signals for samples 2a, 2b, 3a, 4a, and 4b were low and could not be interpreted. Purification and resequencing of all of the HRM PCR products was possible in all cases and revealed that samples 2 and 5 carried the g.35G>A (p.G12D) mutation, sample 3 was a g.35G>T (p.G12V) mutant, and samples 1 and 4 were wild type. These results indicated that the HRM results for sample 1a were false positive (Table 3).
Discussion
Accurate detection of KRAS mutations is pivotal to the molecular diagnosis of cancer and may guide proper treatment selection. We have developed a standard WGA and PCR protocol for KRAS mutation detection in gDNA derived from FFPE tissue, for which limited amounts of gDNA are available. HRM analysis is used for mutation prescreening, and Sanger sequencing is used for mutation detection.
The most frequently mutated codons, 12 and 13, in exon 2 are located in a region that is highly homologous to regions on chromosomes 6 and 16. To prevent the amplification of pseudogene sequences we used primers based on nonhomologous nucleotides.10,37,38 Addition of universal M13 tails to the primers increased the specificity and fidelity of the PCR10,39 and allows the use of uniform sequencing primers. Since the KRAS amplicon length is only 75 nucleotides and short PCR fragments can be difficult to sequence, we added additional stuffer sequences to the primers between the M13 tails and the KRAS-specific part of the primer. These stuffers bear no homology to any known human sequence. Since the amplicons are very small, the length of each step of the PCR cycle was shortened, resulting in a 40-cycle PCR that lasted just over 1 hour.
We evaluated LCGreen and SYTO9 for HRM and found that both dyes were capable of detecting different KRAS variations. SYTO9 has been reported to have some advantages in terms of dye stability, dye-dependent PCR inhibition, and selective detection of amplicons during DNA melting curve analysis of multiplex PCR.40 In our experiments, SYTO9 appeared to improve the quality of the melting curves, since the fluorescence signal was ∼50% higher and the duplicate curves fit more tightly together. Therefore, we decided to use SYTO9 in subsequent experiments (Supplemental Figure S1, see http://jmd.amjpathol.org).
It has been reported that high-resolution analysis of amplicon melting is limited by any Tm variance, including differences in salt concentrations (arising from evaporation during processing or differences in buffers used for DNA preparation) and any variation in instrument temperature.41 Furthermore, poor DNA quality, low input, and positional effects of the samples on the microtiter plate might lead to false positive or false negative HRM measurements.42 Therefore, all samples were analyzed in duplicate. For calibration, at least two wild-type samples were analyzed in each experiment.
We observed an overall sensitivity of 100% (33 of 33) and a specificity of 81% (22 of 27) for the detection of KRAS codon 12 or 13 variations. However, the specificity of gDNA from FFPE tissue (75%,15 of 20) was lower than in FF tissue (100%, 7 of 7), probably as a result of poor gDNA quality intrinsic to the material (Table 2). From the melting curve behavior, it was not possible to determine the specific mutation, likely due to tumor percentage and tumor heterogeneity. Consequently, all samples with possible mutations were Sanger sequenced to identify the nature of the mutation. Sanger sequencing was directly performed on the purified HRM PCR product without repeating the PCR, which saves time and money.
KRAS mutations are frequently found in ductal pancreatic cancers,4 making it important in clinical practice to identify KRAS mutations in cytological pancreatic juice with only minimal amounts of cells and limiting (FFPE) gDNA.26,27,43 One approach designed to overcome the limited number of assays possible on this material is WGA. Different types of WGA methods are available. Multiple strand displacement amplification (MDA) has been described as most reliable for genotyping, giving highest call rates, best genomic coverage, and lowest amplification bias. However, this method has the disadvantage that the specific performance largely depends on input DNA quality, making it less suitable to efficiently amplify DNA extracted from FFPE material.44 Primer extension preamplification primer extension preamplification-based WGA has been successfully applied to FFPE tissue.29,30 although some bias as result of the WGA has been observed.12 We used a primer extension preamplification-based WGA method that is known to have high sequencing accuracy and is less dependent on the quality of the input DNA;45 however, we observed that, with low amounts of input (<10 ng) gDNA and with poor quality FFPE samples, the random primers in the WGA produce excess random wgaDNA and primer dimer products. These additional products impaired HRM and subsequent Sanger sequencing. Therefore, we added nonhomologous herring sperm to the human DNA for all samples before WGA to suppress primer dimer formation. The combined human and herring DNA input in the WGA reaction was ∼50 ng. Herring sperm DNA has low homology to human KRAS, and we did not detect any PCR product with the described primers in a control PCR. Therefore, herring sperm DNA addition should not interfere with KRAS HRM or Sanger sequencing. We compared the Sanger-sequencing results on gDNA and wgaDNA. This did not reveal any discrepancies and showed that KRAS mutation screening using HRM on wgaDNA from FFPE tissue is concordant with the non-wgaDNA results. With this approach, we were able to WGA minimal amounts of gDNA with reliable results. We observed that, with <2 ng of FFPE-derived gDNA, input in the WGA reaction HRM on wgaDNA becomes unreliable. The PCR products still produced reliable Sanger sequences. This was also demonstrated by the pancreatic adenocarcinomas, which failed for HRM but gave good Sanger sequence results. This showed that HRM is very sensitive for DNA variants, however, to obtain interpretable results, higher amounts of DNA are required in the HRM than in Sanger sequencing (Table 3).
We optimized HRM in wgaDNA by the post-PCR addition of high salt.24 This resulted in enhanced heteroduplex formation, better discrimination of the mutation carrier during analysis, and 100% sensitivity and 96% specificity. Cho et al34 reported that HRM on wgaDNA results in a higher false positive rate and reduced sensitivity and specificity. We show that high-salt addition before analysis overcomes this problem, thereby making this approach suitable for high-throughput mutation prescreening.
A potential disadvantage of our method could be that PCR plates need to be opened before analysis to add mineral oil and high-salt solution, although opening the plates for PCR cleanup before sequencing is standard practice. To minimize the chance of PCR amplicon contamination pre- and post-PCR rooms were strictly separated, and we used a direct PCR to avoid pseudogene amplification rather than nested PCR for KRAS mutation detection.37,38
Another factor to consider is tumor heterogeneity. In samples with lower tumor percentage and low amount of the mutated allele, automated Sanger sequence analysis could miss variants, whereas HRM could still detect mutations in gDNA and wgaDNA from samples with low tumor percentages. Vossen et al24 show that DNA variations could be detected in sample mixtures with as little as 5% variation fraction, although 30% and higher gave more reliable results in HRM. Because HRM in samples with unknown tumor percentage is limited in predicting the exact KRAS variant, samples with HRM variations have to be sequenced for variant determination. A combination of low tumor percentage and low input concentrations in the WGA might cause HRM dropout or contradictory results in the duplicate reactions, making careful (re)analysis of the Sanger sequencing indispensable (Figure 2). For these types of samples, alternative mutation detection after HRM prescreening should be considered such as pyrosequencing, which is known to be more sensitive than Sanger sequencing.12 Allele specific real-time PCR is also a very sensitive method, but it has the disadvantage of detection known (KRAS) variants only while our approach envisions application for de novo mutation screening.46 For these types of samples, sensitivity and specificity have to be calculated in relation to results obtained with pyrosequencing or real-time PCR.
One can argue that the majority of laboratories can obtain a sufficient amount of DNA for KRAS mutation screening from even tiny biopsies without the WGA step. This assertion might be true in some cases. However, in a time when personalized medicine is the norm, KRAS mutation detection may be one test in a series of many, and in that respect, WGA may be an excellent method by which to increase the initial amount of DNA that can be used for the analysis of any potentially mutated region in the genome.47
Finally, the required equipment for this approach is limited to two standard thermal cyclers (one dedicated to WGA and another in a separate room for PCR), dedicated HRM equipment, and a sequencing facility. HRM on wgaDNA from FFPE origin can be a cost-effective prescreening method, since only potential variants found after HRM need resequencing. Therefore, HRM, in combination with WGA and sequencing, is a strong tool for KRAS mutation screening of samples with partially degraded or low-yield DNA, as is often found in pathology archives.
Acknowledgements
KBioscience provided the WGA kit.
Footnotes
Supported by Dutch Cancer Society grant UL 2003-2807.
The funders had no role in study design, data collection and analysis, decision to publish, or preparation of the manuscript. The resulting method is the subject of European patent application number 08075728.9/EPO 8075728.
Supplemental material for this article can be found on http://jmd.amjpathol.org.
Web Extra Material
References
- 1.Nosho K, Irahara N, Shima K, Kure S, Kirkner GJ, Schernhammer ES, Hazra A, Hunter DJ, Quackenbush J, Spiegelman D, Giovannucci EL, Fuchs CS, Ogino S. Comprehensive biostatistical analysis of CpG island methylator phenotype in colorectal cancer using a large population-based sample 9. PLoS One. 2008;3:e3698. doi: 10.1371/journal.pone.0003698. [DOI] [PMC free article] [PubMed] [Google Scholar]
- 2.Fearon ER. K-ras gene mutation as a pathogenetic and diagnostic marker in human cancer. J Natl Cancer Inst. 1993;85:1978–1980. doi: 10.1093/jnci/85.24.1978. [DOI] [PubMed] [Google Scholar]
- 3.Barault L, Veyrie N, Jooste V, Lecorre D, Chapusot C, Ferraz JM, Lievre A, Cortet M, Bouvier AM, Rat P, Roignot P, Faivre J, Laurent-Puig P, Piard F. Mutations in the RAS-MAPK. PI(3)K (phosphatidylinositol-3-OH kinase) signaling network correlate with poor survival in a population-based series of colon cancers. Int J Cancer. 2008;122:2255–2259. doi: 10.1002/ijc.23388. [DOI] [PubMed] [Google Scholar]
- 4.Shibata D, Capella G, Perucho M. Mutational activation of the c-K-ras gene in human pancreatic carcinoma. Baillieres Clin Gastroenterol. 1990;4:151–169. doi: 10.1016/0950-3528(90)90044-h. [DOI] [PubMed] [Google Scholar]
- 5.Di Nicolantonio F, Martini M, Molinari F, Sartore-Bianchi A, Arena S, Saletti P, De Dosso S, Mazzucchelli L, Frattini M, Siena S, Bardelli A. Wild-type BRAF is required for response to panitumumab or cetuximab in metastatic colorectal cancer. J Clin Oncol. 2008;26:5705–5712. doi: 10.1200/JCO.2008.18.0786. [DOI] [PubMed] [Google Scholar]
- 6.van Krieken JH, Jung A, Kirchner T, Carneiro F, Seruca R, Bosman FT, Quirke P, Flejou JF, Hansen TP, de Hertogh G, Jares P, Langner C, Hoefler G, Ligtenberg M, Tiniakos D, Tejpar S, Bevilacqua G, Ensari A. KRAS mutation testing for predicting response to anti-EGFR therapy for colorectal carcinoma: proposal for an European quality assurance program. Virchows Arch. 2009;454:233–235. doi: 10.1007/s00428-008-0665-y. [DOI] [PubMed] [Google Scholar]
- 7.Bos JL. ras oncogenes in human cancer: a review. Cancer Res. 1989;49:4682–4689. [PubMed] [Google Scholar]
- 8.Spano JP, Milano G, Vignot S, Khayat D. Potential predictive markers of response to EGFR-targeted therapies in colorectal cancer. Crit Rev Oncol Hematol. 2008;66:21–30. doi: 10.1016/j.critrevonc.2007.11.005. [DOI] [PubMed] [Google Scholar]
- 9.Lievre A, Bachet JB, Le Corre D, Boige V, Landi B, Emile JF, Cote JF, Tomasic G, Penna C, Ducreux M, Rougier P, Penault-Llorca F, Laurent-Puig P. KRAS mutation status is predictive of response to cetuximab therapy in colorectal cancer. Cancer Res. 2006;66:3992–3995. doi: 10.1158/0008-5472.CAN-06-0191. [DOI] [PubMed] [Google Scholar]
- 10.van Puijenbroek M, Nielsen M, Tops CM, Halfwerk H, Vasen HF, Weiss MM, van Wezel T, Hes FJ, Morreau H. Identification of patients with (atypical) MUTYH-associated polyposis by KRAS2 c. 34G>T prescreening followed by MUTYH hotspot analysis in formalin-fixed paraffin-embedded tissue. Clin Cancer Res. 2008;14:139–142. doi: 10.1158/1078-0432.CCR-07-1705. [DOI] [PubMed] [Google Scholar]
- 11.Boldrini L, Gisfredi S, Ursino S, Camacci T, Baldini E, Melfi F, Fontanini G. Mutational analysis in cytological specimens of advanced lung adenocarcinoma: a sensitive method for molecular diagnosis. J Thorac Oncol. 2007;2:1086–1090. doi: 10.1097/JTO.0b013e31815ba1fa. [DOI] [PubMed] [Google Scholar]
- 12.Ogino S, Kawasaki T, Brahmandam M, Yan L, Cantor M, Namgyal C, Mino-Kenudson M, Lauwers GY, Loda M, Fuchs CS. Sensitive sequencing method for KRAS mutation detection by pyrosequencing. J Mol Diagn. 2005;7:413–421. doi: 10.1016/S1525-1578(10)60571-5. [DOI] [PMC free article] [PubMed] [Google Scholar]
- 13.Amicarelli G, Shehi E, Makrigiorgos GM, Adlerstein D. FLAG assay as a novel method for real-time signal generation during PCR: application to detection and genotyping of KRAS codon 12 mutations. Nucleic Acids Res. 2007;35:e131. doi: 10.1093/nar/gkm809. [DOI] [PMC free article] [PubMed] [Google Scholar]
- 14.Brink M, de Goeij AF, Weijenberg MP, Roemen GM, Lentjes MH, Pachen MM, Smits KM, de Bruine AP, Goldbohm RA, van den Brandt PA. K-ras oncogene mutations in sporadic colorectal cancer in The Netherlands Cohort Study. Carcinogenesis. 2003;24:703–710. doi: 10.1093/carcin/bgg009. [DOI] [PubMed] [Google Scholar]
- 15.Chien CC, Chen SH, Liu CC, Lee CL, Yang RN, Yang SH, Huang CJ. Correlation of K-ras codon 12 mutations in human feces and ages of patients with colorectal cancer (CRC) Transl Res. 2007;149:96–102. doi: 10.1016/j.trsl.2006.09.006. [DOI] [PubMed] [Google Scholar]
- 16.Gundry CN, Vandersteen JG, Reed GH, Pryor RJ, Chen J, Wittwer CT. Amplicon melting analysis with labeled primers: a closed-tube method for differentiating homozygotes and heterozygotes. Clin Chem. 2003;49:396–406. doi: 10.1373/49.3.396. [DOI] [PubMed] [Google Scholar]
- 17.Zhou L, Wang L, Palais R, Pryor R, Wittwer CT. High-resolution DNA melting analysis for simultaneous mutation scanning and genotyping in solution. Clin Chem. 2005;51:1770–1777. doi: 10.1373/clinchem.2005.054924. [DOI] [PubMed] [Google Scholar]
- 18.Ririe KM, Rasmussen RP, Wittwer CT. Product differentiation by analysis of DNA melting curves during the polymerase chain reaction. Anal Biochem. 1997;245:154–160. doi: 10.1006/abio.1996.9916. [DOI] [PubMed] [Google Scholar]
- 19.Nomoto K, Tsuta K, Takano T, Fukui T, Fukui T, Yokozawa K, Sakamoto H, Yoshida T, Maeshima AM, Shibata T, Furuta K, Ohe Y, Matsuno Y. Detection of EGFR mutations in archived cytologic specimens of non-small cell lung cancer using high-resolution melting analysis. Am J Clin Pathol. 2006;126:608–615. doi: 10.1309/N5PQNGW2QKMX09X7. [DOI] [PubMed] [Google Scholar]
- 20.Do H, Krypuy M, Mitchell PL, Fox SB, Dobrovic A. High resolution melting analysis for rapid and sensitive EGFR and KRAS mutation detection in formalin fixed paraffin embedded biopsies. BMC Cancer. 2008;8:142. doi: 10.1186/1471-2407-8-142. [DOI] [PMC free article] [PubMed] [Google Scholar]
- 21.Krypuy M, Ahmed AA, Etemadmoghadam D, Hyland SJ, DeFazio A, Fox SB, Brenton JD, Bowtell DD, Dobrovic A. High resolution melting for mutation scanning of TP53 exons 5–8. BMC Cancer. 2007;7:168. doi: 10.1186/1471-2407-7-168. [DOI] [PMC free article] [PubMed] [Google Scholar]
- 22.Wojdacz TK, Dobrovic A. Methylation-sensitive high resolution melting (MS-HRM): a new approach for sensitive and high-throughput assessment of methylation. Nucleic Acids Res. 2007;35:e41. doi: 10.1093/nar/gkm013. [DOI] [PMC free article] [PubMed] [Google Scholar]
- 23.Vaughn CP, Elenitoba-Johnson KS. High-resolution melting analysis for detection of internal tandem duplications. J Mol Diagn. 2004;6:211–216. doi: 10.1016/S1525-1578(10)60512-0. [DOI] [PMC free article] [PubMed] [Google Scholar]
- 24.Vossen RH, Aten E, Roos A, den Dunnen JT. High-resolution melting analysis (HRMA)—more than just sequence variant screening 4. Hum Mutat. 2009;30:860–866. doi: 10.1002/humu.21019. [DOI] [PubMed] [Google Scholar]
- 25.Krypuy M, Newnham GM, Thomas DM, Conron M, Dobrovic A. High resolution melting analysis for the rapid and sensitive detection of mutations in clinical samples: kRAS codon 12 and 13 mutations in non-small cell lung cancer. BMC Cancer. 2006;6:295. doi: 10.1186/1471-2407-6-295. [DOI] [PMC free article] [PubMed] [Google Scholar]
- 26.Marchetti A, Merlo G, Buttitta F, Pellegrini S, Callahan R, Bistocchi M, Squartini F. Detection of DNA mutations in acid formalin-fixed paraffin-embedded archival tumor specimens by polymerase chain reaction-single strand conformation polymorphism analysis. Cancer Detect Prev. 1995;19:278–281. [PubMed] [Google Scholar]
- 27.Farrand K, Jovanovic L, Delahunt B, McIver B, Hay ID, Eberhardt NL, Grebe SK. Loss of heterozygosity studies revisited: prior quantification of the amplifiable DNA content of archival samples improves efficiency and reliability. J Mol Diagn. 2002;4:150–158. doi: 10.1016/S1525-1578(10)60696-4. [DOI] [PMC free article] [PubMed] [Google Scholar]
- 28.Hughes S, Arneson N, Done S, Squire J. The use of whole genome amplification in the study of human disease. Prog Biophys Mol Biol. 2005;88:173–189. doi: 10.1016/j.pbiomolbio.2004.01.007. [DOI] [PubMed] [Google Scholar]
- 29.Heinmoller E, Liu Q, Sun Y, Schlake G, Hill KA, Weiss LM, Sommer SS. Toward efficient analysis of mutations in single cells from ethanol-fixed, paraffin-embedded, and immunohistochemically stained tissues. Lab Invest. 2002;82:443–453. doi: 10.1038/labinvest.3780437. [DOI] [PubMed] [Google Scholar]
- 30.Bataille F, Rummele P, Dietmaier W, Gaag D, Klebl F, Reichle A, Wild P, Hofstadter F, Hartmann A. Alterations in p53 predict response to preoperative high dose chemotherapy in patients with gastric cancer. Mol Pathol. 2003;56:286–292. doi: 10.1136/mp.56.5.286. [DOI] [PMC free article] [PubMed] [Google Scholar]
- 31.Willmore C, Holden JA, Zhou L, Tripp S, Wittwer CT, Layfield LJ. Detection of c-kit-activating mutations in gastrointestinal stromal tumors by high-resolution amplicon melting analysis. Am J Clin Pathol. 2004;122:206–216. doi: 10.1309/4E6U-YBY6-2N2F-CA6N. [DOI] [PubMed] [Google Scholar]
- 32.Willmore-Payne C, Holden JA, Tripp S, Layfield LJ. Human malignant melanoma: detection of BRAF- and c-kit-activating mutations by high-resolution amplicon melting analysis. Hum Pathol. 2005;36:486–493. doi: 10.1016/j.humpath.2005.03.015. [DOI] [PubMed] [Google Scholar]
- 33.Bastien R, Lewis TB, Hawkes JE, Quackenbush JF, Robbins TC, Palazzo J, Perou CM, Bernard PS. High-throughput amplicon scanning of the TP53 gene in breast cancer using high-resolution fluorescent melting curve analyses and automatic mutation calling. Hum Mutat. 2008;29:757–764. doi: 10.1002/humu.20726. [DOI] [PubMed] [Google Scholar]
- 34.Cho MH, Ciulla D, Klanderman BJ, Raby BA, Silverman EK. High-resolution melting curve analysis of genomic and whole-genome amplified DNA. Clin Chem. 2008;54:2055–2058. doi: 10.1373/clinchem.2008.109744. [DOI] [PMC free article] [PubMed] [Google Scholar]
- 35.Lips EH, van Eijk R, de Graaf EJ, Doornebosch PG, de Miranda NF, Oosting J, Karsten T, Eilers PH, Tollenaar RA, van Wezel T, Morreau H. Progression and tumor heterogeneity analysis in early rectal cancer. Clin Cancer Res. 2008;14:772–781. doi: 10.1158/1078-0432.CCR-07-2052. [DOI] [PubMed] [Google Scholar]
- 36.Lips EH, Dierssen JW, van Eijk R, Oosting J, Eilers PH, Tollenaar RA, de Graaf EJ, van't Slot R, Wijmenga C, Morreau H, van Wezel T. Reliable high-throughput genotyping and loss-of-heterozygosity detection in formalin-fixed, paraffin-embedded tumors using single nucleotide polymorphism arrays. Cancer Res. 2005;65:10188–10191. doi: 10.1158/0008-5472.CAN-05-2486. [DOI] [PubMed] [Google Scholar]
- 37.Sommerer F, Vieth M, Markwarth A, Rohrich K, Vomschloss S, May A, Ell C, Stolte M, Hengge UR, Wittekind C, Tannapfel A. Mutations of BRAF and KRAS2 in the development of Barrett's adenocarcinoma. Oncogene. 2004;23:554–558. doi: 10.1038/sj.onc.1207189. [DOI] [PubMed] [Google Scholar]
- 38.van Puijenbroek M, van Asperen CJ, van Mil A, Devilee P, van Wezel T, Morreau H. Homozygosity for a CHEK2*1100delC mutation identified in familial colorectal cancer does not lead to a severe clinical phenotype. J Pathol. 2005;206:198–204. doi: 10.1002/path.1764. [DOI] [PubMed] [Google Scholar]
- 39.Boutin-Ganache I, Raposo M, Raymond M, Deschepper CF. M13-tailed primers improve the readability and usability of microsatellite analyses performed with two different allele-sizing methods. Biotechniques. 2001;31:24–26. 28. [PubMed] [Google Scholar]
- 40.Herrmann MG, Durtschi JD, Bromley LK, Wittwer CT, Voelkerding KV. Amplicon DNA melting analysis for mutation scanning and genotyping: cross-platform comparison of instruments and dyes. Clin Chem. 2006;52:494–503. doi: 10.1373/clinchem.2005.063438. [DOI] [PubMed] [Google Scholar]
- 41.Seipp MT, Pattison D, Durtschi JD, Jama M, Voelkerding KV, Wittwer CT. Quadruplex genotyping of F5, F2, and MTHFR variants in a single closed tube by high-resolution amplicon melting. Clin Chem. 2008;54:108–115. doi: 10.1373/clinchem.2007.097121. [DOI] [PubMed] [Google Scholar]
- 42.Sieben NL, ter Haar NT, Cornelisse CJ, Fleuren GJ, Cleton-Jansen AM. PCR artifacts in LOH and MSI analysis of microdissected tumor cells. Hum Pathol. 2000;31:1414–1419. [PubMed] [Google Scholar]
- 43.Shi C, Fukushima N, Abe T, Bian Y, Hua L, Wendelburg BJ, Yeo CJ, Hruban RH, Goggins MG, Eshleman JR. Sensitive and quantitative detection of KRAS2 gene mutations in pancreatic duct juice differentiates patients with pancreatic cancer from chronic pancreatitis, potential for early detection. Cancer Biol Ther. 2008;7:353–360. doi: 10.4161/cbt.7.3.5362. [DOI] [PubMed] [Google Scholar]
- 44.Lage JM, Leamon JH, Pejovic T, Hamann S, Lacey M, Dillon D, Segraves R, Vossbrinck B, Gonzalez A, Pinkel D, Albertson DG, Costa J, Lizardi PM. Whole genome analysis of genetic alterations in small DNA samples using hyperbranched strand displacement amplification and array-CGH. Genome Res. 2003;13:294–307. doi: 10.1101/gr.377203. [DOI] [PMC free article] [PubMed] [Google Scholar]
- 45.Dietmaier W, Hartmann A, Wallinger S, Heinmoller E, Kerner T, Endl E, Jauch KW, Hofstadter F, Ruschoff J. Multiple mutation analyses in single tumor cells with improved whole genome amplification. Am J Pathol. 1999;154:83–95. doi: 10.1016/S0002-9440(10)65254-6. [DOI] [PMC free article] [PubMed] [Google Scholar]
- 46.Gibson NJ. The use of real-time PCR methods in DNA sequence variation analysis. Clin Chim Acta. 2006;363:32–47. doi: 10.1016/j.cccn.2005.06.022. [DOI] [PubMed] [Google Scholar]
- 47.Lim EH, Zhang SL, Li JL, Yap WS, Howe TC, Tan BP, Lee YS, Wong D, Khoo KL, Seto KY, Tan L, Agasthian T, Koong HN, Tam J, Tan C, Caleb M, Chang A, Ng A, Tan P. Using whole genome amplification (WGA) of low-volume biopsies to assess the prognostic role of EGFR. KRAS, p53, and CMET mutations in advanced-stage non-small cell lung cancer (NSCLC) J Thorac Oncol. 2009;4:12–21. doi: 10.1097/JTO.0b013e3181913e28. [DOI] [PubMed] [Google Scholar]
Associated Data
This section collects any data citations, data availability statements, or supplementary materials included in this article.