

Abstract
KRAS mutation testing before anti-epidermal growth factor receptor therapy of metastatic colorectal cancer has become mandatory in Europe. However, considerable uncertainty exists as to which methods for detection can be applied in a reproducible and economically sound manner in the routine diagnostic setting. To answer this question, we examined 263 consecutive routine paraffin slide specimens. Genomic DNA was extracted from microdissected tumor tissue. The DNA was analyzed prospectively by Sanger sequencing and array analysis as well as retrospectively by melting curve analysis and pyrosequencing; the results were correlated to tissue characteristics. The methods were then compared regarding the reported results, costs, and working times. Approximately 40% of specimens contained KRAS mutations, and the different methods reported concordant results (κ values >0.9). Specimens harboring fewer than 10% tumor cells showed lower mutation rates regardless of the method used, and histoanatomical variables had no influence on the frequency of the mutations. Costs per assay were higher for array analysis and melting curve analysis when compared with the direct sequencing methods. However, for sequencing methods equipment costs were much higher. In conclusion, Sanger sequencing, array analysis, melting curve analysis, and pyrosequencing were equally effective for routine diagnostic KRAS mutation analysis; however, interpretation of mutation results in conjunction with histomorphologic tissue review and on slide tumor tissue dissection is required for accurate diagnosis.
With respect to mortality, colorectal cancer (CRC) is the second most common malignancy in Europe.1 Locally confined CRCs without lymph node metastases may be cured by surgery alone, whereas nodal positive CRCs need adjuvant radio- and/or chemotherapy. Of the latter, approximately 34% of cases will experience a relapse of the disease despite adjuvant therapy, recurring locally or as distant metastases and often becoming incurable. Palliative chemotherapy is frequently applied to prolong patient survival.2
The two monoclonal antibodies cetuximab and panitumumab3 targeting the epidermal growth factor receptor (EGFR) have been approved in Europe and the United States for the palliative treatment of metastatic CRC in 2004 and 2007, respectively. The efficacy of small-molecule inhibitors of EGFR, ie, gefitinib4,5 and erlotinib,6 is a matter of debate and currently being tested in clinical trials.
Much effort has been made to identify tissue based biomarkers to predict the response to anti-EGFR therapy.7,8 EGFR expression9,10 and EGFR gene amplification11,12 have been assessed as potentially useful response predictors in CRC. Only EGFR expression in CRC tissue has been routinely evaluated before therapy, but the correlation to the therapeutic response is not clear.9,10 Distinct from non-small-cell lung cancer EGFR gene mutations were reported to be infrequent in CRC.13
Somatic gain-of-function KRAS mutations have been identified as a reliable strong negative predictor for the response to anti-EGFR treatment in CRC14,15,16,17,18 and also in non-small-cell lung cancer.19 This has been explained by the fact that constitutively activated KRAS eliminates the effects of upstream EGFR inhibition. Based on these findings, the European Medicines Agency has made palliative cetuximab and panitumumab therapy of CRC dependent on KRAS wild-type status of the tumor tissue, irrespective of whether applied in combination with conventional chemotherapy or as singular drugs.
Until now, KRAS mutation analysis has been studied in experimental settings or as part of clinical trials but not in daily routine testing. Several methods for KRAS mutation testing have been described, but a substantial comparison of methods and their applicability for routine testing of heterogeneous tissue sets is missing.
In this study, we addressed these questions and we report our experiences from routine testing in a large German reference center for KRAS mutation analysis. We compared four different methods of KRAS mutation analysis and included the impact of tissue characteristics. Due to the increasing demands on the turnaround time and throughput of diagnostic tests as well as the critical economical situation in the health care systems, we put specific emphasis on the hands-on and total times and costs per sample, and also the potential equipment costs.
Materials and Methods
Study Population and Histology
This study included formalin-fixed and paraffin-embedded tumor samples from 263 patients with CRC. Tissue samples were referred to our Department of Surgical and Molecular Pathology from all over Germany between December 2007 and March 2008 for routine KRAS testing. The study was been approved by the Charité Ethics Committee under the title “Retrospective analysis of tissue samples by immunohistochemistry and molecular biological techniques” (EA1/06/2004).
Tissue samples had been stored for a mean period of 3 years (range, 0–10 years) before molecular analysis was performed. Four (resection specimens) or five (biopsy specimens) 3-μm-thick serial sections were cut from each paraffin block. The first and fifth section (biopsy specimens only) were stained with hematoxylin and eosin (H&E), and a histopathological diagnosis was rendered by a board-certified pathologist. The fifth section was used to confirm that sections 2 to 4 enclosed tumor tissue. The tumor area was marked on the first H&E-stained slide. The percentage of tumor of all tissue in the marked area and the relative amounts of the histoanatomical components of the tumor, ie, tumor cells, desmoplastic stroma, necrosis, and fat tissue were estimated visually; tumor-infiltrating inflammatory cells were graded as absent, mild, moderate, or abundant. Every tumor was classified and graded according to World Health Organization criteria. Distinct evaluation of histopathological features could not be performed in two cases due to the poor preservation of morphology, five additional tumors could not be graded, and for 47 tumors data on the age of tissue samples were missing.
DNA Preparation
DNA was extracted from those three slides that were not stained. Tumor-containing sections were microdissected from regions corresponding to the stained slides. DNA preparation was performed as previously described.20 In brief, microdissected tissue was transferred to 180 μl of ATL buffer (Qiagen, Hilden, Germany) and kept for 10 minutes at 95°C. After cooling to room temperature, 20 μl of proteinase K solution were added. The sample was gently mixed and incubated at 55°C until complete lysis (after about 2 hours). Further steps of DNA isolation were performed in accordance with the tissue protocol QIAamp DNA Mini Kit (Qiagen). The nucleic acids were eluted in a volume of 60 to 100 μl and DNA content was measured with a Nanodrop 1000 spectrophotometer (PeqLab, Erlangen, Germany).
Sanger Sequencing
The sequencing template was a 170-bp PCR fragment of the KRAS gene, generated with the primers KRAS F: 5′-AAGGCCTGCTGAAAATGACTG-3′ and KRAS R: 5′-AGAATGGTCCTGCACCAGTAA-3′ (Tib Molbiol, Berlin, Germany) using 100 ng to 2.5 μg of genomic DNA. PCR conditions were as follows: initial denaturation for 5 minutes at 95°C, annealing at 60°C for 1 minute, elongation at 72° for 1 minute, denaturation at 94° for 1 minute, 40 cycles, final extension 72°C for 7 minutes. Following PCR the fragments were purified by MSB Spin PCRapace (Invitek, Berlin, Germany) according to the manufacturer's instructions. Ten microliters of the purified sample were directly loaded on a 3.3% agarose gel to check the quality and yield of the reaction. A total of 8.5 ng of the PCR products was used for a sequencing reaction with Big Dye Terminator cycle sequencing mix v1.1 (Applied Biosystems, Darmstadt, Germany) according to the manufacturer's instructions. Sequencing reactions were performed for both DNA strands with the PCR oligonucleotides (5 pmol) as respective primers. Dye purification was done by alcohol/sodium acetate precipitation.
Sequence analysis was done on a 3130 genetic analyzer, software sequencing analysis 5.2 (Applied Biosystems). The obtained files were aligned and examined for mutations in codons 12 and 13 of the KRAS gene by SeqScape 2.6 software (Applied Biosystems). Respective mutations were quantified for allele frequency.
Array Analysis
The LCD-Array K-RAS 1.4 kit (Chipron, Berlin, Germany) was used. The test principle is based on the hybridization of biotinylated PCR products (spanning codons 12 and 13 of the KRAS gene) to wild-type and mutation specific capture probes, arranged as a two-dimensional array on the surface of a polymer chip. A biotin/streptavidin enzyme conjugate cascade is used to detect the specific hybridization events. Data extraction and analysis are performed with a transmission light scanning device (10-μm resolution) in combination with the SlideReader 7.0 software (Chipron).
PCR amplification took place in 25-μl volumes with SuperHoT MasterMix 2x (Bioron, Ludwigshafen, Germany) and 1 μl of the biotinylated primer mix and 1 μl of wild-type suppressor compound from the K-RAS 1.4 kit. DNA extracts, 3 μl, were used as template for all PCR amplifications without further normalization (concentration range as measured by Nanodrop, 50- 350 ng/μl). Cycling conditions were as follows: 5 minutes at 94°C; 45 cycles of 45 seconds at 94°C, 45 seconds at 60°C and 45 seconds at 72°C; and 3 minutes at 72°C. Subsequently, hybridization and staining procedures were performed according to the manufacturer's instructions (Chipron).
Melting Curve Analysis
Extracted DNA was amplified and analyzed in a LightCycler 2.0 (Roche Diagnostics, Mannheim, Germany) melting curve, reporting sequence deviations in the target region of the KRAS gene as described elsewhere.21 In brief, we used the LightMix kit (Tib Molbiol) following the instructions and comparing the melting curves for reactions containing three different concentrations of competitor, low (control), medium, and high. For samples with limited amounts of DNA the protocol was modified to use only 1 μl of DNA in 8-μl total volume. Samples showing no melting curve in any reaction were reported as not amplified/inhibited; samples showing no distinct mutation-derived peak in the medium concentration reaction and a baseline in the high concentration reaction were rated as wild type; samples showing a distinct peak in medium or high concentration reactions were reported as mutated.
Pyrosequencing
Preparation for sequencing reaction was done using the PyroMark KRAS kit (Biotage, Uppsala, Sweden) according to the manufacturer's instructions. In brief, 10 ng of genomic DNA, as well as forward and reverse KRAS PCR primers, was used for PCR amplification of the region containing codons 12 and 13. PCR cycling conditions were as follows: 95°C for15 minutes, 45 cycles of (95°C for 50 seconds, 58°C for 50 seconds, 72°C for 50 seconds) and 72°C for 10 minutes. Single-strand preparation of PCR products was done by immobilization on streptavidin-coated Sepharose beads (Amersham Biosciences, Uppsala, Sweden), using a vacuum prep tool (Biotage). After adding specific sequencing primers (PyroMark KRAS kit) samples were run on a PSQ 96 MA pyrosequencer (Biotage) and subsequently analyzed by PSQ 96MA SNP/Pyromark ID software (Biotage).
Laboratory Working Time and Costs
Laboratory working times were calculated for single assays and reflected our personal experience with these methods. Calculation of costs per assay excluded the extraction of DNA. In addition, assay costs were calculated excluding Taq polymerase, PCR buffer, and dNTPs. Pyrosequencing and Sanger sequencing as well as array analysis require standard PCR equipment; this has not been included in the calculation. Equipment costs were estimated from manufacturer's information and personal communications; exact prices can be obtained from local distributors.
Statistics
Association of mutation frequency with tissue characteristics and tumor cell content was assessed by χ2 test and χ2 test for trends, respectively. Correlation of percentage of allele frequency with tumor cell content was done by Pearson's correlation. Significance of the concordance of mutation detection with different methods was assessed by κ statistics.
Results
Study Population and Histology
Of 263 cases, 260 were forwarded for molecular analysis. In three cases no further tumor tissue was found on the H&E-stained sections. The study cohort included two colorectal adenomas (referred as carcinomas) and 258 adenocarcinomas. A total of 214 (82.9%) tumors were primary CRC specimens and 44 (17.1%) were metastases. The metastatic tumor tissue was obtained from liver (29 cases), lung (10 cases), lymph nodes (3 cases), bone marrow (1 case), and spleen (1 case). A total of 238 (92.2%) cases were resection specimens and 20 (7.8%) were biopsies. A total of 23 (9.1%) adenocarcinomas were of grade 1, 149 (59.4%) of grade 2, and 79 (31.5%) of grade 3. In seven cases grading was not possible. Twenty-five tumors (9.7%) were classified as mucinous carcinomas according to World Health Organization criteria.
On average, the microdissected tumor area, including cancer cells as well as nonepithelial tumor components, covered 62 ± 26% of the tissue sections. In 12 (4.7%) cases the tumor area covered ≤20% and in 66 (25.6%) cases ≤40% of the whole tissue section. Within the tumor area, tumor cells were estimated to account for 52 ± 17%, the desmoplastic stroma for 35 ± 18%, necrosis for 7 ± 9%, and fat tissue for 3 ± 7% of the section area. The mean content of non-neoplastic tissue entrapped by the tumor was 4 ± 10%. Abundant tumor-infiltrating inflammatory cells were found in 44 (17%) cases.
Analysis of the Somatic KRAS Genotype Using Sanger Sequencing, Array Analysis, Melting Curve Analysis, and Pyrosequencing
In most cases DNA of sufficient quality could be prepared; only in six cases a second tissue block was ordered. In one case no other tumor-bearing block was available; in this case DNA was extracted from the H&E-stained slides. Overall mean (±SD) DNA yield was 196.8 ng/μl (±142.5 ng/μl).
The somatic KRAS genotype was assessed in a blinded fashion by Sanger sequencing, array analysis, melting curve, and pyrosequencing (Figure 1A1B1C1D1E1F1G1H1I1J). Sanger sequencing (260 cases) and array analysis (235 cases) were prospectively performed for diagnostic purposes. Melting curve analysis and pyrosequencing were performed using the same DNA preparation but for 190 and 138 cases only, because the DNA from the “diagnostic” preparation was limited. We wanted to avoid divergent results caused by differences in the extraction; thus not all methods could be applied for every sample.
Figure 1.
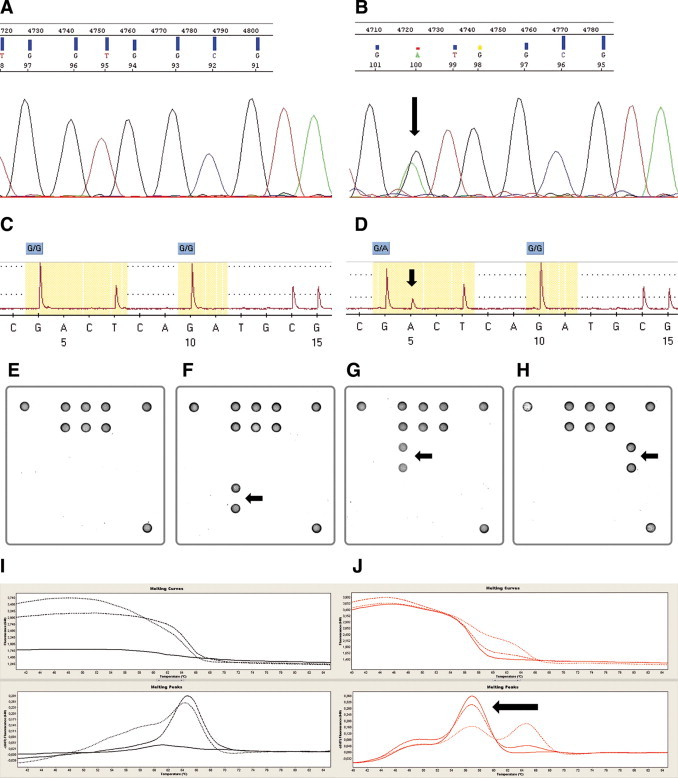
Different detection methods for KRAS mutations in codon 12/13. A and B: Sanger sequencing. Example of a wild-type (A) and a mutated (B) case (p.G12D). C and D: Pyrosequencing. Example of a wild-type (C) and a mutated (D) case (p.G12D). E–H: Array analysis. Examples of a wild-type case (E) and cases harboring a p.G13D (F), a p.G12D (G), and a p.G12C (H) mutation are presented. I and J: Melting curve analysis. Examples of a wild-type (I) and a mutated (J) case (p.G13D). Arrows indicate location of each mutation.
Sanger sequencing revealed in 108 of 260 cases (41.5%) a mutation in either codon 12 (31.9%) or codon 13 (9.6%) of the KRAS gene (Table 1). The most frequent mutations being p.G12D (12.7%), p.G12V (10.8%), and p.G13D (9.2%). Similar distributions were seen with the other three methods (see Supplemental Tables S1 and S2 at http://jmd.amjpathol.org). The array analysis identified 104 of 235 analyzed cases (44.3%) to harbor somatic mutations; melting curve analysis found 77 of 190 analyzed cases (40.5%) to be mutated; and by pyrosequencing 51 of 138 analyzed cases (37%) were reported to carry mutations (see Supplemental Tables S1 and S2 at http://jmd.amjpathol.org). A crossover comparison of the four methods yielded κ values exceeding 0.9 (Table 2). An analysis of the percentage of discordant results per method revealed that while melting curve analysis had the lowest percentage of highly discordant results (two or three mismatches: 0.52%), such results were slightly more frequent for pyrosequencing (2.89%). The percentages for Sanger sequencing (1.15%) and array analysis (2.13%) ranged in between (Figure 2). Determining the sensitivity and specificity of the respective methods was not possible due to the fact that to date no accepted gold standard for KRAS mutation detection that could serve as reference has been defined.
Table 1.
Distribution of Detected Mutations as Determined by Sanger Sequencing
| No. of cases | WT | p.G12R | p.G12C | p.G12S | p.G12V | p.G12A | p.G12D | p.G13D | p.G13C | Codon 12 | Codon 13 | Mutated total |
|---|---|---|---|---|---|---|---|---|---|---|---|---|
| 260 | 152 | 1 | 11 | 6 | 28 | 4 | 33 | 24 | 1 | 83 | 25 | 108 |
| (100%) | (58.5%) | (0.4%) | (4.2%) | (2.3%) | (10.8%) | (1.5%) | (12.7%) | (9.2%) | (0.4%) | (31.9%) | (9.6%) | (41.5%) |
Table 2.
Comparison of Mutation Frequency as Determined by Different Detection Methods
| Array | Melting curve | Pyrosequencing | |
|---|---|---|---|
| Sanger | n = 235 | n = 190 | n = 138 |
| κ = 0.939 | κ = 0.956 | κ = 0.938 | |
| P < 0.001 | P < 0.001 | P < 0.001 | |
| Array | n = 190 | n = 138 | |
| κ = 0.956 | κ = 0.908 | ||
| P < 0.001 | P < 0.001 | ||
| Melting curve | n = 138 | ||
| κ = 0.932 | |||
| P < 0.001 |
P values were calculated by κ statistics.
Figure 2.
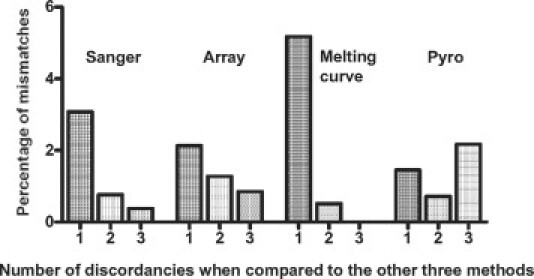
Percentage of mismatches for all detection methods. The percentage was calculated as the number of cases with discordant results (when compared with the other three assays) divided by the total number of tests performed per method.
Correlation of the KRAS Genotype with Histoanatomical Characteristics
Next, we compared the KRAS genotype assessed by Sanger sequencing with the histoanatomical characteristics (Figure 3). The somatic KRAS genotype was not associated with the presence or absence of tumor necrosis (P = 0.248), fat tissue (P = 0.166), non-neoplastic tissue (P = 0.546), or inflammation (P = 0.251). We found no significant correlations with tumor grade (P = 0.102), histological subtype (P = 0.280), location (P = 0.251), storage time of paraffin blocks (P = 0.272), and type of material used for DNA preparation (0.517).
Figure 3.
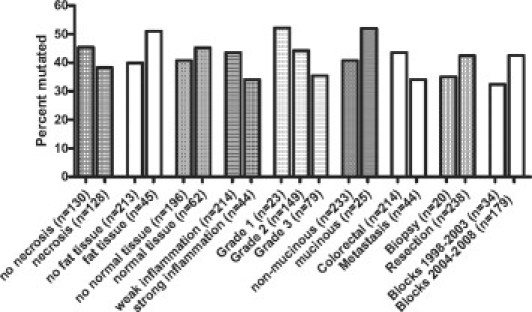
Tissue characteristics and frequency of mutation detection as determined by Sanger sequencing (n = 260).
Finally, we compared the amount of tumor cells in the tissue preparations with the frequency of KRAS mutations as determined by Sanger sequencing. The percentage of mutated DNA in preparations of cases harboring mutations significantly correlated with tumor cell content in the microdissected tissue (r = 0.489, P < 0.001). In addition, in samples with ≤10% tumor cells (n = 8) no mutations were found. Compared with the other samples with more than 10% tumor tissue, this was a significantly lower rate of detection (P = 0.022). A similar, yet due to small sample numbers nonsignificant, observation was made with all other methods applied (Table 3). Samples that featured 11% to 20% tumor cells did not display a lower mutation frequency in any method applied (see Supplemental Table S3 at http://jmd.amjpathol.org).
Table 3.
Mutation Frequency in Correlation with Tumor Cell Content
| % of tumor cells in tissue |
||||
|---|---|---|---|---|
| Total | ≤10% | >10% | P value | |
| Sanger sequencing* | 0.015 | |||
| Mutated | 108 (41.9%) | 0 (0%) | 108 (43.2%) | |
| Not mutated | 150 (58.1%) | 8 (100%) | 142 (56.8%) | |
| Array | 0.101 | |||
| Mutated | 104 (44.6%) | 1 (14.3%) | 103 (45.6%) | |
| Not mutated | 129 (55.4%) | 6 (85.7%) | 123 (54.4%) | |
| Melting curve | 0.059 | |||
| Mutated | 77 (41%) | 0 (0%) | 77 (42.1%) | |
| Not mutated | 111 (59%) | 5 (100%) | 106 (57.9%) | |
| Pyrosequencing | 0.175 | |||
| Mutated | 51 (37.5%) | 0 (0%) | 51 (38.3%) | |
| Not mutated | 85 (62.5%) | 3 (100%) | 82 (61.7%) | |
P values were calculated by χ2 test.
In two cases estimation of exact tumor cell content was not possible.
Laboratory Working Time and Costs
While melting curve analysis was the fastest method in our panel (∼1.5 hours), the other three assays were in comparable working time frames (array: ∼3.5 hours, sequencing methods ∼4.5 hours, Table 4). However, it has to be mentioned that the necessary laboratory working times may vary considerably with the number of assays performed per run.
Table 4.
Laboratory Working Time and Costs Per Assay for the Four Methods Applied
| BigDye Terminator cycle sequencing kit (Applied Biosystems) | Pyrosequencing PyroMark K-ras (Biotage) | ||
|---|---|---|---|
| Protocol steps* | Time | Protocol steps* | Time |
| 1. Single PCR, including setup | 200 minutes | 1. Single PCR, including setup | 200 minutes |
| 2. Purification and concentration of amplicons | 30 minutes | 2. Single-strand preparation | 30 minutes |
| 3. Sequencing forward and reverse (two reactions) | 20 minutes | 3. Pyrosequencing KRAS codons 12 and 13 | 20 minutes |
| 4. Software analysis | 5 minutes | 4. Software analysis | 5 minutes |
| Total | 4.5 hours | Total | 4.5 hours |
| Detection of mutations | Costs/sample† | Detection of mutations | Costs/sample† |
| Sequence of codons 12 and 13 | ∼$12 | Sequence of codons 12 and 13 | ∼$10.50 |
| Special equipment required | Costs‡ | Special equipment required | Costs‡ |
| ABI sequencer | ∼$100,000 | Vacuum Prep Tool, Pyrosequencer | ∼$150,000 |
| Array LCD-Array K-RASSNP 1.4 (Chipron) | LightMix kit KRAS40–0416 CE-IVD (TIB Molbiol) | ||
|---|---|---|---|
| Protocol steps* | Time | Protocol steps* | Time |
| 1. Single PCR, including setup | 200 minutes | 1. Real-time PCR, including setup | 80 minutes |
| 2. Hybridization of PCR products to LCD arrays | 30 minutes | 2. Analysis of melting curves | 10 minutes |
| 3. 2cd labeling and staining | 10 minutes | ||
| 4. Software analysis | 5 minutes | ||
| Total | 3.5 hours | Total | 1.5 hours |
| Detection of mutations | Costs/sample† | Detection of mutations | Costs/sample† |
| Sequence of codons 12 and 13 | ∼$22.50 | Limited sequence information | ∼$34.50 |
| Special equipment required | Costs‡ | Special equipment required | Costs‡ |
| Array scanner, centrifuge, SlideReader software | ∼$4500 | LightCycler instrument 1.5/2.0 | ∼$30–$75,000 |
All protocols start from extracted human DNA. For details see Materials and Methods. Pyrosequencing, Sanger sequencing, and array analysis require standard PCR equipment.
Assay costs were calculated excluding Taq polymerase, PCR buffer, and dNTPs. The LightMix kit includes polymerase and controls (total costs ∼$42–$52/patient sample).
Estimated instrument costs as given by the manufacturer or personal communications. For detailed prices manufacturer of local distributors should be contacted.
Approximate costs per assay (Table 4) were lowest for pyrosequencing (∼$10.50) and Sanger sequencing (∼$12), while costs per sample were twofold higher for the array (∼$22.50) and threefold higher for the melting curve analysis (∼$34.50). However, considering the specific equipment costs (Table 4) the array-based method is considerably less expensive (∼$4500) than the real-time PCR system (∼$30–$75,000) or the DNA sequencers (Sanger: ∼$100,000, Pyro: $150,000). Again, it has to be mentioned that local prices for the respective equipment may vary considerably.
Discussion
Somatic gain-of-function mutations in the KRAS gene of CRCs predict the lack of response to anti-EGFR therapy with cetuximab and panitumumab,14,15,16,17,18 and KRAS mutational screening has become mandatory in Europe before a treatment with either drug at the end of 2007. As one of eight approved reference centers in Germany22 we received 263 cases during the first 4 months of routine KRAS mutation testing. The number of tests continues to grow rapidly (143 cases in July 2008 in our institution) and is expected to increase further, since both cetuximab and panitumumab are currently tested in late-phase clinical trials for CRC in a variety of clinical settings.
A variety of methods have been applied for somatic KRAS mutation analysis.23,24,25,26,27,28,29,30 Some, but not all, have been validated for the use of DNA extracted from formalin-fixed and paraffin-embedded tissue. However, the cohorts usually tested were fairly homogeneous with respect to tissue type as well as tissue processing and storage, while in the more routine setting, tissue sampling, processing, and storage is usually not standardized, because it is performed by different pathology laboratories. Here we report our experiences with a heterogeneous set of tumor tissue referred to us from all over Germany. Our results indicate that all methods used in this study—Sanger sequencing, array analysis, melting curve analysis and pyrosequencing—yield similar results. Nevertheless, slight differences were observed. One explanation for this might be the use of a wild-type sequence suppressor in melting curve and array analysis. These suppressor constructs were used to increase the sensitivity of the analysis of tissue with a minimal amount of mutated cells. Such constructs have not been used for the sequencing methods. For pyrosequencing, very low amounts of mutations might be missed due to the fact that very small extra peaks were possibly interpreted as background noise. Since melting curve analysis had the lowest rate of highly discordant results (two or three other methods with different results), this method may be slightly more accurate. However, from the technical viewpoint, the decision of which assay should be performed will depend on equipment, experience, and personnel available in the testing institution. Since all of these techniques might report false results, especially if performed without the proper experience, we strongly recommend the validation of the method in European Quality Award schemes and ring trials before accreditation of test institutions. Recently, the German Society of Pathology and the Berufsverband Deutscher Pathologen e.V. collaboratively organized a set of independent ring studies for somatic KRAS genotyping in CRC,22,31 and a European quality assurance program was proposed.32
With respect to the influence of different tissue- and non-tissue-specific variables on the results of genotyping, we did not find a correlation between the origin of the tissue sample (colorectal/metastasis), the type of specimen (biopsy or resection specimen), the storage time of the paraffin blocks, the presence or absence of necrosis, fat tissue, normal tissue or inflammation and the prevalence of mutations. We were able to analyze samples directly from routine H&E-stained sections of specimens as well as cytologic specimen (data not from this cohort) when tissue blocks were not available. This implicates that reliable results can be obtained independently of the mentioned parameters. In accordance, previous reports suggest that mutation status in metastases completely overlaps with the mutation status in the primary tumor.18 Three out of 263 cases referred as carcinoma contained no tumor tissue and two cases were adenomas but not carcinomas. This would have been missed without tissue review by a trained pathologist.
The average mutation frequency of 41.5% is in accordance with the literature. Interestingly the mutation rate for samples containing less than 10% tumor cells was lower regardless of the method used for detection. However, these differences were only significant for Sanger sequencing, presumably due to the smaller case numbers for the other three methods used. This indicates that testing such samples will maybe not result in reliable data. For samples containing less than 40% tumor cells both methods (melting curve analysis, array) using a wild-type sequence suppressor reported slightly more mutations than DNA sequencing.
Manual microdissection, using in average 60% of the entire material, is a powerful tool to enrich the analyzed sample with tumor cells. The number of specimens containing 10% or less tumor cells was 3% only (eight samples). Without this step there would be a considerably higher number of low tumor cell cases. This again underscores that morphologically guided microdissection of tumor tissue is strongly recommended for cases with low tumor content before performing a mutation analysis. According to our results, tissue blocks with higher tumor cell content can be tested without prior microdissection.
When it comes to the laboratory working time necessary to perform a single assay, melting curve analysis can be run considerably faster than the other three methods. Therefore if the time line is critical, one may decide to use this assay. However, this is also the method with the highest costs per assay, followed by array analysis. Sanger sequencing and pyrosequencing cause lower costs per assay, but the specific equipment is more expensive. Institutions with a low frequency of tests may prefer array analysis or melting curve, since basic equipment for these tests is cheaper, while institutions with a high throughput may decide for sequencing, because the costs per test are lower. Nevertheless, we like to emphasize again that, in our view, the final decision of which assay to use is largely dependent on the laboratory equipment, workflow, and experience in any specific molecular pathology working unit, so general recommendations cannot be given easily.
In conclusion, we found that in a routine diagnostic setting the results of KRAS mutation analysis do not depend on specific tumor and tissue characteristics and all detection methods used here provide valuable data. Histopathological evaluation and manual microdissection of tumor tissue before mutational analysis are crucial, and KRAS mutation results have to be reported with respect to the morphology.
Acknowledgements
We are grateful to Nicole Deutschmann, Mirko Rizzello, Carola Priebe, Sigrun Blauhut, Sandra Krüger, Ines Koch, and Katrin Podzus for excellent technical assistance. We thank Martina Eickmann for critical reading of the manuscript. We are grateful to all pathologists and oncologists who have referred cases to our institution.
Footnotes
O.L. is employed by Tib Molbiol. H.J. is employed by Invitek. V.H. is employed at Chipron. Some products of the companies mentioned are commercially available and have been used in this study.
Supplemental material for this article can be found on http://jmd.amjpathol.org.
Web Extra Material
References
- 1.Karim-Kos HE, de Vries E, Soerjomataram I, Lemmens V, Siesling S, Coebergh JW. Recent trends of cancer in Europe: a combined approach of incidence, survival and mortality for 17 cancer sites since the 1990s. Eur J Cancer. 2008;44:1345–1389. doi: 10.1016/j.ejca.2007.12.015. [DOI] [PubMed] [Google Scholar]
- 2.Wolpin BM, Mayer RJ. Systemic treatment of colorectal cancer. Gastroenterology. 2008;134:1296–1310. doi: 10.1053/j.gastro.2008.02.098. [DOI] [PMC free article] [PubMed] [Google Scholar]
- 3.Peeters M, Balfour J, Arnold D. Panitumumab—a fully human anti-EGFR monoclonal antibody for treatment of metastatic colorectal cancer. Aliment Pharmacol Ther. 2008;28:269–281. doi: 10.1111/j.1365-2036.2008.03717.x. [DOI] [PubMed] [Google Scholar]
- 4.Kuo T, Cho CD, Halsey J, Wakelee HA, Advani RH, Ford JM, Fisher GA, Sikic BI. Phase II study of gefitinib, fluorouracil, leucovorin, and oxaliplatin therapy in previously treated patients with metastatic colorectal cancer. J Clin Oncol. 2005;23:5613–5619. doi: 10.1200/JCO.2005.08.359. [DOI] [PubMed] [Google Scholar]
- 5.Santoro A, Comandone A, Rimassa L, Granetti C, Lorusso V, Oliva C, Ronzoni M, Siena S, Zuradelli M, Mari E, Pressiani T, Carnaghi C. A phase II randomized multicenter trial of gefitinib plus FOLFIRI and FOLFIRI alone in patients with metastatic colorectal cancer. Ann Oncol. 2008;19:1888–1893. doi: 10.1093/annonc/mdn401. [DOI] [PubMed] [Google Scholar]
- 6.Meyerhardt JA, Zhu AX, Enzinger PC, Ryan DP, Clark JW, Kulke MH, Earle CC, Vincitore M, Michelini A, Sheehan S, Fuchs CS. Phase II study of capecitabine, oxaliplatin, and erlotinib in previously treated patients with metastatic colorectal cancer. J Clin Oncol. 2006;24:1892–1897. doi: 10.1200/JCO.2005.05.3728. [DOI] [PubMed] [Google Scholar]
- 7.Spano JP, Milano G, Vignot S, Khayat D. Potential predictive markers of response to EGFR-targeted therapies in colorectal cancer. Crit Rev Oncol Hematol. 2008;66:21–30. doi: 10.1016/j.critrevonc.2007.11.005. [DOI] [PubMed] [Google Scholar]
- 8.Hamilton SR. Targeted therapy of cancer: new roles for pathologists in colorectal cancer. Mod Pathol. 2008;21:S23–S30. doi: 10.1038/modpathol.2008.14. [DOI] [PubMed] [Google Scholar]
- 9.Saltz LB, Meropol NJ, Loehrer PJ, Sr, Needle MN, Kopit J, Mayer RJ. Phase II trial of cetuximab in patients with refractory colorectal cancer that expresses the epidermal growth factor receptor. J Clin Oncol. 2004;22:1201–1208. doi: 10.1200/JCO.2004.10.182. [DOI] [PubMed] [Google Scholar]
- 10.Cunningham D, Humblet Y, Siena S, Khayat D, Bleiberg H, Santoro A, Bets D, Mueser M, Harstrick A, Verslype C, Chau I, Van Cutsem E. Cetuximab monotherapy and cetuximab plus irinotecan in irinotecan-refractory metastatic colorectal cancer. N Engl J Med. 2004;351:337–345. doi: 10.1056/NEJMoa033025. [DOI] [PubMed] [Google Scholar]
- 11.Moroni M, Veronese S, Benvenuti S, Marrapese G, Sartore-Bianchi A, Di Nicolantonio F, Gambacorta M, Siena S, Bardelli A. Gene copy number for epidermal growth factor receptor (EGFR) and clinical response to anti EGFR treatment in colorectal cancer: a cohort study. Lancet Oncol. 2005;6:279–286. doi: 10.1016/S1470-2045(05)70102-9. [DOI] [PubMed] [Google Scholar]
- 12.Sartore-Bianchi A, Moroni M, Veronese S, Carnaghi C, Bajetta E, Luppi G, Sobrero A, Barone C, Cascinu S, Colucci G, Cortesi E, Nichelatti M, Gambacorta M, Siena S. Epidermal growth factor receptor gene copy number and clinical outcome of metastatic colorectal cancer treated with panitumumab. J Clin Oncol. 2007;25:3238–3245. doi: 10.1200/JCO.2007.11.5956. [DOI] [PubMed] [Google Scholar]
- 13.Barber TD, Vogelstein B, Kinzler KW, Velculescu VE. Somatic mutations of EGFR in colorectal cancers and glioblastomas. N Engl J Med. 2004;351:2883. doi: 10.1056/NEJM200412303512724. [DOI] [PubMed] [Google Scholar]
- 14.Amado RG, Wolf M, Peeters M, Van Cutsem E, Siena S, Freeman DJ, Juan T, Sikorski R, Suggs S, Radinsky R, Patterson SD, Chang DD. Wild-type KRAS is required for panitumumab efficacy in patients with metastatic colorectal cancer. J Clin Oncol. 2008;26:1626–1634. doi: 10.1200/JCO.2007.14.7116. [DOI] [PubMed] [Google Scholar]
- 15.Lièvre A, Bachet JB, Boige V, Cayre A, Le Corre D, Buc E, Ychou M, Bouché O, Landi B, Louvet C, André T, Bibeau F, Diebold MD, Rougier P, Ducreux M, Tomasic G, Emile JF, Penault-Llorca F, Laurent-Puig P. KRAS mutations as an independent prognostic factor in patients with advanced colorectal cancer treated with cetuximab. J Clin Oncol. 2008;26:374–379. doi: 10.1200/JCO.2007.12.5906. [DOI] [PubMed] [Google Scholar]
- 16.Lièvre A, Bachet JB, Le Corre D, Boige V, Landi B, Emile JF, Côté JF, Tomasic G, Penna C, Ducreux M, Rougier P, Penault-Llorca F, Laurent-Puig P. KRAS mutation status is predictive of response to cetuximab therapy in colorectal cancer. Cancer Res. 2006;66:3992–3995. doi: 10.1158/0008-5472.CAN-06-0191. [DOI] [PubMed] [Google Scholar]
- 17.De Roock W, Piessevaux H, De Schutter J, Janssens M, De Hertogh G, Personeni N, Biesmans B, Van Laethem JL, Peeters M, Humblet Y, Van Cutsem E, Tejpar S. KRAS wild-type state predicts survival and is associated to early radiological response in metastatic colorectal cancer treated with cetuximab. Ann Oncol. 2008;19:508–515. doi: 10.1093/annonc/mdm496. [DOI] [PubMed] [Google Scholar]
- 18.Karapetis CS, Khambata-Ford S, Jonker DJ, O'Callaghan CJ, Tu D, Tebbutt NC, Simes RJ, Chalchal H, Shapiro JD, Robitaille S, Price TJ, Shepherd L, Au HJ, Langer C, Moore MJ, Zalcberg JR. K-ras mutations and benefit from cetuximab in advanced colorectal cancer. N Engl J Med. 2008;359:1757–1765. doi: 10.1056/NEJMoa0804385. [DOI] [PubMed] [Google Scholar]
- 19.Raponi M, Winkler H, Dracopoli NC. KRAS mutations predict response to EGFR inhibitors. Curr Opin Pharmacol. 2008;8:413–418. doi: 10.1016/j.coph.2008.06.006. [DOI] [PubMed] [Google Scholar]
- 20.Schewe C, Goldmann T, Grosser M, Zink A, Schlüns K, Pahl S, Ulrichs T, Kaufmann SH, Nerlich A, Baretton GB, Dietel M, Vollmer E, Petersen I. Inter-laboratory validation of PCR-based detection of Mycobacterium tuberculosis in formalin-fixed, paraffin-embedded tissues. Virchows Arch. 2005;447:573–585. doi: 10.1007/s00428-005-1233-3. [DOI] [PubMed] [Google Scholar]
- 21.Beranek M, Bure J, Sacha M, Sakra L, Rajman M, Jandik P, Rudolf E, Landt O. Detection of point mutations in kirsten ras 2 gene using locked nucleic acids clamped PCR. Chem Listy. 2007;101:738–741. [Google Scholar]
- 22.Dietel M, Tannapfel A, Baretton G, Kreipe H, Kloor M, Gabbert H, Kirchner T. Molecular pathologic KRAS mutation analysis: a prerequisite of effective antibody treatment for metastasized colorectal cancer. Chirurg. 2008;79:576–579. doi: 10.1007/s00104-008-1514-x. [DOI] [PubMed] [Google Scholar]
- 23.Simi L, Pratesi N, Vignoli M, Sestini R, Cianchi F, Valanzano R, Nobili S, Mini E, Pazzagli M, Orlando C. High-resolution melting analysis for rapid detection of KRAS. BRAF, and PIK3CA gene mutations in colorectal cancer. Am J Clin Pathol. 2008;130:247–253. doi: 10.1309/LWDY1AXHXUULNVHQ. [DOI] [PubMed] [Google Scholar]
- 24.Ogino S, Kawasaki T, Brahmandam M, Yan L, Cantor M, Namgyal C, Mino-Kenudson M, Lauwers GY, Loda M, Fuchs CS. Sensitive sequencing method for KRAS mutation detection by pyrosequencing. J Mol Diagn. 2005;7:413–421. doi: 10.1016/S1525-1578(10)60571-5. [DOI] [PMC free article] [PubMed] [Google Scholar]
- 25.Clayton SJ, Scott FM, Walker J, Callaghan K, Haque K, Liloglou T, Xinarianos G, Shawcross S, Ceuppens P, Field JK, Fox JC. K-ras point mutation detection in lung cancer: comparison of two approaches to somatic mutation detection using ARMS allele-specific amplification. Clin Chem. 2000;46:1929–1938. [PubMed] [Google Scholar]
- 26.Lilleberg SL, Durocher J, Sanders C, Walters K, Culver K. High sensitivity scanning of colorectal tumors and matched plasma DNA for mutations in APC.TP53, K-RAS, and BRAF genes with a novel DHPLC fluorescence detection platform. Ann NY Acad Sci. 2004;1022:250–256. doi: 10.1196/annals.1318.039. [DOI] [PubMed] [Google Scholar]
- 27.Rothschild CB, Brewer CS, Loggie B, Beard GA, Triscott MX. Detection of colorectal cancer K-ras mutations using a simplified oligonucleotide ligation assay. J Immunol Methods. 1997;206:11–19. doi: 10.1016/s0022-1759(97)00078-1. [DOI] [PubMed] [Google Scholar]
- 28.Emanuel JR, Damico C, Ahn S, Bautista D, Costa J. Highly sensitive nonradioactive single-strand conformational polymorphism: detection of Ki-ras mutations. Diagn Mol Pathol. 1996;5:260–264. doi: 10.1097/00019606-199612000-00006. [DOI] [PubMed] [Google Scholar]
- 29.Keohavong P, Zhu D, Whiteside TL, Swalsky P, Bakker A, Elder EM, Siegfried JM, Srivastava S, Finkelstein SD. Detection of infrequent and multiple K-ras mutations in human tumors and tumor-adjacent tissues. Anal Biochem. 1997;247:394–403. doi: 10.1006/abio.1997.2100. [DOI] [PubMed] [Google Scholar]
- 30.Ward R, Hawkins N, O'Grady R, Sheehan C, O'Connor T, Impey H, Roberts N, Fuery C, Todd A. Restriction endonuclease-mediated selective polymerase chain reaction: a novel assay for the detection of K-ras mutations in clinical samples. Am J Pathol. 1998;153:373–379. doi: 10.1016/S0002-9440(10)65581-2. [DOI] [PMC free article] [PubMed] [Google Scholar]
- 31.Tannapfel A. Molecular pathology analysis of the KRAS mutation status in patients with metastasized colorectal carcinoma: an initial approach using predictive pathology. Pathologe. 2008;29:93–96. doi: 10.1007/s00292-007-0966-y. [DOI] [PubMed] [Google Scholar]
- 32.van Krieken JH, Jung A, Kirchner T, Carneiro F, Seruca R, Bosman FT, Quirke P, Fléjou JF, Hansen TP, de Hertogh G, Jares P, Langner C, Hoefler G, Ligtenberg M, Tiniakos D, Tejpar S, Bevilacqua G, Ensari A. KRAS mutation testing for predicting response to anti-EGFR therapy for colorectal carcinoma: proposal for a European quality assurance program. Virchows Arch. 2008;453:417–431. doi: 10.1007/s00428-008-0665-y. [DOI] [PubMed] [Google Scholar]
Associated Data
This section collects any data citations, data availability statements, or supplementary materials included in this article.