

Abstract
Treatment of colon carcinoma with the anti-epidermal growth factor receptor antibody Cetuximab is reported to be ineffective in KRAS-mutant tumors. Mutation testing techniques have therefore become an urgent concern. We have compared three methods for detecting KRAS mutations in 59 cases of colon carcinoma: 1) high resolution melting, 2) the amplification refractory mutation system using a bifunctional self-probing primer (ARMS/Scorpion, ARMS/S), and 3) direct sequencing. We also evaluated the effects of the methods of sectioning and coring of paraffin blocks to obtain tumor DNA on assay sensitivity and specificity. The most sensitive and specific combination of block sampling and mutational analysis was ARMS/S performed on DNA derived from 1-mm paraffin cores. This combination of tissue sampling and testing method detected KRAS mutations in 46% of colon tumors. Four samples were positive by ARMS/S, but initially negative by direct sequencing. Cloned DNA samples were retested by direct sequencing, and in all four cases KRAS mutations were identified in the DNA. In six cases, high resolution melting abnormalities could not be confirmed as specific mutations either by ARMS/S or direct sequencing. We conclude that coring of the paraffin blocks and testing by ARMS/S is a sensitive, specific, and efficient method for KRAS testing.
The KRAS gene was recognized more that 25 years ago as the component of Kirsten sarcoma virus responsible for oncogenesis.1 Since that time, mutations of KRAS conferring constitutive activity on KRAS protein have been described in a large proportion of solid tumors ranging from >90% of pancreatic carcinomas2 to 20% to 30% of pulmonary adenocarcinomas.3,4 KRAS is a component of the tyrosine kinase signaling pathway mediated through ErbB, insulin-like growth factor, and met receptors, among others. The presence of KRAS mutations has recently taken on increased clinical significance, as response of colon tumors to the epidermal growth factor receptor-targeted agent Cetuximab has been linked to absence of such mutations.5,6,7,8 KRAS mutation testing currently is being incorporated into patient selection protocols for anti-epidermal growth factor receptor colon cancer trials and is increasingly important for effective management of other solid tumors with targeted agents.9,10,11,12
Still unresolved however, are the specific protocols that are most sensitive, specific, and efficient for detection of KRAS mutation in clinical samples. Methodologies used to test for KRAS mutations were reviewed more than a decade ago.13 Typically, the specimens available for mutational analysis are formalin-fixed, paraffin-embedded tissue blocks. Formalin is a convenient fixative with a large installed user base, and formalin-fixed tissue embedded in paraffin blocks provides outstanding histological detail for pathological diagnosis. However, formalin fixation may introduce sequence alterations in DNA, and the frequency of such artificial mutations is inversely correlated with the number of cells used in PCR.14 Which paraffin block sampling method can yield an optimal quantity of DNA is yet to be determined.
Also unclear is which of the currently available methods of testing can be most effectively be applied to clinical material while meeting turnaround time requirements of current targeted treatment protocols. The current gold standard for KRAS testing remains direct sequencing of PCR amplification products.13 Two recently described methods, high resolution melting (HRM) analysis15,16,17,18 and amplification refractory mutation system (ARMS),5,19,20,21 which incorporates a unique bifunctional florescent primer/probe molecule (Scorpion),5,22,23 have high sensitivity and specificity for detection of KRAS mutations with low turnaround time, and could be applied in a clinical setting.
The objective of the study described in this report was to test two methods of sampling paraffin-embedded tissue blocks for KRAS testing and to cross compare the two new testing methodologies, HRM and ARMS/S, with direct sequencing in regard to sensitivity, specificity, and efficiency of testing.
Materials and Methods
The design of the study is depicted in Figure 1.
Figure 1.

Schematic diagram for testing protocol. Tissue blocks were tested using two tissue block sampling methods and three mutation assays including direct sequencing, ARMS/scorpions, and high resolution melting.
Paraffin blocks from 59 patients with invasive adenocarcinoma of colon were tested under a Colorado Multiple Institutional Review Board-approved protocol. The proportion of the slide that was composed of tumor was variable and was separately recorded in 10% increments for each tumor. All blocks were processed by two rapid methods: 1.) sectioning at 5 microns and 2.) coring using a Beecher Instruments tissue arrayer (Beecher Instruments, Inc., Sun Prarie, WI) that can precisely sample specific regions of the paraffin block. Sectioned tissue tended to form a tight spiral that could be readily placed directly in a microcentrifuge tube for DNA extraction. To prepare tissue cores, a stained slide made from a tumor-containing paraffin block was marked with a cytology marking pen to indicate a tumor rich focus. The block was then placed in the arrayer and the tumor-rich focus was sampled with a 1 mm needle. DNA was also extracted from tumor cells scraped from glass slides with a scalpel under a dissecting microscope in a subset of samples to determine whether microdissection might improve the sensitivity of the various detection assays (see below).
For deparaffinization, both sections and cores were incubated at room temperature in several volumes of xylenes for 6 to 12 hours. Complete removal of paraffin was critical to obtain maximum DNA yield. For DNA extraction, deparaffinized tissue was digested with protease K (Qiagen, Inc., Valencia, CA) overnight at 37°C. If a pellet remained following overnight digestion, protease K was refreshed and the specimen reincubated at 90°C for 1 hour, which resulted in the dissolution of all residual pellet observed in this trial. DNA was then isolated from the incubation mixture using a QIAcube robotic workstation (Qiagen Inc., Valencia, CA) extraction protocol. DNA yields were then quantified using a Nanodrop spectrophotometer ND-1000 (Thermo Fisher Scientific Inc., Waltham, MA).
DNA was also isolated from non-small cell lung cancer lines to evaluate the sensitivity and specificity of the assays in unfixed snap frozen tissue. To obtain cell line DNA, cells were grown to confluence, centrifuged at 1500 × g and frozen until use. DNA was extracted from the thawed cell pellet by protease K digest and purified by the QIAcube fresh tissue protocol. All purified DNA samples were then tested by the three methods described below.
ARMS/S
Template DNA was analyzed for a set of seven known KRAS point mutations using the Therascreen KRAS Mutation Detection kit (DxS Ltd., Manchester, UK). Reactions and analysis were performed on a Lightcycler 480 real-time PCR instrument (LC480) that was calibrated using a dye calibration kit provided by the kit manufacturer. Reactions were performed on a 96-well plate in 20 μl reactions using approximately 60 ng of each DNA template. Sample DNA was amplified with eight separate primer sets (one for the wild-type sequence and one for each of seven different point mutations) with an internal Scorpion reporter probe (Table 1). Cycle cross point (Cp) values were calculated using the LC480 Fit-point software suite, and the control Cp was subtracted from the Cp of each mutation specific primer set (Figure 2). Because there may be spurious low level amplification in the absence of mutant template, amplification products are often visible at later cycle numbers for most of the primer sets. To avoid false-positive results due to background amplification, the assay is considered valid only if the control Cp value is less than or equal to 35 cycles. ΔCp thresholds are calculated to compensate for this background amplification. Mutations are called when the ΔCp is less than the statistically-set 5% confidence-value threshold.
Table 1.
KRAS Exon 1 Mutations Detected by DxS ARMS/Scorpion Kit
| Codon | BP Substitution | AA Change (Abbrev.) |
|---|---|---|
| 12 | GGT→GCT | Gly→Ala (G12A) |
| 12 | GGT→GAT | Gly→Asp (G12D) |
| 12 | GGT→CGT | Gly→Arg (G12R) |
| 12 | GGT→TGT | Gly→Cys (G12C) |
| 12 | GGT→AGT | Gly→Ser (G12S) |
| 12 | GGT→GTT | Gly→Val (G12V) |
| 13 | GGC→GAC | Gly→Asp (G12D) |
Figure 2.
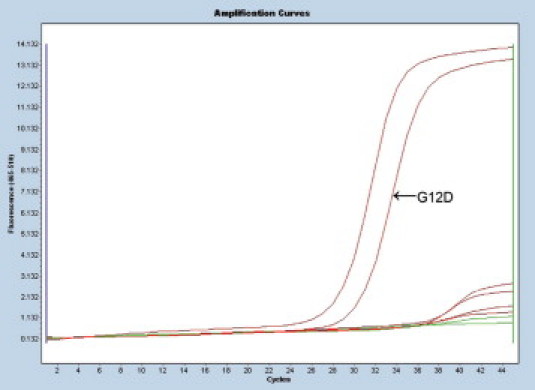
Raw amplification curves for KRAS mutant tumor sample tested by the ARMS/S method. Each curve represents an amplification product of the same DNA template for one of eight specific primer sets. The curve on the farthest left is for wild-type control primers. The next curve to right represents amplification products for mutant template (GGT→GAT, G12D). The remaining curve is for the wild-type template. A positive result is determined by the cross point, the point on each curve where the slope of the curve becomes linear. There is a clear separation between mutant product (CP 29.6) and non-mutant product (CPs >38.5). The difference between CP for the wild-type control DNA and the mutant DNA (ΔCP) is small (2.4 cycles), indicating a mutation.
HRM
Template DNA was tested by HRM analysis using a Lightcycler 480 real-time PCR instrument (Roche Applied Science, Indianapolis, IN). Approximately 60 ng of tumor template DNA, wild-type control DNA and mutant control DNA were amplified on the Lightcycler 480 instrument using HRM master mix (Roche cat# 04909631001), with the RASO1 and RASA2 primers and 1.75 mmol/L MgCl2 in a 10 μl on a 96 well plate, using a 2-step cycling program (95° melting, 72° annealing and extension) for 45 cycles. PCR products were analyzed by HRM with 25 data acquisitions per degree of temperature increase, from 40° to 90°C. Lightcycler 480 Gene Scanning software using the known wild-type control samples for baseline calculation (Figure 3, A and B) was used for these analyses.
Figure 3.
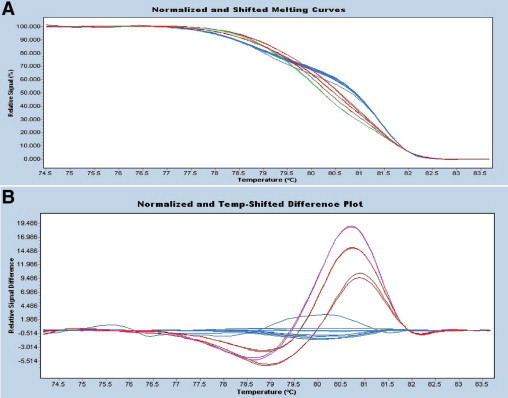
High resolution melting (HRM) difference point plot for KRAS. A: Normalized high resolution melt curves. PCR products are labeled with a fluorescent dye and the fluorescent signal is plotted as the temperature increases. Strand melting results in a decrease in fluorescent signal. B: The difference plot displays the melting curve of each sample subtracted from a reference curve to visually accentuate the melt curve differences and aid in genotype grouping. Products of three mutant templates are shown in red and pink. Products of wild-type templates are shown in blue. The upper (pink curve) represents the codon 12 mutation G12S, whereas the red curves represent amplification products for a single mutation at codon 12 (G12V) at two different concentrations. The latter two curves are similar shapes but have different heights due to variation in the quantity of PCR amplicon.
Direct Sequencing
Approximately 60 ng of template DNA were PCR amplified using 10 pmol each of forward and reverse KRAS primers (forward: RASO1 5′-AAGGCCTGCTGAAAATGAC-3′ reverse:RASA2 5′-TGGTCCTGCACCAGTAATATG-3′) and Taq polymerase PCR master mix (Promega cat# M750) in a 25 μl reaction. PCR was performed on an ABI 9700 thermocycler with 20 cycles of touchdown PCR (starting annealing temperature of 65°C, decremented 0.5°C per cycle) and 15 cycles at 55°C annealing temperature. The resultant PCR products were purified with the QIAquick PCR cleanup kit (Qiagen cat# 28106) run through the appropriate protocol on the QIAcube robotic workstation. The purified PCR products were sequenced in forward and reverse directions using an ABI 3730 automated sequencer (Applied Biosystems, Inc., Foster City, CA). Each chromatogram was visually inspected for any abnormalities with particular attention directed to codons 12 and 13. Sequences were also evaluated using Mutation Surveyor software (Soft Genetics, State College, PA) against known wild-type control sequences. Mutations were determined to be present when peaks reached a threshold value above baseline calculated from background level. Visual reads confirmed mutation peaks that fell just below the threshold of detection of the Mutation Surveyor software and identified false-positive calls where the software misinterpreted band compression and other anomalies as sequence changes (Figure 4).
Figure 4.
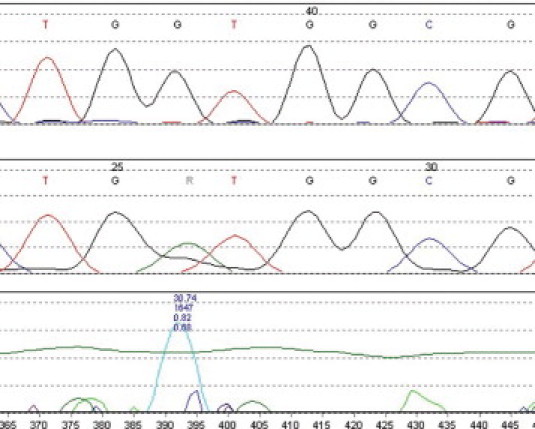
Mutation Surveyor readout for KRAS codon 12 mutation (GGT→GAT, G12D), forward primer set. Top tracing is for wild-type control. Mutant tracing is shown in the center. The chomatogram peak differences are calculated by the Mutation Surveyor program and plotted in the bottom tracing. Numbers refer to areas under the curve. The horizontal green line indicates the calculated threshold level for the mutation call. Visual inspection of chromatograms are required to indentify mutation peaks that fall below the threshold of detection of the software, as well as for false positives due to band compression or other sequencing artifacts.
Statistical Analysis
χ2 analysis, Student t-test and Pearson correlation were used to compare test results. Analyses were conducted with the SPSS v.16 statistical package (SPSS, Inc., Chicago, IL).
Results
Cell Line DNA
To validate testing methods in unfixed control DNA, a total of 14 non-small cell lung carcinoma cell line DNA samples were tested by all three methods. Three (H157, H358, and HCC44) have been previously reported to be KRAS mutant while 11 (H157, H226, H322, H358, H520, H820, H1435, H1650, H1703, H1975, H2126, HCC44, HCC2279, and HCC4006) are considered to be wild-type. All three mutations were confirmed (H157, G12R; H358, G12S; and HCC44, G12S) by all three methods while no mutations were found in the previously reported to be wild-type by any of the methods tested.
Comparison of Sections with Cores in Paraffin Blocks
Estimated tumor cellularity of tumors in paraffin blocks varied from 1% or less to approximately 90% of the cross-sectional area of the block. No relationship was noted between the detection of mutation and the percentage of tumor in sections (P = 0.638, t-test). All specimens (sections and cores) yielded sufficient DNA for successful amplification. The average quantity obtained from sections was 6.0 micrograms while the average obtained from 1 to 2 cores was 10.3 micrograms. Both sections and cores from a total of 59 surgically resected invasive adenocarcinomas of colon were evaluated by the three methods—ARMS/S, HRM, and direct sequencing.
The two methods of specimen preparation resulted in similar but not identical results. Results from total of 177 samples processed by both methods were compared. There was agreement between the sampling methods in 158 of the 177 samples with 14 of the cores and five of the sections mutation-positive while the corresponding samples were wild-type as shown in the cross tabulation (Table 2). When these results were broken down by testing method it was found that all but one of the samples positive in section DNA but negative in core DNA were tested by HRM.
Table 2.
Mutations in DNA Extracted from Tissue Sections and Cores
WT = wild-type.
MUT = mutant.
Finally, the question remains whether microdissection may further increase the sensitivity of the assay. To address this question we microdissected the all of the specimens that were negative in whole sections but positive in core specimens and all but one specimen that were mutation-negative in both sections and core samples. (Insufficient cellular material was available for retesting of one case.) Two of the three cases that were negative in whole tissue sections were positive in the microdissected material but none that were negative in both whole sections and cores were positive in microdissected samples.
Comparison of Molecular Testing Methods
A total of 118 specimens (59 sections and 59 cores) were tested by each of the three mutation detection methods. Results for the various methods are shown in Table 3.
Table 3.
Frequency of Mutations Detected by Separate Testing Methods
ARMS/S = amplification resistant mutation system/Scorpions.
HRM = high resolution melting analysis.
Seq = direct sequencing.
The most frequently positive method was HRM. Pearson correlation indicated a high degree of agreement among the various methods, but with the highest between ARMS/S and direct sequencing and the lowest between direct sequencing and HRM (Table 4).
Table 4.
Correlation among Results Detected by Different Testing Methods
| Pearson correlation |
|||
|---|---|---|---|
| DxS | HRM | Seq | |
| DxS | 1 | ||
| HRM | 0.801 | 1 | |
| Seq | 0.816 | 0.683 | 1 |
Cross tabulation tables (Table 5) for two-way comparisons are shown below. All 10 discrepancies between ARMS/S and direct sequencing were due to the higher frequency of MUT by ARMS/S than directed sequencing. Discrepancies between HRM and the other two methods were due exclusively to the higher frequency of MUT in the HRM groups.
Table 5.
2 × 2 Comparison of Mutation Frequencies Detected by the Three Testing Methods
| ARMS/S v. Seq |
HRM v. Seq |
ARMS/S v. HRM |
|||||||||
|---|---|---|---|---|---|---|---|---|---|---|---|
| Seq |
Seq |
HRM | |||||||||
| ARMS/S | WT* | MUT† | Total | HRM | WT | MUT | Total | ARMS/S | WT | MUT | Total |
| WT | 66 | 0 | 66 | WT | 54 | 0 | 54 | WT | 54 | 13 | 67 |
| MUT | 10 | 42 | 52 | MUT | 22 | 42 | 64 | MUT | 0 | 51 | 51 |
| Total | 76 | 42 | 118 | Total | 76 | 42 | 118 | Total | 54 | 64 | 118 |
WT = wild-type.
MUT = mutant.
Combined Results
Combined results are shown in Table 6. The method with the most frequent positive results was HRM, which detected melting point abnormalities in 53% of sections and 56% of cores. However, HRM does not provide the identity of mutations that are potentially detected and requires direct sequencing to confirm the mutation.15 Mutations were confirmed by direct sequencing in only 19 of 31 (specificity 61%) of HRM-positive section specimens and 23 of 33 (specificity 70%) of HRM-positive cores. All cases that were MUT by ARMS/S or direct sequencing were positive by HRM, indicating a sensitivity of 100%.
Table 6.
Comparison of Results by Block Sampling Method and Individual Testing Method
| ARMS/S |
HRM |
Direct Seq |
||||
|---|---|---|---|---|---|---|
| Mutant | % | Mutant | % | Mutant | % | |
| Sections | 24 | 41% | 31 | 53% | 19 | 32% |
| Cores | 27 | 46% | 33 | 56% | 23 | 39% |
The highest level of agreement among any of the subgroups was the association between ARMS/S and direct sequencing in core specimens. The cross tabulation table for this comparison is shown below (Table 7). There was 93% concordance in these data. All of the discrepancies in results were in the direction of greater sensitivity for ARMS/S.
Table 7.
Comparison of ARMS/Scorpions with Direct Sequencing in DNA Prepared for Tissue Cores
WT = wild-type.
MUT = mutant.
The high sensitivity of ARMS/S raises the question of the specificity of this test. On resequencing the test samples, one sample was found to have a mutation that had previously been overlooked and that matched the mutation identified by ARMS/S (Figure 5). Close examination of the sequence chromatogram shows a very tiny peak corresponding to the mutation detected by ARMS/S, but its height is below the level of background and cannot be reasonably called. To further explore this question with the remaining three samples and to estimate the concentration of mutant DNA in the starting DNA sample, we cloned the DNA of these samples and sequenced 12 to 24 of the resulting clones from each sample. In two samples we found one mutant clone per 12 wild type, and in one sample we found 1 mutant clone per 24 wild-type, suggesting a concentration of mutant DNA at 4 to 8% in these samples.
Figure 5.
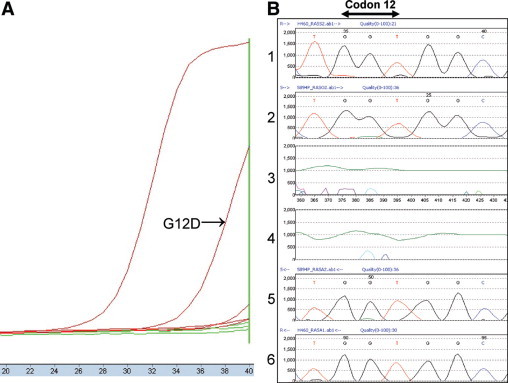
Example of discrepancy between ARMS/S and direct sequencing. On the left (A), ARMS/S amplification curve for mutant tumor DNA (G12D) is clearly separated from that of non-mutant control DNA with ΔCP of 7.3, a value that is within the range indicating mutation. On the right (B) is a chromogram for direct sequencing results for KRAS codons 12 and 13. In frames 1 and 6, tracings of forward and reverse control DNA strands are shown. Tracings for forward and reverse test DNA strands are shown in frames 2 and 5. Frames 3 and 4 show difference plots for forward and reverse strands calculated by Mutation Surveyor software. There is a low peak (A) corresponding to the expected mutation, but the height of the peak is below the level background and cannot be confidently interpreted as a mutation.
Discussion
We evaluated sample preparation and compared three current methods for the determination of KRAS mutation in formalin-fixed, paraffin tissue samples. We find that methods of sample preparation and testing result in small, but possibly significant differences in results. ARMS/S proved to be 100% accurate with a single round of testing, which could translate into economical and clinical advantage.
In sample preparation, there are several potential problems that could affect testing results. Tumor samples may vary in the size of the overall sample that is available for testing. This is dependent in part on the procedure that was used to obtain the sample. Surgical resection yields many more tumor cells for testing than more limited diagnostic procedures such as snare or fine needle aspiration biopsy. For this reason testing of resection specimens is favored whenever these are available. However, when resection specimens are not available, adequate results may be obtained from smaller biopsies provided that well preserved tumor cells are present in the block.
Paraffin blocks are highly heterogeneous with respect to the quantity and distribution of tumor within the blocks and microscopic verification that sufficient tumor cells are present in the block is critical for accurate testing. After microscopic inspection, blocks may be directly sectioned to obtain tumor cells for DNA extraction. However, sectioning without further tumor cell enrichment may result in dilution of tumor DNA template with non-tumor stromal DNA that may compete for primers used in PCR reactions used to amplify potentially mutant loci. To address this problem, microdissection of the histological sections has been used to enrich for tumor cell DNA. The coring procedure used in this study proved to be an adequate and less time consuming method to enrich for tumor DNA than microdissection. In addition, the procedure yielded generous amounts of DNA, important in minimizing the chance of detecting artificial mutations, which is greater when small amounts of starting material are available.24
For these reasons we have used a simple and widely accessible tissue microarray instrument for coring paraffin blocks. This instrument is equipped with set screws to stabilize the paraffin block for further manipulation. The 1 mm coring needle, with which the instrument may be equipped, can be superimposed on areas of the block that contain tumor and the tumor-enriched region can be cored for DNA extraction. Cores are only partially deparaffinized after up to 6 hours of incubation with xylenes at room temperature so that for highest DNA yields overnight deparaffinization is necessary. We have found this procedure is efficient, inexpensive and accurate with no false positives and >20% increase in the frequency of mutations detected by direct sequencing and >12% by ARMS/S. Moreover, microdissection failed to increase the sensitivity of detection in cases selected for their negative results in whole section but positive results in core samples. The yield of DNA averaged >10 micrograms from one or two cores so the ample template was available for retesting and archiving.
Beyond specimen processing is the choice of mutation detection method. Until recently the gold standard and most widely available method for mutation detection was direct sequencing13 of PCR products resulting from the amplification of tumor DNA with KRAS specific primers. This method detects all mutations in amplified DNA sequences, but mutant copies must have a concentration that is at least 20% to 50% of any accompanying wild-type sequences, a sensitivity that may not be optimal for clinical testing.25,26 We found a mutation frequency of 39% for direct sequencing, 7 percentage points lower that the frequency of mutation detected by the more sensitive ARMS/S method.
ARMS is based on the observation that oligonucleotides with a single base mismatch at the 3′ base will not function as primers.19 With proper primer design at the 3′ base, mutant alleles can be preferentially amplified in specimens where mutant copies are at a low concentration. ARMS was used to document KRAS mutation in colon carcinoma a decade ago.21 More recently ARMS has been used in a quantitative PCR platform20 and linked with a bifunctional florescent primer/probe molecule23 (“Scorpions”22). The combined assay uses 7 primer/probes for 7 different mutations KRAS in a single kit that directly detects the presence of KRAS mutation in heterogeneous specimens at a low allelic concentration (1%) without the need for confirmation by direct sequencing. This assay has been successfully used in phase III clinical trials for metastatic colon carcinoma.5,7
In the present study, ARMS/S detected four (17%) more mutations than were initially detected through direct sequencing of DNA-derived from paraffin cores. One of the specimens that was negative by direct sequencing proved positive by repeat testing. The remaining three samples were negative on duplicate testing. That these were not ARMS/S false positives was proven by cloning the DNA and sequencing the resulting clones. Mutant sequence was detected in all samples that were initially negative, indicating the cause of the negative results was low sensitivity (<10% mutant/wild-type ratio). The combination of core sampling of tumor tissue and ARMS/S technique thus provides a particularly sensitive and rapid method for KRAS mutation test. However, ARMS/S is not without limitation since it covers only the common codon 12 and 13 mutations but misses uncommon mutations in codons 13 and 61, which together account for approximately 1% of reported KRAS mutations in colon carcinoma (Sanger Institute, http://www.sanger.ac.uk/perl/genetics/CGP/cosmic?action=gene&ln=KRAS).
A second new method for mutation testing, HRM, directly measures differences in melting point temperatures between matched and mismatched double stranded DNA, either polymorphisms or somatic mutations.18 HRM of KRAS PCR products is inexpensive and rapid. The reported sensitivity of the assay is high with detection of DNA mismatch at a mutant allelic concentration of 5%.17 Recent studies of KRAS mutation in colon carcinoma17 and non-small cell lung carcinoma15,27 suggest that the specificity of the test is high, but the assay does not directly identify specific mutations. This is especially problematic when testing formalin-fixed, paraffin-embedded material due to the artificial mutations mentioned above that are induced by formaldehyde fixative. Because any DNA alteration may produce an abnormal melting point curve, abnormal curves must be confirmed by sequencing. In the present study, while all sequencing confirmed mutations were positive by HRM, abnormal HRM was found in six cases they were not confirmed by either direct sequencing or ARMS/S, suggesting a false positive frequency of >20%. Although HRM may prove to be a helpful screening tool, the requirement for confirmation by a second method increases turn around time and expense and reduces the value of the high sensitivity of the method.
Conclusions
Several methodological variables can affect the outcome of testing for KRAS mutations in formalin-fixed, paraffin-embedded clinical samples. These include the method of sampling the paraffin block and the testing platform used for mutation detection. This study shows that selective sampling of microscopically recognizable tumor cells by full thickness coring of paraffin blocks yields more DNA and results in a higher rate of mutation detection than testing a surface cross section of tumor bearing paraffin block. In comparison with direct sequencing of PCR products, ARMS/S and HRM both detect KRAS mutations at higher frequency but ARMS/S could be verified in all cases by either direct sequencing or a cloning assay, while HRM abnormalities frequently could be verified by neither direct sequencing nor by ARMS/S. ARMS/S offers higher sensitivity and specificity compared with the other two methods tested in this study. The high accuracy of ARMS/S is clinically relevant, as the toxicity and economic burden of a false negative result for a negative predictor is significant. Finally, it should be noted that results for the mutation detection systems reported here apply to KRAS only. Validation of these detection systems for other genes of interest such as epidermal growth factor receptor will require the same rigorous cross comparisons used in this KRAS study.
Acknowledgements
We thank Christopher Korch, PhD, for expert technical assistance.
Footnotes
Supported by NIH NCI Cancer Center grant P30-CA046934 and NIH NCI Early Detection Research Network Grant U01-CA85070.
DxX Limited provided ARMS/S test kits for this study free of charge. No other financial support for this study was received other than the federal grants indicated.
References
- 1.Shih C, Padhy LC, Murray M, Weinberg RA. Transforming genes of carcinomas and neuroblastomas introduced into mouse fibroblasts. Nature. 1981;290:261–264. doi: 10.1038/290261a0. [DOI] [PubMed] [Google Scholar]
- 2.Smit VT, Boot AJ, Smits AM, Fleuren GJ, Cornelisse CJ, Bos JL. KRAS codon 12 mutations occur very frequently in pancreatic adenocarcinomas. Nucleic Acids Res. 1988;16:7773–7782. doi: 10.1093/nar/16.16.7773. [DOI] [PMC free article] [PubMed] [Google Scholar]
- 3.Slebos RJ, Rodenhuis S. The molecular genetics of human lung cancer. Eur Respir J. 1989;2:461–469. [PubMed] [Google Scholar]
- 4.Aviel-Ronen S, Blackhall FH, Shepherd FA, Tsao MS. K-ras mutations in non-small-cell lung carcinoma: a review. Clin Lung Cancer. 2006;8:30–38. doi: 10.3816/CLC.2006.n.030. [DOI] [PubMed] [Google Scholar]
- 5.Amado RG, Wolf M, Peeters M, Van Cutsem E, Siena S, Freeman DJ, Juan T, Sikorski R, Suggs S, Radinsky R, Patterson SD, Chang DD. Wild-type KRAS is required for panitumumab efficacy in patients with metastatic colorectal cancer. J Clin Oncol. 2008;26:1626–1634. doi: 10.1200/JCO.2007.14.7116. [DOI] [PubMed] [Google Scholar]
- 6.Van Cutsem E, Kohne CH, Hitre E, Zaluski J, Chang Chien CR, Makhson A, D'Haens G, Pinter T, Lim R, Bodoky G, Roh JK, Folprecht G, Ruff P, Stroh C, Tejpar S, Schlichting M, Nippgen J, Rougier P. Cetuximab and chemotherapy as initial treatment for metastatic colorectal cancer. N Engl J Med. 2009;360:1408–1417. doi: 10.1056/NEJMoa0805019. [DOI] [PubMed] [Google Scholar]
- 7.Tol J, Koopman M, Cats A, Rodenburg CJ, Creemers GJ, Schrama JG, Erdkamp FL, Vos AH, van Groeningen CJ, Sinnige HA, Richel DJ, Voest EE, Dijkstra JR, Vink-Borger ME, Antonini NF, Mol L, van Krieken JH, Dalesio O, Punt CJ. Chemotherapy, bevacizumab, and cetuximab in metastatic colorectal cancer. N Engl J Med. 2009;360:563–572. doi: 10.1056/NEJMoa0808268. [DOI] [PubMed] [Google Scholar]
- 8.Lievre A, Bachet JB, Boige V, Cayre A, Le Corre D, Buc E, Ychou M, Bouche O, Landi B, Louvet C, Andre T, Bibeau F, Diebold MD, Rougier P, Ducreux M, Tomasic G, Emile JF, Penault-Llorca F, Laurent-Puig P. KRAS mutations as an independent prognostic factor in patients with advanced colorectal cancer treated with cetuximab. J Clin Oncol. 2008;26:374–379. doi: 10.1200/JCO.2007.12.5906. [DOI] [PubMed] [Google Scholar]
- 9.Miller VA, Riely GJ, Zakowski MF, Li AR, Patel JD, Heelan RT, Kris MG, Sandler AB, Carbone DP, Tsao A, Herbst RS, Heller G, Ladanyi M, Pao W, Johnson DH. Molecular characteristics of bronchioloalveolar carcinoma and adenocarcinoma, bronchioloalveolar carcinoma subtype, predict response to erlotinib. J Clin Oncol. 2008;26:1472–1478. doi: 10.1200/JCO.2007.13.0062. [DOI] [PubMed] [Google Scholar]
- 10.Marks JL, Broderick S, Zhou Q, Chitale D, Li AR, Zakowski MF, Kris MG, Rusch VW, Azzoli CG, Seshan VE, Ladanyi M, Pao W. Prognostic and therapeutic implications of EGFR and KRAS mutations in resected lung adenocarcinoma. J Thorac Oncol. 2008;3:111–116. doi: 10.1097/JTO.0b013e318160c607. [DOI] [PubMed] [Google Scholar]
- 11.Pao W, Wang TY, Riely GJ, Miller VA, Pan Q, Ladanyi M, Zakowski MF, Heelan RT, Kris MG, Varmus HE. KRAS mutations and primary resistance of lung adenocarcinomas to gefitinib or erlotinib. PLoS Med. 2005;2:e17. doi: 10.1371/journal.pmed.0020017. [DOI] [PMC free article] [PubMed] [Google Scholar]
- 12.Eberhard DA, Johnson BE, Amler LC, Goddard AD, Heldens SL, Herbst RS, Ince WL, Janne PA, Januario T, Johnson DH, Klein P, Miller VA, Ostland MA, Ramies DA, Sebisanovic D, Stinson JA, Zhang YR, Seshagiri S, Hillan KJ. Mutations in the epidermal growth factor receptor and in KRAS are predictive and prognostic indicators in patients with non-small-cell lung cancer treated with chemotherapy alone and in combination with erlotinib. J Clin Oncol. 2005;23:5900–5909. doi: 10.1200/JCO.2005.02.857. [DOI] [PubMed] [Google Scholar]
- 13.Nollau P, Wagener C. Methods for detection of point mutations: performance and quality assessment. IFCC Scientific Division, Committee on Molecular Biology Techniques. Clin Chem. 1997;43:1114–1128. [PubMed] [Google Scholar]
- 14.Williams C, Ponten F, Moberg C, Soderkvist P, Uhlen M, Ponten J, Sitbon G, Lundeberg J. A high frequency of sequence alterations is due to formalin fixation of archival specimens. Am J Pathol. 1999;155:1467–1471. doi: 10.1016/S0002-9440(10)65461-2. [DOI] [PMC free article] [PubMed] [Google Scholar]
- 15.Do H, Krypuy M, Mitchell PL, Fox SB, Dobrovic A. High resolution melting analysis for rapid and sensitive EGFR and KRAS mutation detection in formalin-fixed paraffin-embedded biopsies. BMC Cancer. 2008;8:142. doi: 10.1186/1471-2407-8-142. [DOI] [PMC free article] [PubMed] [Google Scholar]
- 16.Krypuy M, Newnham GM, Thomas DM, Conron M, Dobrovic A. High resolution melting analysis for the rapid and sensitive detection of mutations in clinical samples: kRAS codon 12 and 13 mutations in non-small cell lung cancer. BMC Cancer. 2006;6:295. doi: 10.1186/1471-2407-6-295. [DOI] [PMC free article] [PubMed] [Google Scholar]
- 17.Simi L, Pratesi N, Vignoli M, Sestini R, Cianchi F, Valanzano R, Nobili S, Mini E, Pazzagli M, Orlando C. High-resolution melting analysis for rapid detection of KRAS. BRAF, and PIK3CA gene mutations in colorectal cancer. Am J Clin Pathol. 2008;130:247–253. doi: 10.1309/LWDY1AXHXUULNVHQ. [DOI] [PubMed] [Google Scholar]
- 18.Gundry CN, Vandersteen JG, Reed GH, Pryor RJ, Chen J, Wittwer CT. Amplicon melting analysis with labeled primers: a closed-tube method for differentiating homozygotes and heterozygotes. Clin Chem. 2003;49:396–406. doi: 10.1373/49.3.396. [DOI] [PubMed] [Google Scholar]
- 19.Newton CR, Graham A, Heptinstall LE, Powell SJ, Summers C, Kalsheker N, Smith JC, Markham AF. Analysis of any point mutation in DNA. The amplification refractory mutation system (ARMS) Nucleic Acids Res. 1989;17:2503–2516. doi: 10.1093/nar/17.7.2503. [DOI] [PMC free article] [PubMed] [Google Scholar]
- 20.Clayton SJ, Scott FM, Walker J, Callaghan K, Haque K, Liloglou T, Xinarianos G, Shawcross S, Ceuppens P, Field JK, Fox JC. K-ras point mutation detection in lung cancer: comparison of two approaches to somatic mutation detection using ARMS allele-specific amplification. Clin Chem. 2000;46:1929–1938. [PubMed] [Google Scholar]
- 21.Fox JC, England J, White P, Ellison G, Callaghan K, Charlesworth NR, Hehir J, McCarthy TL, Smith-Ravin J, Talbot IC, Snary D, Northover JM, Newton CR, Little S. The detection of K-ras mutations in colorectal cancer using the amplification-refractory mutation system. Br J Cancer. 1998;77:1267–1274. doi: 10.1038/bjc.1998.212. [DOI] [PMC free article] [PubMed] [Google Scholar]
- 22.Thelwell N, Millington S, Solinas A, Booth J, Brown T. Mode of action and application of Scorpion primers to mutation detection. Nucleic Acids Res. 2000;28:3752–3761. doi: 10.1093/nar/28.19.3752. [DOI] [PMC free article] [PubMed] [Google Scholar]
- 23.Whitcombe D, Theaker J, Guy SP, Brown T, Little S. Detection of PCR products using self-probing amplicons and fluorescence. Nature Biotechnol. 1999;17:804–807. doi: 10.1038/11751. [DOI] [PubMed] [Google Scholar]
- 24.Srinivasan M, Sedmak D, Jewell S. Effect of fixatives and tissue processing on the content and integrity of nucleic acids. Am J Pathol. 2002;161:1961–1971. doi: 10.1016/S0002-9440(10)64472-0. [DOI] [PMC free article] [PubMed] [Google Scholar]
- 25.Frayling IM. Methods of molecular analysis: mutation detection in solid tumours. Mol Pathol. 2002;55:73–79. doi: 10.1136/mp.55.2.73. [DOI] [PMC free article] [PubMed] [Google Scholar]
- 26.Gallegos Ruiz MI, Floor K, Rijmen F, Grunberg K, Rodriguez JA, Giaccone G. EGFR and K-ras mutation analysis in non-small cell lung cancer: comparison of paraffin embedded versus frozen specimens. Cell Oncol. 2007;29:257–264. doi: 10.1155/2007/568205. [DOI] [PMC free article] [PubMed] [Google Scholar]
- 27.Takano T, Ohe Y, Tsuta K, Fukui T, Sakamoto H, Yoshida T, Tateishi U, Nokihara H, Yamamoto N, Sekine I, Kunitoh H, Matsuno Y, Furuta K, Tamura T. Epidermal growth factor receptor mutation detection using high-resolution melting analysis predicts outcomes in patients with advanced non small cell lung cancer treated with gefitinib. Clin Cancer Res. 2007;13:5385–5390. doi: 10.1158/1078-0432.CCR-07-0627. [DOI] [PubMed] [Google Scholar]