

Abstract
The human CYP1A1_CYP1A2 locus comprises the CYP1A1 (5,988 bp) and CYP1A2 (7,759 bp) transcribed regions, oriented head-to-head, sharing a bidirectional promoter of 23,306 bp. The older CYP1A1 gene appears more conserved and responsible for critical life function(s), whereas the younger CYP1A2 gene might have evolved more rapidly due to environmental (dietary) pressures. A population genetics study might confirm this premise. We combined 60 CYP1A1_CYP1A2 SNPs found in the present study (eight New Guinea Highlanders, eight Samoans, four Dogrib, four Teribe, four Pehuenche, one Caucasian) with those found in a previous study (six West Africans, four Han Chinese, six Germans, four Samoans, and four Dogrib)—yielding a total of 106 SNPs in 106 chromosomes. Resequencing of Oceanians plus Amerindians in the present study yielded 21 New World SNPs (~20%), of which 17 are not previously reported in any SNP database. Various tests revealed selective pressures for both genes and both haploblocks; unfortunately, differences in rates of evolution between the two genes were undetectable. Fay & Wu's H test revealed a “hitchhiking event” centered around four SNPs in the CYP1A1 3'-UTR; a study in silico identified different microRNA-binding patterns in the hitchhiked region, when the mutations were present compared with the mutations absent.
Keywords: CYP1A1, CYP1A2, aryl hydrocarbon receptor, AHR, microRNA
INTRODUCTION
The human and mouse cytochrome P450 (CYP) gene superfamilies comprise 57 and 102 protein-coding genes, respectively, in their genomes. One of the 18 mammalian CYP families is CYP1, which contains three highly conserved members in both human and rodent—CYP1A1, CYP1A2 and CYP1B1 (Nebert et al., 2004; Nelson et al., 2004; Nebert and Dalton, 2006). The CYP1A and CYP1B subfamily ancestors diverged from one another probably more than 450 million years ago (MYA), whereas CYP1A2 arose as a gene duplication event from CYP1A1 ~420 MYA (Nelson et al., 1996). Thus, land vertebrates carry both CYP1A1 and CYP1A2, whereas sea vertebrates carry only the original CYP1A1 gene. Invertebrates appear not to have CYP1 genes. The human CYP1A1 and CYP1A2 genes are located on chromosome 15q24.1 and oriented head-to-head, 23,306 bases from one 5'-most transcription start-site (TSS) to the other (Jiang et al., 2005); although greater than 1,000 bp apart (Xie et al., 2007), these two divergent genes clearly share a bidirectional promoter (BDP).
Both CYP1A1 and CYP1A2 are up-regulated by aryl hydrocarbon receptor (AHR) when activated by ligands such as polycyclic aromatic hydrocarbons (PAHs), dioxin and β-naphthoflavone (Nebert et al., 2004) and several dozen possible endogenous ligands (Nebert and Karp, 2008; Nguyen and Bradfield, 2008); at least 13 AHR response elements (AHREs) reside within the BDP (Corchero et al., 2001). CYP1A1 is the older gene, its promoter-only-driven constitutive expression is nil, its induced expression occurs in virtually all tissues and cell types, and few if any drugs are metabolized by CYP1A1. Except for eicosanoid metabolism (Nebert and Karp, 2008), CYP1A1 substrates most often studied include various halogenated and non-halogenated PAH procarcinogens.
CYP1A2 is the younger gene, it is constitutively highly expressed in liver, it is inducible (mostly in liver, lung, pancreas, GI tract and brain), and about two dozen drugs are metabolized by CYP1A2 (http://medicine.iupui.edu/clinpharm/ddis/table.asp). Endogenous substrates include estradiol-17β, melatonin, uroporphyrinogen III (Nebert et al., 2004), and eicosanoids (Nebert and Karp, 2008); CYP1A2 foreign substrates most often studied include various arylamine and N-heterocyclic procarcinogens. Developmentally, CYP1A1 is expressed very early during embryogenesis—even in the fertilized ovum (Nebert et al., 2000)—whereas CYP1A2 activity does not appear until the neonatal period (Nebert et al., 2004). Both CYP1A1 and CYP1A2 appear to metabolize at least one unknown endogenous AHR ligand, which participates in autoregulation for members of the PAH-inducible [Ah] locus (RayChaudhuri et al., 1990; Nebert et al., 2000).
Little is known about BDPs, which lie between adjacent genes and are transcribed from opposite strands of DNA. BDPs are common, however: of three mammalian genomes studied, about 10% of gene-duplication pairs have been estimated to share BDPs (Li et al., 2006). CpG-islands in BDPs encompass both TSSs and appear to dominate the regulatory landscape of this group of promoters, while TATA motifs are more likely to be asymmetrically positioned at only one TSS or the other (Yang and Elnitski, 2008). The CYP1A1 region from −464 to −1,829 has been found to up-regulate transcriptional activation of not just CYP1A1 but also CYP1A2; also, the CYP1A2 region between −1,313 and −4,316 was shown to down-regulate transcription of both genes (Ueda et al., 2006).
Studying genotype data from 94 African, 83 Caucasian and 96 Asian individuals—a putative 5.96-kb recombination hot spot in the BDP region was mapped between −8,750 upstream of the CYP1A1 gene and −8,597 upstream of the CYP1A2 gene (Jiang et al., 2005); these results suggest that the linkage disequilibrium (LD) blocks of CYP1A1 and CYP1A2 in offspring can differ from one generation to the next. The origin, function, and evolution of recombination hot spots are largely unknown. Recently, the combination of sperm-typing technologies, linkage studies, and computational inferences from population genetic data has provided unprecedented details about location and activity of meiotic recombination hot spots in humans and mice. The vast majority of recombination events are localized to narrow DNA regions comprising only a small fraction of the genome, and the molecular basis of hot-spot activity appears unlikely to be determined strictly by specific DNA sequence motifs in cis (Arnheim et al., 2007; The ENCODE Project Consortium, 2007).
The latest demographic history of modern human migration indicates that the majority of worldwide non-African genetic diversity (Behar et al., 2008) is derived from an out-of-Africa dispersal 50,000 to 65,000 years before the present (YBP). Whereas one migration that moved northward ~40,000 YBP comprised the Caucasian branch, earlier migrations eastward led to the northern and southern East Asian branches. Although mitochondrial gene flow is extensive between non-African populations, there appears to be little if any gene flow between European and Asian populations (Garrigan et al., 2007). Major parts of “near Oceania” (Melanesia, which includes New Guinea) were settled between ~50,000 and ~30,000 YBP and “remote Oceania” (including Samoa) soon thereafter (Friedlaender et al., 2008). With regard to colonizing the Americas, current genetic evidence implies dispersal from a single Siberian population toward the Bering Land Bridge between 30,000 and 22,000 YBP and then migration from Beringia to the Americas ~16,500 YBP (Goebel et al., 2008; Volodko et al., 2008). Thus, the five major geographically-isolated groups are: three Old World (African, Caucasian, Asian) and two New World groups (Oceanian and Amerindian).
The current report presents resequencing data across the same 39.6-kb CYP1A1_CYP1A2 locus in five New World populations (New Guinea Highlander, Samoan = Oceanians; Dogrib, Teribe and Pehuenche = Amerindians). These data were then combined with our previous resequencing results from Africans, East Asians, Caucasians, Samoans and Dogrib (Jiang et al., 2005). All populations in the present study plus the 2005 study were examined for exactly the same nucleotides, i.e. there is no bias when examining and comparing genomic regions in these human populations. This analysis of data from eight world populations thus provides the most complete data set for the CYP1A1_CYP1A2 locus.
Our hypothesis is that the older CYP1A1 gene is more highly conserved and is required for an important critical life function(s), whereas the younger CYP1A2 gene arose as a duplication event and subsequently became “fixed” in land vertebrates probably because of dietary selective pressure (Nebert et al., 2000). Today's prescribed drugs are derived from plant metabolites (Nebert and Dieter, 2000); CYP1A2 substrates include drugs, whereas CYP1A1 substrates do not. Thus, we postulate that the CYP1A2 gene has continued to adapt to a changing environment and may have evolved more rapidly than CYP1A1. It was therefore hoped that a population genetics analysis of variation, across eight world populations, might provide new information about the possible roles of selection and rates of evolution of the two genes comprising the CYP1A1_CYP1A2 locus.
MATERIALS AND METHODS
Human Subjects
We selected the following unrelated subjects from five populations belonging to two major geographically-isolated groups: 16 Oceanians (eight New Guinea Highlanders; eight Samoans) and 12 Amerindians (four Dogrib, North America; four Teribe, Central America; four Pehuenche, South America). Analysis of anonymous human DNA samples was approved by the Institutional Review Board at the University Cincinnati Medical Center. One Caucasian DNA sample (CEPH 1347-02) was obtained from Applied Biosystems (Foster City, CA) and sequenced alongside the DNA from Oceanians and Amerindians for quality control purposes; results for this sample were incorporated into our analyses.
DNA resequencing and SNP discovery
The resequenced genomic region has previously been detailed; the same primers were employed (Jiang et al., 2005). The 39.6-kb region—encompassing the entire transcribed regions of the CYP1A1 and CYP1A2 genes, some 3' flanking sequence, and the BDP region—was first masked by RepeatMasker program and then submitted to Primer3 for primer design. Those regions having >85% highly repetitive sequences were excluded. Consequently, 5,876 bp (out of 5,988-bp total) were scanned for the CYP1A1 gene, and 6,458 bp (out of 7,759-bp total) were scanned for the CYP1A2 gene; 1,495 bp of the CYP1A1 3' flank and 1,047 bp of CYP1A2 3' flank were resequenced; and 14,038 bp (out of 23,306-bp total) were scanned for the BDP. Overall, 28,914 bp (out of 39,595-bp total) were resequenced, the remainder representing >85% highly repetitive DNA. Target fragments were amplified from genomic DNA of the 28 subjects, using the HotStarTaq polymerase kit (Qiagen; Valencia, CA). Fragments were purified using the Qiaquick 96 PCR purification kit (Qiagen) and sequenced using the BigDyeTerminator v3.1 kit (Applied Biosystems; Foster City, CA). Products generated using this kit were cleaned with the DyeEX 96 kit for terminator removal (Qiagen) and analyzed in the 3130 Gene Analyzer (Applied Biosystems).
Data Analysis
Most of our analyses were done on the combined data—obtained from the present study, plus our previous resequencing study (Jiang et al., 2005). Software employed for data analysis included: single-nucleotide polymorphism (SNP) identification by Polyphred (droog.gs@washington.edu); analysis of transcription-factor-binding sites (TFBS) by MAPPER search engine (http://mapper.chip.org) (Marinescu et al., 2005); LD analysis by Haploview v4.1 (Barrett et al., 2005); analysis of molecular variation by Arlequin v3.11 (Schneider et al., 2000); local alignment of sequences among human, chimpanzee (Pan troglodytes), orangutan (Pongo pygmaeus), and gorilla (Gorilla gorilla) by NCBI Blast (http://blast.ncbi.nlm.nih.gov) and Ensembl Blast (http://www.ensembl.org/Multi/blastview); phasing of SNPs to infer haplotypes by Phase v2.1 (Stephens et al., 2001; Stephens and Scheet, 2005); nucleotide and haplotypes diversity, divergence, neutrality testing and sliding-window neutrality testing by DnaSP v5.00.07 (Rozas et al., 2003); search for microRNA (miR) target sites by miRBase Targets v.5 [http://microrna.sanger.ac.uk/targets/v5/; (Griffiths-Jones et al., 2006)], microRNA target prediction [http://www.microrna.org/microrna/getGeneForm.do; (Betel et al., 2008)] and STarMir [http://sfold.wadsworth.org/starmir.pl; (Long et al., 2007)].
RESULTS AND DISCUSSION
CYP1A1_CYP1A2 Locus SNP Discovery in Eight World Populations
Resequencing the CYP1A1_CYP1A2 locus from 58 chromosomes (the five above-mentioned populations plus one Caucasian individual) resulted in 60 SNPs (Supp. Table S1, yellow background). Combining these 60 SNPs with those from our preceding study (Jiang et al., 2005) gave a total of 106 SNPs (Supp. Table S1). Eighty-one SNPs had previously been located by resequencing a total of 48 chromosomes in five populations [12 West Africans (Beninese), eight East Asians (Han Chinese), 12 European Caucasians (German), eight Samoans, and eight Dogrib]. In that study, four additional SNPs (on green background, Supp. Table S1) were uncovered while genotyping a large panel of subjects (Jiang et al., 2005). Of these 85 original SNPs, we found 39 in the present study (Supp. Table S1, black letters on yellow background), i.e. the other 46 were not detected. Resequencing of Oceanians plus Amerindians in the present study thus yielded 21 SNPs (Supp. Table S1, red letters on yellow background) that had not been detected earlier (Jiang et al., 2005), of which 17 are completely new and not reported in any SNP database. Of these 17 new SNPs, two are nonsynonymous (CYP1A1 gene), seven are intronic (one in CYP1A1, six in CYP1A2), one occurs in the CYP1A2 3'-untranslated region (3'-UTR), and seven are located in the BDP.
Distribution of the 106 SNPs found in three Old World and two New World groups is outlined in Fig. 1. In terms of percentages, 85/106 (80.2%) of the SNPs found worldwide were detected by examining only the African, East Asian and Caucasian samples, whereas 21/106 (19.8%) were found when the Oceanian and Amerindian samples are included. These data show that ~20% of the world diversity for the CYP1A1_CYP1A2 locus is contributed by extending our search to the Oceanian and Amerindian populations.
FIGURE 1.

Distribution of the 106 SNPs across the CYP1A1_CYP1A2 locus found by us in Old World, Amerindian, and Oceanian populations. Forty-five SNPs are only found in the Old World, 15 SNPs in Oceanian, and six SNPs in Amerindian populations. One SNP is shared between Oceanian and Old World, 16 SNPs shared between Amerindian and Old World, and 23 SNPs shared among all three populations.
There have been discussions about the value of extending HapMap studies to include the Oceanian and Amerindian groups. One study described the haplotype structure across 12 Mb of DNA sequence in 927 individuals representing 52 populations (Conrad et al., 2006); another study examined dense SNP data uniformly across samples of the 15 HapMap phase III populations (de Bakker et al., 2006). These two studies had suggested that detailed SNP discovery in Oceanian and Amerindian groups might not add that much additional knowledge to our current SNP databases to justify the additional costs and effort. Our data on the CYP1A1_CYP1A2 locus would dispute that implication.
Table 1 summarizes the SNP density in the CYP1A1 and CYP1A2 genes and their shared BDP; less than 2-fold differences in SNP density exist between the two genes, or between each of them and the BDP. Pairwise comparisons of corresponding locations in both genes showed a significant difference (p<0.05 by χ2 test) in the intronic-region SNP density between CYP1A1 and CYP1A2, with CYP1A2 showing greater density. For CYP1A1, there was a significant difference (p <0.001) between the intronic region and the 3'-UTR, the latter showing a higher SNP density.
TABLE 1.
General Location of SNPs Found and SNP Densities across the CYP1A1_CYP1A2 locus
| Genome region | Length (bp) | SNPs | SNP Density | ||
|---|---|---|---|---|---|
| Location | Number | (%) | (SNP/kb) | ||
| CYP1A1 | 1540 | Exons | 6 | 27.3 | 3.90 |
| 121 | 5'-UTR | 0 | 0 | 0.00 | |
| 3275 | Introns | 4 | 18.2 | 1.22* | |
| 940 | 3'-UTR | 8 | 36.4 | 8.51 | |
| 1495 | 3'flank | 4 | 18.2 | 2.68 | |
| 7371 (111 bp masked) | TOTAL | 22 | 100 | 2.98 | |
|
| |||||
| CYP1A2 | 1551 | Exons | 7 | 25.0 | 4.51 |
| 64 | 5'-UTR | 0 | 0 | 0.00 | |
| 3764 | Introns | 16 | 57.1 | 4.25* | |
| 1079 | 3'-UTR | 3 | 10.7 | 2.78 | |
| 1047 | 3'flank | 2 | 7.14 | 1.91 | |
| 7505 (1300 bp masked) | TOTAL | 28 | 100 | 3.73 | |
|
| |||||
| BDP region | 14038 (9268 masked) | TOTAL | 56 | 100.00 | 3.99 |
Significantly different from each other (p <0.05). For CYP1A1, exons/introns and flanking regions were obtained from Ensembl transcript ENST00000395048; the “gene”, from the TSS to the end of exon 7 plus 1495 bp of the 3'-flanking region, totals 7371 bp. For CYP1A2, the same information was obtained from ENST00000343932; the “gene”, from the TSS to the end of exon 7 plus 1047 bp of the 3'-flanking region, totals 7505 bp.
Comparison between Previously Reported SNPs and the 106 SNPs Found by This Lab
Supp. Table S2 lists the 295 SNPs so far detected in the genomic region of interest—278 previously reported in the literature plus the 17 new SNPs found in the present study. The regions downstream of CYP1A1 +5000 and CYP1A2 +8000 were not included in the present study, and we had resequenced 28,914 bp of the 39,595-bp total (the remaining 10.7 kb of repetitive DNA being masked). SNPs determined by others to be located in those mentioned downstream regions and masked regions add up to 74 (Supp. Table S3). Hence, in our resequenced area of 28,914 bp, there are 221 SNPs detected previously (and by the present study); of these, our studies found 48% of all SNPs reported worldwide (Supp. Table S3).
Frequency and Distribution of Individual SNPs in World Populations
Combining resequencing results from the current study and previous study (Jiang et al., 2005), Supp. Table S4 lists allele frequencies (PA2, frequency of the alternative allele A2) of 102 SNPs in the eight populations; the other four SNPs reported in 2005 (Supp. Table S1, green background) were found during genotyping of large panels of individuals (Africans, Caucasians, Asians) rather than resequencing, so they are not included in Supp. Table S4. In total, allele frequency data were obtained from 106 chromosomes: 12 African, 14 Caucasian, eight Asian, 24 Samoan, 16 New Guinean, eight Pehuenche, eight Teribe and 16 Dogrib.
These allelic frequencies calculated from our studies are admittedly rough estimates of their true value—because of the limited number of chromosomes analyzed. In addition, only SNPs with PA2 above a certain level are detectable [i.e. at least 1/8 (12.5%) for Asian, Pehuenche and Teribe and 1/12 (8.3%) for African]. Despite this limitation, we have attempted to classify these common 102 SNPs: [a] 14 cosmopolitan SNPs (13.7%), present in all five major groups; [b] 26 SNPs (25.5%), present in at least one Old World and one New World group; [c] 41 SNPs (40.2%), present in one or more Old World groups; and [d] 21 SNPs (20.6%) present in one or more New World groups.
Possible Significance of Newly Found Nonsynonymous SNPs
The CYP1A1 +262 nonsynonymous SNP causes a Gly88Ser change; this mutation (found in a Pehuenche) results in a side-chain-polarity amino acid, where previously there was no polarity. The equivalent position to CYP1A1 Gly88 in the CYP1A2 protein (Sansen et al., 2007) is Arg90, a positively-charged amino acid; thus, any argument about a neutral vs side-chain-polarity amino acid in CYP1A1 does not take into consideration the positive amino acid at this position in CYP1A2. Arg90 is in a charge pair with Glu419. Analysis of this residue position using the known crystalline structure of CYP1A2 (Sansen et al., 2007) shows that the equivalent residue is located in the NH2-terminus of the B helix 17 amino acids before the substrate-recognition site-1 (SRS1); this residue is also exposed to the surface, and the presence of a glycine at the end of the helix is related to its role in turn-formation and capping of the helix. The exchange from glycine to serine might allow the helix to extend slightly. Moreover, a serine has the possibility of forming hydrogen bonds with residues close in space—such as Ser64 (in the A helix), Asp72 (at the beginning of beta 1–1), or Gln413 and Asp417 (in the K' helix). However, the Gly88Ser exchange most likely will have no effect on substrate specificity, enzyme activity, or phosphorylation (David R. Nelson, personal communication).
The CYP1A1 +322 nonsynonymous SNP causes an Asp108Tyr modification; this mutation (found in a Samoan) replaces a charged amino acid with a non-charged one. Asp108 could possibly share a polar interaction with Thr113 in CYP1A1. Analysis of this residue position, again using the crystalline structure of human CYP1A2 (Sansen et al., 2007), shows that the equivalent position is Glu103, located between beta-1–5 and the NH2-terminus of the B' helix; this position is not well conserved and is located inside the SRS1. This is a surface-exposed residue and does not point into the enzyme active-site; hence, the Asp108Tyr alteration most likely will have no effect on enzyme activity or substrate specificity (David R. Nelson, personal communication).
Analysis of Newly Found SNPs in the BDP
Using MAPPER and transcription factor databases Transfac and Jaspar, we carried out in silico analysis (Table 2) of seven newly found BDP SNPs that might alter transcription-factor-binding sites (TFBSs); we considered only transcription factors that are likely to bind to specific sequences in the BDP containing either the reference (A1) or alternative/mutant (A2) allele. E-values denoting statistical significance are also included, because some of these predictions might represent either weak binding or false positives, i.e. not a true homolog of the model employed to identify the TFBS. In addition, Table 2 presents the model sequence utilized by the software to detect the TFBS. In several instances, in silico analysis of the SNP indicated that the transcription factor might bind to the TFBS when either the A1 or A2 allele is present—the only difference being a weaker or stronger binding. Only in the case of two SNPs (CYP1A1 −2597 and CYP1A2 −8847) was there some indication of the possible SNP-related appearance or disappearance of a TFBS. Table 2 lists the results for four out of seven newly-found BDP SNPs; the other three SNPs either were not associated with any TFBS (CYP1A1 −2684 and −9782), showed possible binding with E-values >10, or were found only in invertebrate transcription factor models (CYP1A1 −2575).
TABLE 2.
Identification of New SNPs that Might Alter TFBS in the BDP Region*
| Chr. position | Relative position | A1 | A2 | TF binding to A1 | E-value | TF binding to A2 | E-value | Sequence of model employed by Mapper |
|---|---|---|---|---|---|---|---|---|
| g.72805087 | CYP1A1 –2596 | G | A | RREB-1 | 9 | RREB-1 | 7.6 | ccccaaaccaccccccccca |
| g.72805088 | CYP1A1 –2597 | G | A | RREB-1 | 9 | RREB-1 | 6.9 | ccccaaaccaccccccccca |
| none | - | MZF_5–13 | 10.0 | tagggggaa | ||||
| g.72820071 | CYP1A2 –9062 | A | C | TP53 | 0.27 | TP53 | 2.1 | ccggacatgcccgggcatgt |
| g.72820286 | CYP1A2 –8847 | G | T | MAF | 4.3 | none | -- | tagagggaagttgcct |
| Staf | 1.0 | none | -- | gatttcccataatgccttgc |
These TFBS were predictions made by the software MAPPER having E-values ≤10. E-values refer to the probability of obtaining a good hit by chance alone; hence, the smaller the E-value, the better the likelihood that the site is significant rather than random. The TFBS listed in this table include those found in land vertebrates (H. sapiens, M. musculus or X. laevis). We have excluded TFBS recognized in sea vertebrates or lower organisms because they are known not to carry an ortholog of CYP1A2. The consensus sequence of each model comes from the databases Transfac and Jaspar. Relative positions listed are calculated with respect to the translation start codon.
Reanalysis of BDP Region in the Search for Functional AHREs
Using dual reporter genes and vectors encompassing the entire BDP, it has been demonstrated experimentally (Ueda et al., 2006) that at least 13 AHREs, to which the AHR-ARNT heterodimer binds, are among the most prominent regulatory motifs in the CYP1A1_CYP1A2 locus (Fig. 2). AHREs appear to operate cooperatively in the activation of both genes, suggesting that the same AHRE cluster might work bidirectionally in controlling transcription of both CYP1A1 and CYP1A2.
FIGURE 2.

Location and function of AHREs across the BDP of the CYP1A1_CYP1A2 locus. Positions relative to the CYP1A1 TSS are shown above, whereas those relative to the CYP1A2 TSS are written below the line (at top). Closed circles represent AHRE motifs previously reported; open circles denote two new sites identified in the present study. The graphical location of the original 13 AHREs and the regions of transactivation and suppression are a modification from a previous study (Ueda et al., 2006) which reported transactivation and suppression effects. For example, AHRE1 to AHRE7 are associated with transcriptional activation of CYP1A1; AHRE1 to AHRE5 are correlated with transcriptional activation of CYP1A2; and AHRE13 is associated with suppression of both genes. “??” denotes the BDP segment containing six AHRE motifs whose functions are not known and some of which are located in the putative recombination hot-spot.
An AHRE cluster close to CYP1A1 (−464 to −4621 bp upstream of the TSS consisting of at least seven of these motifs) was found (Ueda et al., 2006) to be associated with CYP1A1 up-regulation in the presence of known AHR ligands (Fig. 2). Intriguingly, this same cluster, but only the first five AHREs (−464 to −1829 bp upstream of the CYP1A1 TSS), activates CYP1A2 transcription. AHREs positioned between −1829 and −4621 bp upstream of the CYP1A1 TSS appear to function differently for CYP1A1 than for CYP1A2: whereas their presence increases CYP1A1 transcription, their absence increases CYP1A2 transcription during AHR activation by ligands (Ueda et al., 2006). An AHRE cluster close to CYP1A2 had been reported correlated with CYP1A2 up-regulation (Quattrochi and Tukey, 1989; Quattrochi et al., 1994); however, recent studies have shown that the region between −1329 and −4412 bp upstream of CYP1A2 TSS is associated with suppression of both CYP1A1 and CYP1A2 transcription (Ueda et al., 2006).
Using MAPPER and model MA00265 (8 bp; AHRE consensus sequence deduced from 24 human, mouse and rat sequences) from Transfac, we carried out in silico reanalysis of the BDP region (23,306-bp sequence from the latest version of Chr 15, NC_000015); this analysis yielded two new sites (Fig. 2, open circles) in addition to the 13 previously reported. Supp. Table S5 summarizes all 15 AHREs which gave statistically significant E-values of <0.10. Using the latest Chr 15 sequence, Supp. Table S5 provides updated relative nucleotide positions from both the CYP1A1 and CYP1A2 transcription, as well as translation, start-sites.
A newly-identified AHRE, −386 bp upstream of the CYP1A1 TSS, is located 369 bp upstream of the TATA-box and 337 bp upstream of the basal-transcription-element-binding site of CYP1A1; it is possible that this AHRE might be part of the activation cluster that controls both CYP1A1 and CYP1A2 up-regulation. The other newly-identified AHRE, −7504 bp upstream of the CYP1A1 TSS, resides in a BDP region for which no solid experimental conclusions have been reached—as far as any role in the regulation of either gene.
Of significance in our reanalysis of the BDP, five AHREs are positioned within the 10,681 bp that we had masked (−3065, −12210, −12381, −18606 and −20813 from the CYP1A1 TSS). Information about possible SNPs affecting these AHREs is lacking in our study; however, the AHRE at −20813 from the CYP1A1 TSS might be considered to have significance, because this motif is within the region associated with transcriptional down-regulation of both CYP1A1 and CYP1A2 (Ueda et al., 2006). On the other hand, the AHRE at −3065 from the CYP1A1 TSS is part of the cluster associated with CYP1A1 transcriptional activation, and a study (Ueda et al., 2006) suggests that loss of individual AHREs probably has no major impact on the overall synergistic activity of the cluster.
Pertaining to the 56 SNPs found in the BDP by our group previously (Jiang et al., 2005) plus the present study, only one SNP (CYP1A1 −3492 from translation start-site) might potentially affect binding of the AHR-ARNT heterodimer to the AHRE, because of its proximity to the 8-bp AHRE motif; yet, analysis of this SNP by MAPPER, under all models examined, indicated this possibility to be unlikely. Furthermore, the AHRE that could potentially be affected (CYP1A1 −1053 from TSS) belongs to the cluster associated with transcriptional activation of both genes. However, as noted above, one study (Ueda et al., 2006) suggests that loss of binding to a single AHRE of the cluster will not affect its cooperative activity.
Supp. Table S1 lists the positions of all 15 AHREs. Also included in Supp. Table S1 are the positions of a second response element, termed “XRE II”, proposed to participate in the transcriptional activation of CYP1A1 and CYP1A2 by means of AHR-independent ligand-activated co-activation (Boutros et al., 2004), and positions of E-box motifs, suggested to regulate CYP1A2 basal transcription (Quattrochi and Tukey, 1989; Quattrochi et al., 1994).
Population Genetics Analyses
We included the 102 SNPs for which genotyping data were obtained by resequencing; we excluded the four SNPs (Supp. Table S1, green background) found while genotyping large panels of subjects (Jiang et al., 2005). Most calculations were performed by combining samples from all eight different populations into one single pooled world population (106 chromosomes).
Linkage Disequilibrium (LD) between Segregating Sites and Determination of Haplotype Blocks
For the LD study, we selected SNPs having a minor-allele frequency (MAF) ≥0.05; this eliminates alleles (among the 106 chromosomes) having four or fewer copies and reduces the possibility of spurious LD between sites that can be produced in a pooled population (Chakraborty and Weiss, 1988). As was found earlier (Jiang et al., 2005), the CYP1A1 and CYP1A2 genes are located in distinct blocks of high LD (Fig. 3A), which show few historic recombination events. Between these haploblocks is located a region of relatively low LD, where SNP pairs (Fig. 3B. depicted in white) are present with four gametes; these data suggest a direct signature of past recombination—barring recurrent mutation (also called the “four-gamete” test). Data for this 4.75-kb segment (located between SNPs CYP1A1 −11741 and CYP1A2 −10153) suggest the presence of a recombination hotspot. Interestingly, this segment is within the 5.96-kb segment previously proposed as a recombination hotspot (Jiang et al., 2005).
FIGURE 3.
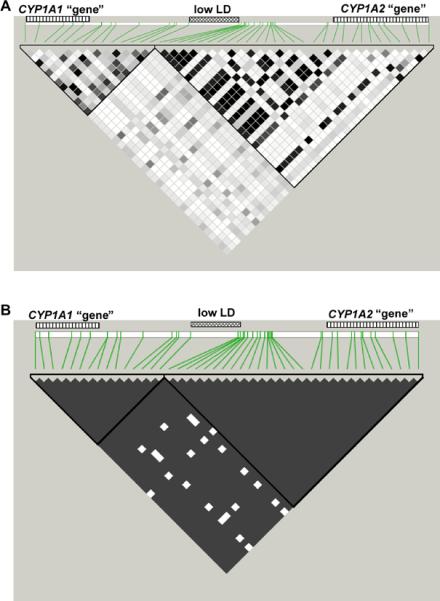
LD pattern of the CYP1A1_CYP1A2 locus, as determined by data from the pooled population of 53 individuals. The LD color scheme corresponds to r2 measurements (A) and to results from the “four-gamete test” (B) for all pairs of selected markers (43 SNPs having MAF >0.05). Striped bars on top of the map correspond to the general location of the CYP1A1 (left) and CYP1A2 (right) “genes”, whereas the middle bar marks the location of a 4.75-kb region of low LD, where a putative recombination hot-spot might be located (see text). The marked haploblocks were defined by the four-gamete rule, with the four-gamete frequency >0.05 (14 CYP1A1 haploblock SNPs; 29 CYP1A2 haploblock SNPs).
Once the haploblocks were defined, we classified the 102 SNPs as belonging to the CYP1A1 haploblock (46 SNPs, Supp. Table S1: SNPs #1–46), CYP1A2 haploblock (54 SNPs, Supp. Table S1: SNPs #49–102) or the putative recombination hotspot region (two SNPs, Supp. Table S1: SNPs #47–48). We then used each set of SNPs to infer haplotypes of the CYP1A1 and CYP1A2 haploblocks. Likewise, we used the 21 SNPs and 28 SNPs found in the CYP1A1 and CYP1A2 gene regions1, respectively, to infer haplotypes of the genes.
Nucleotide and Haplotype Diversity
Of the 102 SNPs, 38 segregate singletons and the major allele confirmed nucleotides matching those of the chimpanzee, except for CYP1A1 −9549 (Supp. Table S6). Thirteen SNPs were located in coding regions: six for CYP1A1 and seven for CYP1A2, of which nine result in amino-acid changes (six for CYP1A1, three for CYP1A2) and four synonymous (all in CYP1A2).
Table 3 shows the summary statistics of the nucleotide and haplotype diversities for both “genes” and the haploblocks containing them. In addition, we added the respective nucleotide- diversity calculations for the total resequenced area (both haploblocks plus the putative recombination hotspot). The average expected heterozygosity θW, calculated from the number of segregating sites (Watterson, 1975), is higher than the nucleotide diversity π, calculated from the number of pairwise sequence differences—for both “genes” and for both haploblocks. The value of θW is influenced by low-frequency variants, such as singletons, whereas π is driven by intermediate-frequency variants; π is thus a reflection of heterozygosity and comparable to the average heterozygosity across sequenced sites, notwithstanding slight differences arising from the phasing-inference method and its underlying assumptions (Nei and Kumar, 2000). We calculated Nei's average heterozygosity for the CYP1A1 and CYP1A2 “genes” (3.03 × 10⁻⁴ and 3.82 × 10⁻⁴, respectively) and found that the difference of these values from π (3.06 × 10⁻⁴ and 3.86 × 10⁻⁴, respectively) is in the range of 3 to 4 nucleotide changes per million bases sequenced.
TABLE 3.
Nucleotide and Haplotype Diversity and Divergence*
| CYP1A1 | CYP1A2 | Total resequenced area | |||
|---|---|---|---|---|---|
| “Gene” | Haploblock | “Gene” | Haploblock | ||
| No. of segregating sites | 21 | 46 | 28 | 54 | 102 |
| Length (bp) | 7,371 | 14,534 | 7,505 | 12,530 | 28,914 |
| π × 104 | 3.06 | 4.40 | 3.86 | 5.36 | 4.57 |
| θW × 104 | 5.44 | 6.04 | 7.13 | 8.23 | 6.74 |
| SD(θW) × 104 | 1.78 | 1.72 | 2.20 | 2.30 | 1.78 |
| Eta(s) | 8 | 18 | 14 | 19 | 38 |
| h | 16 | 29 | 22 | 29 | 48 |
| Hd | 0.820 | 0.889 | 0.844 | 0.86 | 0.957 |
| Number of diverging nucleotides over 101 sites | 5 | 8 | 1 | 11 | 19 |
| Nucleotide divergence K(JC) over 101 sites | 0.3878 | 0.2475 | 0.0981 | 0.2190 | 0.2274 |
These data were calculated using the software program DnaSP v5.00.07. Lengths of “genes” and haploblocks correspond to the resequenced base pairs and exclude masked areas, as described in Table 1. π = nucleotide diversity (driven mainly by intermediate-frequency alleles). θW = nucleotide diversity (driven mainly by low- and high-frequency alleles). SD = standard deviation. Eta(s) = number of singleton-segregating sites. h = number of inferred haplotypes. Hd = haplotype diversity. K(JC) = average number of nucleotide substitutions between human and ancestor (using the Jukes and Cantor correction).
Under mutation-drift equilibrium, the values of π and θW are equal; hence, their normalized difference is a measure of deviation from neutrality (Tajima's D). For the total resequenced area, our θW has a value of 6.74 × 10⁻⁴ (95% C.I = 3.26 × 10⁻⁴ to 10.2 × 10⁻⁴). This value of 6.74 × 10⁻⁴ conforms to the calculated average θW, 7.64 × 10⁻⁴, when we analyzed all SNPs found in ten 500-kb segments in 90 Africans, 89 Asians and 90 Caucasians—as genotyped by ENCODE 1 (http://www.hapmap.org/downloads/encode1.html.en#Reseq).
As seen in Table 3, an increase in number of haplotypes and their diversity is expected when whole haploblocks are used for the inference, because more SNPs are included in the analysis. Interestingly, this increase is not of the same magnitude for CYP1A1 as it is for CYP1A2. For CYP1A2, the number of haplotypes inferred does not increase in the same proportion (from 22 to 29) as it does for CYP1A1 (from 16 to 29); these data indicate stronger LD among the 54 SNPs of the CYP1A2 haploblock than among the 46 SNPs of the CYP1A1 haploblock.
Differences in LD strength between the haploblocks could be a result of differences in the abundance of high-MAF SNPs: in the CYP1A2 haploblock 53.7% of SNPs show a MAF ≥0.05, whereas this proportion is significantly lower (30.4%) in the CYP1A1 haploblock. Such differences in proportion could be an artifact—brought about by population substructure, explained below in our section on “Neutrality Testing”. Because there are larger interethnic differences for SNPs in the CYP1A1 haploblock, it is not surprising to find a more extreme inflation of SNPs having low MAFs in the CYP1A1 haploblock.
Nucleotide Diversity in World Populations
When world populations were analyzed individually for CYP1A1_CYP1A2 locus diversity (Fig. 4), θW tends to be higher than, or similar to, π; the exception is the Teribe, which shows the lowest genetic diversity θW among the eight populations studied. We also carried out calculations of the population-specific fixation index FIS (measure of departure from Hardy-Weinberg equilibrium). Not surprisingly, the only population showing significant values of FIS (0.5714) for the CYP1A1 and CYP1A2 “genes” (p <10−6; 10,100 permutations) is the Teribe. This significant deficiency of observed heterozygotes is an indicator of inbreeding within a small population. The results of total genetic variability θW and population-specific FIS indicate loss of genetic variability in the Teribe—both in the numbers of segregating sites and in the expected heterozygosity for the “genes”. Our results are in agreement with a previous study, indicating low genetic diversity of Y-chromosome markers in the Teribe (Ruiz-Narvaez et al., 2005).
FIGURE 4.

Genetic diversity of the CYP1A1_CYP1A2 locus in the eight studied populations (code numbers #1 through #8) and in the pooled population (#9). Nucleotide diversity is expressed as π and θW. To the right of the symbols for π and θW for the pooled population (top graph) are shown the average genetic diversity for the eight populations. The average π and θW tend to be lower than π and θW, respectively, for the pooled population, but this decrease is more dramatic for θW than for π.
As expected for the oldest population, Africans show the highest genetic diversity θW and also the largest number of population-specific SNPs (Fig. 4), of which 16 are singletons. This accounts in part for the observed difference between θW and π in this population, i.e. singletons driving the value of θW upwards, while not affecting π. The situation is similar and perhaps more dramatic in Caucasians, who carry only six population-specific SNPs (all singletons). For Asians, three population-specific SNPs are also singletons. Caucasians and Asians demonstrate only a portion of the diversity seen in Africans (60.3% and 77.7%, respectively), but their variability at this locus is not a subset of that found in Africa, as determined by their population-specific SNPs. As expected from the New World populations, Oceanians and Amerindians have lower values of θW than Asians and also several population-specific SNPs (except for the Teribe). For the 102 SNPs examined, 59 (57.8%) are population-specific.
Divergence from the Ancestral State and Construction of Derived Allele Frequency Spectrum (AFS)
For assessing neutrality of the CYP1A1_CYP1A2 locus, several tests were applied. We analyzed the CYP1A1 and CYP1A2 haploblocks separately; also, for comparison, we considered whole haploblocks and the specific regions associated with either “gene”. To increase the power of testing, a definition of directional changes was needed; this was accomplished by defining the ancestral states at each segregating site—based mainly on the homologous sequence found in the chimpanzee outgroup. We were able to determine the ancestral state of 101 SNPs, the only exception being CYP1A2 −7447 (Supp. Table S4) which seems to carry an exclusively human sequence. For 21 segregating sites where the predominant allele in human differed from that in chimpanzee (indicating divergence at those sites between these two species), we confirmed the ancestral state using homologous sequences of the orangutan and/or gorilla (Supp. Table S6).
Nucleotide divergence [K(JC)] from the ancestral state for the polymorphic (segregating) sites (shown in Table 3) was computed from the average number of nucleotide substitutions per site between human and ancestor [using the Jukes & Cantor correction (Jukes and Cantor, 1969)]. For the entire resequenced area, where 101 sites were compared between human and ancestor, a value of 0.2274 indicates that, on average, 23% of the sites have diverged. Only the polymorphic sites in humans were used to measure nucleotide divergence. Therefore, our conclusion relates only to those sites in humans in which a mutation from the ancestral sequence occurred and became predominant without reaching fixation. A comparison between the CYP1A1 and CYP1A2 haploblocks determined that CYP1A1 shows a slightly larger divergence from the ancestral state. Within each block, divergence is concentrated in the CYP1A1 “gene”, which does not seem to be case for CYP1A2. These data suggest that, for the CYP1A1 “gene”, the process of fixation of divergent sites is not as complete as that for the CYP1A2 “gene”.
Derived (non-ancestral) allele frequencies were calculated for each segregating site and used to construct AFS for the CYP1A1 “gene” (21 SNPs; Fig. 5A) and haploblock (46 SNPs; Fig. 5B) and for the CYP1A2 “gene” (28 SNPs; Fig. 5C) and haploblock (54 SNPs; Fig. 5D). In Fig. 5, the number of copies of the derived alleles is indicated on the abscissa, whereas the ordinate denotes the percentage of SNPs having the given number of copies, as a function of the total SNPs detected for each region.
FIGURE 5.

Derived AFS for genes and haplotypes in 106 chromosomes from the pooled population. (A) CYP1A1 “gene” (21 SNPs); (B) CYP1A1 haploblock (46 SNPs); (C) CYP1A2 “gene” (28 SNPs); (D) CYP1A2 haploblock (54 SNPs). The actual percent SNPs found is denoted by red bars, the expected percentage of SNPs at neutral equilibrium is shown as a blue line, and the abscissa represents the number of copies found for each of the 101 SNPs. The expected number of SNPs present j times in the sample = 4Nμ/j, where N is the effective population size and μ is the mutation rate per sequence; 4Nμ was estimated from θW per sequence (Watterson, 1975).
Table 4 shows the number of derived alleles (observed vs expected) having low, intermediate and high frequencies for the CYP1A1 and CYP1A2 “genes” and haploblocks. In accordance with the Fay and Wu analysis (Fay and Wu, 2000) for comparing how the proportion of alleles might deviate from expectation, the relative abundance of each type of allele is also shown (Table 4). The expected proportion for low-, intermediate-, high-frequency alleles is 26.9 : 20.2 : 1.0. The observed proportions for “genes” and haploblocks all deviate from the expected proportion; however, in some cases the departures are more striking. For the CYP1A1 “gene”, there is a large increase in the proportion of high-frequency alleles, resulting in decreases in the proportion of low-and intermediate-frequency alleles (11- and 25-fold less than expected, respectively). The CYP1A1 haploblock also shows a similar, but not as strong, trend—with the low-and intermediate-frequency alleles less than expected (4.6- and 8.4-fold, respectively).
TABLE 4.
Frequencies of Derived Alleles of CYP1A1 and CYP1A2 SNPs*
| Derived Allele Frequency | Relative Abundance | |||||
|---|---|---|---|---|---|---|
| Low (0<q≤0.1) 1<copies≤10 | Intermediate (0.1<q<0.90) 11<copies<95 | High (0.90<q≤1.0) 96<copies≤106 | Low : Intermediate : High | |||
| CYP1A1 | ||||||
| “Gene” | ||||||
| Observed | 12 | 4 | 5 | 2.4 : 0.8 : 1.0 | ||
| Expected | 11.73 | 8.84 | 0.44 | 26.9 : 20.2 : 1.0 | ||
| Haploblock | ||||||
| Observed | 29 | 12 | 5 | 5.8 : 2.4 : 1.0 | ||
| Expected | 25.69 | 19.36 | 0.96 | 26.9 : 20.2 : 1.0 | ||
| CYP1A2 | ||||||
| “Gene” | ||||||
| Observed | 20 | 7 | 1 | 20.0 : 7.0 : 1.0 | ||
| Expected | 15.63 | 11.78 | 0.58 | 26.9 : 20.2 : 1.0 | ||
| Haploblock | ||||||
| Observed | 35 | 12 | 7 | 5.0 : 1.7 : 1.0 | ||
| Expected | 30.15 | 22.72 | 1.12 | 26.9 : 20.2 : 1.0 | ||
“Derived allele frequency” denotes the number of copies. The term “q” refers to the relative allele frequency, whereas the number of copies corresponds to the absolute allele frequency. The basic unit for the relative abundance corresponds to the frequency of the high-frequency alleles. Low-, intermediate-, and high-frequency alleles are defined according to (Fay and Wu, 2000).
For the CYP1A2 “gene” (Table 4), the increase in high-frequency alleles is rather modest; consequently, there is a moderate decrease in the low- and intermediate-frequency alleles (1.3- and 3-fold less than expected, respectively). For the CYP1A2 haploblock, the situation is similar to the CYP1A1 haploblock: intermediate- and low-frequency alleles are reduced 5.3 and 12 times, respectively. In all cases in which a significant decrease is observed, the intermediate-frequency alleles suffer the greatest decrease, when compared with their expected frequencies.
The relative abundance analysis of low, intermediate and high frequencies of derived alleles—according to their locations in “genes” and haploblocks—is consistent with our divergence analysis, i.e. in the areas where divergence is greater, it is logical to see larger allele-frequency departures from neutral expectation. The SNPs that have diverged from the ancestral state are the ones showing strong directional changes: i.e. the frequency of the derived allele is higher than that of the ancestral allele. Therefore, diverging SNPs will show high frequencies for the derived allele and, consequently, the regions where those SNPs are found will have a greater proportion of high-frequency derived alleles and a smaller proportion of intermediate- and low-frequency alleles. Furthermore, the intermediate-frequency alleles will be especially decreased.
Neutrality Testing
Evolution of the CYP1A1_CYP1A2 locus is reflected in its genetic variation. As members of genes encoding xenobiotic-metabolizing enzymes, in particular, the role of natural selection on genetic diversity at this locus is of particular interest. However, deviations from neutrality can occur under different regimens of selection (e.g. over-dominance or balancing selection, background selection, hitchhiking events, or selective sweep) or be the consequence of confounding effects of demographic history of populations (e.g. population shrinkage or genetic bottleneck, population growth, substructure or subdivision, migration and/or population admixture). Therefore, we employed a series of neutrality tests and evaluated the results in terms of significance and relevance.
Tajima's D statistics [normalized difference between the observed vs the expected nucleotide diversity (heterozygosity) of each region; i.e. π vs θW] was used for testing the CYP1A1 and CYP1A2 “genes” and haploblocks (Table 5). As noted earlier, there is a reduced diversity (π is smaller than θW) in most populations studied for the entire CYP1A1_CYP1A2 locus (102 segregating sites). The D statistics is more negative for the CYP1A2 than for the CYP1A1 haploblock, even though D does not reach a 5% significance level in any of these blocks (p = 0.1214 and p = 0.2059, respectively). When the analysis is focused on individual gene regions within their respective haploblocks, the value of Tajima's D decreases almost to significance for the CYP1A2 “gene” (p = 0.0593) and also becomes more decreased for the CYP1A1 “gene” (p = 0.0852).
TABLE 5.
Neutrality Testing for CYP1A1 and CYP1A2 “Genes” and Haploblocks
| CYP1A1 |
CYP1A2 |
|||
|---|---|---|---|---|
| “Gene” Haploblock | “Gene” | Haploblock | ||
| Tajima's D | −1.268 | −0.855 | −1.376 | −1.106 |
| p-value | 0.085 | 0.206 | 0.059 | 0.121 |
| Fu & Li's D | −1.831 | −2.420 | −3.264 | −2.090 |
| p-value | 0.046* | 0.025* | 0.004** | 0.035* |
| Fu & Li's F | −1.940 | −2.121 | −3.019 | −2.013 |
| p-value | 0.042* | 0.032* | 0.005** | 0.035* |
| Fay & Wu's H | −8.332 | −6.797 | 0.591 | −7.132 |
| p-value | 0.005** | 0.067 | 0.474 | 0.069 |
Significant at the 5% level.
Significant at the 1% level. Neutrality testing was performed by applying the software program DnaSP v5.00.07 to the data. Probabilities (p-values) were calculated from 10,000 simulations, given θw, under the Coalescent model.
The derived AFS (Fig. 5) shows an excess of very high- and very low-frequency alleles, especially singletons, for the CYP1A2 haploblock and “gene”. Simultaneously, the count of intermediate-frequency alleles is reduced. This might explain the larger difference between π (impacted by intermediate-frequency alleles) and θW (driven by high- and low-frequency alleles, especially singletons) found in the CYP1A2 haploblock and concentrated in the area containing the “gene”. For CYP1A1, the AFS pattern is different: even though there also are more singletons than expected, there also are more alleles with frequencies close to 0.50, especially within the haploblock. This explains why the difference between π and θW is not so large or significant. When the CYP1A1 “gene” is analyzed, a decrease in the number of intermediate-frequency alleles explains the decrease in heterozygosity and, hence, a larger difference between π and θW.
A negative and significant Tajima's D value indicates a significant loss of genetic diversity, which could be caused by background selection, selective sweep, or population expansion. Because we examined both haploblocks and “genes” in the same individuals, the effect of a possible population expansion event should impact CYP1A1 and CYP1A2 equally and would not account for differences found between the two haploblocks. The effect of subdivision in the pooled population, however, could be strong enough to drive Tajima's D toward a spurious significance. Studies demonstrate that the artificial amalgamation of different populations into a single one could create artifacts impacting the interpretation of test results (Chakraborty et al., 1988). For our data, we compared the values of π and θW in the pooled population (4.41 × 10⁻⁴ and 6.74 × 10⁻⁴, respectively) vs the average of the eight studied populations (3.53 × 10⁻⁴ and 4.21 × 10⁻⁴, respectively). Measurements of nucleotide diversity are consistently higher in the pooled population than in the average of the populations, whereas average heterozygosity (π) is less affected (24.8% higher in pooled population) than θW (60.2% higher in pooled population).
Substructure causes deviation of AFS from its neutral expectation by inflating the number of copies counted, especially for low-frequency alleles (singletons) and population-specific alleles (Chakraborty et al., 1988). Since these types of alleles have a more dramatic effect on θW than π, it is expected that average heterozygosity will suffer only a modest inflation. The effect of substructure is proportional to the differences in allele frequencies among the populations being pooled in the total sample. We calculated global FST for the CYP1A1 and CYP1A2 haploblocks and “genes”; this fixation index (FST) indicates the proportion of the observed variability that can be ascribed to inter-population differences. CYP1A1 shows higher global FST values than CYP1A2 (26.8% vs 13.5% for haploblocks and 25.9% vs 21.6% for “genes”, respectively); therefore, our expectation would be for CYP1A1 to show a larger inflation of singletons, a larger difference between θW and π, and a more negative and closer-to-significance value for Tajima's D. This is not the case, because D is more significant for CYP1A2. We conclude that the detected decrease in nucleotide diversity in CYP1A2 cannot be completely explained by substructure—when we combine data from these diverse populations.
Evidence for Hitchhiking in Both the CYP1A1 and CYP1A2 Haploblocks
It is difficult to reject the null hypothesis of neutral evolution when Tajima's D test is applied to DNA polymorphism data (Nei and Kumar, 2000). Therefore, we applied other tests known for their increased power, all of which incorporate an outgroup containing the ancestral sequences, to determine the direction (ancestral vs derived alleles) and the magnitude of changes (derived allele frequencies). Fu and Li's D and F tests (Fu and Li, 1993) are especially sensitive to excessive numbers of singletons, associated with background selection, whereas Fay and Wu's H test compares the frequency of high- vs. intermediate-frequency derived alleles to detect hitchhiking events (selective sweep). Results of these tests (Table 5) indicate significant departure from neutrality for the CYP1A2 “gene”, due to an excess of singletons (Fu and Li's D and F), whereas a strong departure is found for the CYP1A1 “gene” by Fay and Wu's H test. The results of Fay and Wu's H test are consistent with the distribution of low-, intermediate- and high-frequency alleles in the CYP1A1 “gene” (2.4 : 0.8 : 1.0). A selective sweep is characterized by a dramatic increase in the observed high-frequency alleles and a decrease in the intermediate ones (Table 4), when compared to the expectations under a neutral model (26.9 : 20.2 : 1.0).
The results of Fay and Wu's H test are more reliable than those of Fu and Li's D and F tests, because the former depends on the differences between intermediate- and high-frequency alleles. Our analysis on the pooled population of 53 individuals from eight different world populations points to a larger excess of singletons in CYP1A2, when we would expect a larger inflation in CYP1A1—due to the higher values of FST for CYP1A1 than the CYP1A2 “gene”. Thus, although in the presence of population substructure the number of singletons is inflated and skews the results of the Fu and Li's D and F tests, our observed deviations from neutrality cannot be fully explained by population substructure alone.
We also carried out sweeping-window calculations (Fig. 6) for all the above-mentioned tests. This approach has the advantage of calculating the test statistics over all regions of interest—in increments of one SNP at a time, with a window width of 20 SNPs. A sweeping window delineates the regions within the haploblocks where there are strong departures from neutrality. Our analysis, applying Fay & Wu's H test, revealed a hitchhiking event in the CYP1A1 “gene”. Interestingly, the SNPs involved in the selective sweep are not in the translated region, but rather are located in the 3'-UTR (CYP1A1 +3322, +3232, +2968, and +2952), plus one SNP (CYP1A1 +4228) beyond the last exon.
FIGURE 6.

Neutrality test (by sliding windows) for the CYP1A1 and CYP1A2 haploblocks. Each panel shows results of a different neutrality test: (A) Tajima's D test; (B) Fu & Li's D test; (C) Fay & Wu's H test; (D) Fu & Li's F test. The size of the sliding window was 20 SNPs, with the window moving by increments of one SNP. For purposes of comparison, in the graph for each test we have combined the results of two independent tests: one for the CYP1A1 haploblock (46 SNPs; SNPs #1–46 from Supp. Table S1, solid line), the other for the CYP1A2 haploblock (54 SNPs; SNPs #49–102 from Supp. Table S1, dashed). Abscissa denotes the nucleotide position corresponding to the midpoint SNP of each window, and the positions of the two “genes” are also depicted.
The sweeping window (Fay & Wu's H test) for the CYP1A2 haploblock points to an area of possible selective sweep located in the 5'-promoter region, close to the putative recombination hotspot. When this test was applied to the CYP1A2 “gene” (28 SNPs), however, there was no indication of a hitchhiking event (Table 5), but there was increased significance in the H statistics when the whole haploblock was analyzed (54 SNPs). This, combined with the suggestion of the sweeping-window approach, indicates a possible selective sweep in the CYP1A2 haploblock centered in the promoter region of the gene (26 SNPs). We analyzed this segment (which does not contain the transcribed region) and found that the relative abundance of low-, intermediate- and high-frequency alleles was 2.5 : 0.82 : 1.0. These data clearly indicate a dramatic increase in the high-frequency alleles, at the expense of intermediate- and low-frequency alleles, when compared to expectations under a neutral model (26.9 : 20.2 : 1.0). Significant Fay & Wu's H statistics for this region (H = −7.7233, p = 0.0213) confirms the suggestion of a hitchhiking event. The SNPs involved in the event are CYP1A2 −9938, −9925, −9633 and −9589. Moreover, this set is in complete LD with one SNP at −7091 and two others located closer to the transcribed region, which also show divergence from the ancestral state (CYP1A2 −1708 and −739; the latter located in intron 1).
Effect of SNPs on Potential miR-Binding Sites of the CYP1A1 3'-UTR
Analysis of genetic variation revealed a region of the CYP1A1_CYP1A2 locus having decreased nucleotide diversity in the pooled populations, possibly due to a selective sweep. In this situation, one of the sites produces a mutation conferring a strong selective advantage, which drives the frequency of the derived allele (A1, or reference) towards higher levels. Other segregating sites showed the same rise in allele frequency, even though they are selectively neutral, because they are in complete LD with the advantageous site and apparently have profited by hitchhiking on its coattails. Most SNPs involved in this hitchhiking event are concentrated in the 3'-UTR of the CYP1A1 gene. A closer look at these hitchhiking sites shows African-specific polymorphisms that are not shared with other human groups. The ancestral allele (A2, or mutant) frequencies of these SNPs in Africans were determined—in a sample of 94 chromosomes—to be 0.10 to 0.12 (Jiang et al., 2005), whereas a sample of 83 Caucasian and 96 Asian chromosomes depicted monomorphism at these sites. These data indicate a fixation of the derived alleles in those populations that migrated out of Africa, whereas the fixation process was not yet complete in the population that stayed in Africa.
We felt that SNPs affected by the selective sweep and located in the CYP1A1 3'-UTR merited a closer look. Recent studies have highlighted the importance of 3'-UTR regions in gene regulation, especially by way of microRNA (miR) post-transcriptional-mediated interference or silencing of mRNA (Chua et al., 2009). We performed an in silico study of the potential miR-binding sites of the CYP1A1 3'-UTR, using the derived allele and the ancestral allele sequences involved in the selective sweep (CYP1A1 +3322, +3232, +2968 and +2952). For this study, we took into account the accessibility of the proposed binding sites, a favorable total free energy of miR-target hybridization, and the base-pairing of the target site to the 5' seed region of the miR. These parameters and others have been identified as factors affecting the prediction of potential binding sites, even though this is still an active research area and not all important binding characteristics are known and accounted for.
In a first step and in order to identify some potential miR-binding sites, we applied two web resources: mirBase Targets, which employs a database containing 706 human miRs, and microRNA, having its own mammalian database. These two search engines employ the miRanda algorithm (Enright et al., 2003; John et al., 2004) and search according to complementarity alignment of the target sequence to the miR sequence, with some attention paid to conservation across species. The mirBase Targets database identified seven possible miRs, whereas microRNA provided two additional miRs. Further analysis incorporated secondary-structure determinations (for accessibility) and calculations of free energies of nucleation and hybridization of possible target-binding sites—employing the web-based resource StarMir (Long et al., 2007). After eliminating sites at which total free energy was not favorable, we considered only those in which a reasonable binding to the 5' seed of the miR was achieved with minimum bulges and G-U wobbles.
After applying all the aforementioned filters to the analysis of the CYP1A1 3'-UTR for the derived vs the ancestral sequences, we identified two miRs that could potentially bind to both sequences: hsa-miR-125b-2* and hsa-miR-488*, with the ancestral sequences (A2) showing two potential binding sites for each miR, whereas the derived sequences (A1) contain one binding site per miR. There are additional miRs that present even more striking differences between both sequences: hsa-miR-892a has at least three strong binding sites for the A1 alleles and none for the A2 alleles, whereas hsa-miR-657 shows strong binding to at least three sites for the A2 alleles and none for the A1 alleles. Furthermore, hsa-miR-511 shows one binding site in the A1 alleles, while hsa-miR-626 exhibits one binding site in the A2 alleles.
This analysis was performed in the context of the 3'-UTR mRNA secondary structure, because we believe it is at this level that SNPs might primarily alter binding of miRs, even if SNPs do not change the consensus sequence of miR-binding sites. In other words, a SNP does not necessarily have to be located in the miR-binding site in order to affect secondary structure, thereby provoking significant changes in accessibility and thermodynamics of the heterohelix. For the SNPs of interest in this study, none was located within the putative miR-binding sites; nevertheless, we propose that differences between the ancestral (A2) and derived sequences (A1) are likely to alter the miR-binding properties.
CONCLUSIONS
Population genetics analyses of variation across the CYP1A1_CYP1A2 locus, which includes the two genes and its BDP, have provided clues about possible selection events that might have affected evolution of the locus in the Homo genus. Key to this analysis was the definition of haploblocks containing each “gene” and then comparison of variations found in the CYP1A1 and CYP1A2 haploblocks vs that found in the “genes”. In both haploblocks, we found indications of decreased genetic diversity.
Even though comparative genomics studies suggest that CYP1A1 (>450 MYA) is older than CYP1A2 (<420 MYA), with CYP1A2 emerging as the result of a duplication event, it is probably unlikely that nucleotide diversity studies in H. sapiens, which diverged from P. troglodytes 5–6 MYA, would capture differences between these two haploblocks in the genome. The products of both genes encode enzymes that metabolize foreign as well as endogenous substrates, and the enzymes likely have played a role in homeostasis of organisms interacting with their environment. Thus, we speculate that selective pressures have acted on their evolution. Selective forces, which have operated over several millions of years, would have completely obscured or skewed any age difference between the two “genes”/haploblocks.
We therefore analyzed samples pooled from eight different populations (equivalent to recent population amalgamation)—which inflated the frequency of alleles found at low frequencies, especially singletons. This analysis would obscure the significance of neutrality tests based on an excess of singletons, as an indicator of possible background selection. More useful to our analysis was Fay and Wu's H test, which incorporated an outgroup (chimpanzee, orangutan and/or gorilla) to account for directional changes, or divergence in allele frequencies, and which relied not on low-frequency alleles but rather on comparisons between intermediate- and high-frequency alleles. Fay and Wu's H test pointed toward positive-selective sweep events, which might have happened in regions of both haploblocks, but especially in the CYP1A1 “gene”. This hitchhiking event in CYP1A1 is centered on a group of SNPs in complete LD, located in the 3'-UTR of this gene. The time-frame for this selective sweep is estimated to be close to 6 MYA, corresponding to the approximate time that the Homo genus diverged from P. troglodytes.
Until recently, significance of the 3'-UTR in gene regulation has not been fully appreciated, when compared with all the attention given to the promoter and enhancer regions of protein-coding genes. However, recent human expression-QTL studies have identified strong signals not only around the TSS but also in a region 250 bp upstream of the transcription-termination site (Veyrieras et al., 2008). This 3'-UTR is where binding sites for non-coding RNAs, especially miRs, are abundant. More than 60% of human protein-coding genes appear to be under selective pressure to maintain miR targets (Friedman et al., 2009). The miRs pair up with these targets, to direct posttranscriptional repression of protein-coding genes and, in addition, they appear to play an important role in evolution of their 3'-UTR (Zhang and Su, 2009).
Although differences in individual SNPs across the 3'-UTR could be associated with disruptions in miR-binding, a functional analysis in a cell-expression system will be required to determine whether the pattern of SNPs, found to be in high LD in the present study, might be associated with changes in CYP1A1 gene regulation. Because the ancestral pattern appears to be disappearing in humans except those in Africa, we speculate that these SNPs—either individually or collectively—might be associated with down-regulation of CYP1A1 gene expression.
Supplementary Material
ACKNOWLEDGMENTS
We thank our colleagues for discussions and careful readings of this manuscript. We are grateful to Dr. Lei He for help in using MAPPER for identification of TFBS and to Dr. Marina Galvez for help with graphics. These studies were supported, in part, by NIH Grants R01 DE016325 (D.W.N.) and P30 ES06096 (R.C., R.D. & D.W.N.).
Footnotes
For convenience, from here onward, we define “gene” as that region from the TSS through the last exon, plus an additional 1495 bp 3'-ward of the CYP1A1 last exon and 1047 bp 3'-ward of the CYP1A2 last exon. These “gene” regions are contained within haploblocks; therefore, the 21 SNPs found in the CYP1A1 “gene” are a subset of the 46 CYP1A1 haploblock SNPs and the 28 SNPs found in the CYP1A2 “gene” are a subset of the 54 CYP1A2 haploblock SNPs.
Supporting Information for this preprint is available from the Human Mutation editorial office upon request (humu@wiley.com)
REFERENCES
- Arnheim N, Calabrese P, Tiemann-Boege I. Mammalian meiotic recombination hot spots. Annu Rev Genet. 2007;41:369–399. doi: 10.1146/annurev.genet.41.110306.130301. [DOI] [PubMed] [Google Scholar]
- Barrett JC, Fry B, Maller J, Daly MJ. Haploview: analysis and visualization of LD and haplotype maps. Bioinformatics. 2005;21:263–265. doi: 10.1093/bioinformatics/bth457. [DOI] [PubMed] [Google Scholar]
- Behar DM, Villems R, Soodyall H, Blue-Smith J, Pereira L, Metspalu E, Scozzari R, Makkan H, Tzur S, Comas D, Bertranpetit J, Quintana-Murci L, Tyler-Smith C, Wells RS, Rosset S. The dawn of human matrilineal diversity. Am J Hum Genet. 2008;82:1130–1140. doi: 10.1016/j.ajhg.2008.04.002. [DOI] [PMC free article] [PubMed] [Google Scholar]
- Betel D, Wilson M, Gabow A, Marks DS, Sander C. The microRNA.org resource: targets and expression. Nucleic Acids Res. 2008;36:D149–D153. doi: 10.1093/nar/gkm995. [DOI] [PMC free article] [PubMed] [Google Scholar]
- Boutros PC, Moffat ID, Franc MA, Tijet N, Tuomisto J, Pohjanvirta R, Okey AB. Dioxin-responsive AHRE-II gene battery: identification by phylogenetic footprinting. Biochem Biophys Res Commun. 2004;321:707–715. doi: 10.1016/j.bbrc.2004.06.177. [DOI] [PubMed] [Google Scholar]
- Chakraborty R, Smouse PE, Neel JV. Population amalgamation and genetic variation: observations on artificially agglomerated tribal populations of Central and South America. Am J Hum Genet. 1988;43:709–725. [PMC free article] [PubMed] [Google Scholar]
- Chakraborty R, Weiss KM. Admixture as a tool for finding linked genes and detecting that difference from allelic association between loci. Proc Natl Acad Sci U S A. 1988;85:9119–9123. doi: 10.1073/pnas.85.23.9119. [DOI] [PMC free article] [PubMed] [Google Scholar]
- Chua JH, Armugam A, Jeyaseelan K. MicroRNAs: biogenesis, function and applications. Curr Opin Mol Ther. 2009;11:189–199. [PubMed] [Google Scholar]
- Conrad DF, Jakobsson M, Coop G, Wen X, Wall JD, Rosenberg NA, Pritchard JK. A worldwide survey of haplotype variation and linkage disequilibrium in the human genome. Nat Genet. 2006;38:1251–1260. doi: 10.1038/ng1911. [DOI] [PubMed] [Google Scholar]
- Corchero J, Pimprale S, Kimura S, Gonzalez FJ. Organization of the CYP1A cluster on human chromosome 15: implications for gene regulation. Pharmacogenetics. 2001;11:1–6. doi: 10.1097/00008571-200102000-00001. [DOI] [PubMed] [Google Scholar]
- de Bakker PI, Burtt NP, Graham RR, Guiducci C, Yelensky R, Drake JA, Bersaglieri T, Penney KL, Butler J, Young S, Onofrio RC, Lyon HN, Stram DO, Haiman CA, Freedman ML, Zhu X, Cooper R, Groop L, Kolonel LN, Henderson BE, Daly MJ, Hirschhorn JN, Altshuler D. Transferability of tag SNPs in genetic association studies in multiple populations. Nat Genet. 2006;38:1298–1303. doi: 10.1038/ng1899. [DOI] [PubMed] [Google Scholar]
- Enright AJ, John B, Gaul U, Tuschl T, Sander C, Marks DS. MicroRNA targets in Drosophila. Genome Biol. 2003;5:R1. doi: 10.1186/gb-2003-5-1-r1. [DOI] [PMC free article] [PubMed] [Google Scholar]
- Fay JC, Wu CI. Hitchhiking under positive Darwinian selection. Genetics. 2000;155:1405–1413. doi: 10.1093/genetics/155.3.1405. [DOI] [PMC free article] [PubMed] [Google Scholar]
- Friedlaender JS, Friedlaender FR, Reed FA, Kidd KK, Kidd JR, Chambers GK, Lea RA, Loo JH, Koki G, Hodgson JA, Merriwether DA, Weber JL. The genetic structure of Pacific Islanders. PLoS Genet. 2008;4:e19. doi: 10.1371/journal.pgen.0040019. [DOI] [PMC free article] [PubMed] [Google Scholar]
- Friedman RC, Farh KK, Burge CB, Bartel DP. Most mammalian mRNAs are conserved targets of microRNAs. Genome Res. 2009;19:92–105. doi: 10.1101/gr.082701.108. [DOI] [PMC free article] [PubMed] [Google Scholar]
- Fu YX, Li WH. Statistical tests of neutrality of mutations. Genetics. 1993;133:693–709. doi: 10.1093/genetics/133.3.693. [DOI] [PMC free article] [PubMed] [Google Scholar]
- Garrigan D, Kingan SB, Pilkington MM, Wilder JA, Cox MP, Soodyall H, Strassmann B, stro-Bisol G, de KP, Novelletto A, Friedlaender J, Hammer MF. Inferring human population sizes, divergence times and rates of gene flow from mitochondrial, X and Y chromosome resequencing data. Genetics. 2007;177:2195–2207. doi: 10.1534/genetics.107.077495. [DOI] [PMC free article] [PubMed] [Google Scholar]
- Goebel T, Waters MR, O'Rourke DH. The late Pleistocene dispersal of modern humans in the Americas. Science. 2008;319:1497–1502. doi: 10.1126/science.1153569. [DOI] [PubMed] [Google Scholar]
- Griffiths-Jones S, Grocock RJ, van DS, Bateman A, Enright AJ. miRBase: microRNA sequences, targets and gene nomenclature. Nucleic Acids Res. 2006;34:D140–D144. doi: 10.1093/nar/gkj112. [DOI] [PMC free article] [PubMed] [Google Scholar]
- Jaiswal AK, Gonzalez FJ, Nebert DW. Human P1-450 gene sequence and correlation of mRNA with genetic differences in benzo[a]pyrene metabolism. Nucleic Acids Res. 1985;13:4503–4520. doi: 10.1093/nar/13.12.4503. [DOI] [PMC free article] [PubMed] [Google Scholar]
- Jiang Z, Dalton TP, Jin L, Wang B, Tsuneoka Y, Shertzer HG, Deka R, Nebert DW. Toward the evaluation of function in genetic variability: characterizing human SNP frequencies and establishing BAC-transgenic mice carrying the human CYP1A1_CYP1A2 locus. Hum Mutat. 2005;25:196–206. doi: 10.1002/humu.20134. [DOI] [PubMed] [Google Scholar]
- John B, Enright AJ, Aravin A, Tuschl T, Sander C, Marks DS. Human MicroRNA targets. PLoS Biol. 2004;2:e363. doi: 10.1371/journal.pbio.0020363. erratum 2005; 3: e264. [DOI] [PMC free article] [PubMed] [Google Scholar]
- Jukes TH, Cantor CR. Evolution of protein molecules. In: Munro HN, editor. Mammalian Protein Metabolism. Academic Press; New York, NY: 1969. pp. 21–132. [Google Scholar]
- Kubota M, Sogawa K, Kaizu Y, Sawaya T, Watanabe J, Kawajiri K, Gotoh O, Fujii-Kuriyama Y. Xenobiotic responsive element in the 5'-upstream region of the human P-450c gene. J Biochem. 1991;110:232–236. doi: 10.1093/oxfordjournals.jbchem.a123562. [DOI] [PubMed] [Google Scholar]
- Li YY, Yu H, Guo ZM, Guo TQ, Tu K, Li YX. Systematic analysis of head-to-head gene organization: evolutionary conservation and potential biological relevance. PLoS Comput Biol. 2006;2:e74. doi: 10.1371/journal.pcbi.0020074. [DOI] [PMC free article] [PubMed] [Google Scholar]
- Long D, Lee R, Williams P, Chan CY, Ambros V, Ding Y. Potent effect of target structure on microRNA function. Nat Struct Mol Biol. 2007;14:287–294. doi: 10.1038/nsmb1226. [DOI] [PubMed] [Google Scholar]
- Marinescu VD, Kohane IS, Riva A. MAPPER: a search engine for the computational identification of putative transcription factor binding sites in multiple genomes. BMC Bioinformatics. 2005;6:79. doi: 10.1186/1471-2105-6-79. [DOI] [PMC free article] [PubMed] [Google Scholar]
- Nebert DW, Dalton TP. The role of cytochrome P450 enzymes in endogenous signalling pathways and environmental carcinogenesis. Nat Rev Cancer. 2006;6:947–960. doi: 10.1038/nrc2015. [DOI] [PubMed] [Google Scholar]
- Nebert DW, Dalton TP, Okey AB, Gonzalez FJ. Role of aryl hydrocarbon receptor-mediated induction of the CYP1 enzymes in environmental toxicity and cancer. J Biol Chem. 2004;279:23847–23850. doi: 10.1074/jbc.R400004200. [DOI] [PubMed] [Google Scholar]
- Nebert DW, Dieter MZ. The evolution of drug metabolism. Pharmacology. 2000;61:124–135. doi: 10.1159/000028393. [DOI] [PubMed] [Google Scholar]
- Nebert DW, Karp CL. Endogenous functions of the aryl hydrocarbon receptor (AHR): intersection of cytochrome P450 1 (CYP1)-metabolized eicosanoids and AHR biology. J Biol Chem. 2008;283:36061–36065. doi: 10.1074/jbc.R800053200. [DOI] [PMC free article] [PubMed] [Google Scholar]
- Nebert DW, Roe AL, Dieter MZ, Solis WA, Yang Y, Dalton TP. Role of the aromatic hydrocarbon receptor and [Ah] gene battery in the oxidative stress response, cell cycle control, and apoptosis. Biochem Pharmacol. 2000;59:65–85. doi: 10.1016/s0006-2952(99)00310-x. [DOI] [PubMed] [Google Scholar]
- Nei M, Kumar S. Molecular Evolution and Phylogenetics. Oxford University Press; Oxford: 2000. [Google Scholar]
- Nelson DR, Koymans L, Kamataki T, Stegeman JJ, Feyereisen R, Waxman DJ, Waterman MR, Gotoh O, Coon MJ, Estabrook RW, Gunsalus IC, Nebert DW. P450 superfamily: update on new sequences, gene mapping, accession numbers and nomenclature. Pharmacogenetics. 1996;6:1–42. doi: 10.1097/00008571-199602000-00002. [DOI] [PubMed] [Google Scholar]
- Nelson DR, Zeldin DC, Hoffman SM, Maltais LJ, Wain HM, Nebert DW. Comparison of cytochrome P450 (CYP) genes from the mouse and human genomes, including nomenclature recommendations for genes, pseudogenes and alternative-splice variants. Pharmacogenetics. 2004;14:1–18. doi: 10.1097/00008571-200401000-00001. [DOI] [PubMed] [Google Scholar]
- Nguyen LP, Bradfield CA. The search for endogenous activators of the aryl hydrocarbon receptor. Chem Res Toxicol. 2008;21:102–116. doi: 10.1021/tx7001965. [DOI] [PMC free article] [PubMed] [Google Scholar]
- Quattrochi LC, Tukey RH. The human cytochrome CYP1A2 gene contains regulatory elements responsive to 3-methylcholanthrene. Mol Pharmacol. 1989;36:66–71. [PubMed] [Google Scholar]
- Quattrochi LC, Vu T, Tukey RH. The human CYP1A2 gene and induction by 3-methylcholanthrene. A region of DNA that supports AH-receptor binding and promoter-specific induction. J Biol Chem. 1994;269:6949–6954. [PubMed] [Google Scholar]
- RayChaudhuri B, Nebert DW, Puga A. The murine Cyp1a1 gene negatively regulates its own transcription and that of other members of the aromatic hydrocarbon-responsive [Ah] gene battery. Mol Endocrinol. 1990;4:1773–1781. doi: 10.1210/mend-4-12-1773. [DOI] [PubMed] [Google Scholar]
- Rozas J, Sanchez-DelBarrio JC, Messeguer X, Rozas R. DnaSP, DNA polymorphism analyses by the coalescent and other methods. Bioinformatics. 2003;19:2496–2497. doi: 10.1093/bioinformatics/btg359. [DOI] [PubMed] [Google Scholar]
- Ruiz-Narvaez EA, Santos FR, Carvalho-Silva DR, Azofeifa J, Barrantes R, Pena SD. Genetic variation of the Y chromosome in Chibcha-speaking Amerindians of Costa Rica and Panama. Hum Biol. 2005;77:71–91. doi: 10.1353/hub.2005.0032. [DOI] [PubMed] [Google Scholar]
- Sansen S, Yano JK, Reynald RL, Schoch GA, Griffin KJ, Stout CD, Johnson EF. Adaptations for the oxidation of polycyclic aromatic hydrocarbons exhibited by the structure of human P450 1A2. J Biol Chem. 2007;282:14348–14355. doi: 10.1074/jbc.M611692200. [DOI] [PubMed] [Google Scholar]
- Schneider S, Roessli D, Excoffier L. Arlequin: A software for population genetics data analysis. Ver 2.000 Genetics and Biometry Lab, Dept. of Anthropology, University of Geneva; 2000. [Google Scholar]
- Stephens M, Scheet P. Accounting for decay of linkage disequilibrium in haplotype inference and missing-data imputation. Am J Hum Genet. 2005;76:449–462. doi: 10.1086/428594. [DOI] [PMC free article] [PubMed] [Google Scholar]
- Stephens M, Smith NJ, Donnelly P. A new statistical method for haplotype reconstruction from population data. Am J Hum Genet. 2001;68:978–989. doi: 10.1086/319501. [DOI] [PMC free article] [PubMed] [Google Scholar]
- The ENCODE Project Consortium Identification and analysis of functional elements in 1% of the human genome by the ENCODE pilot project. Nature. 2007;447:799–816. doi: 10.1038/nature05874. [DOI] [PMC free article] [PubMed] [Google Scholar]
- Ueda R, Iketaki H, Nagata K, Kimura S, Gonzalez FJ, Kusano K, Yoshimura T, Yamazoe Y. A common regulatory region functions bidirectionally in transcriptional activation of the human CYP1A1 and CYP1A2 genes. Mol Pharmacol. 2006;69:1924–1930. doi: 10.1124/mol.105.021220. [DOI] [PubMed] [Google Scholar]
- Veyrieras JB, Kudaravalli S, Kim SY, Dermitzakis ET, Gilad Y, Stephens M, Pritchard JK. High-resolution mapping of expression-QTLs yields insight into human gene regulation. PLoS Genet. 2008;4:e1000214. doi: 10.1371/journal.pgen.1000214. [DOI] [PMC free article] [PubMed] [Google Scholar]
- Volodko NV, Starikovskaya EB, Mazunin IO, Eltsov NP, Naidenko PV, Wallace DC, Sukernik RI. Mitochondrial genome diversity in arctic Siberians, with particular reference to the evolutionary history of Beringia and Pleistocenic peopling of the Americas. Am J Hum Genet. 2008;82:1084–1100. doi: 10.1016/j.ajhg.2008.03.019. [DOI] [PMC free article] [PubMed] [Google Scholar]
- Watterson GA. On the number of segregating sites in genetical models without recombination. Theor Popul Biol. 1975;7:256–276. doi: 10.1016/0040-5809(75)90020-9. [DOI] [PubMed] [Google Scholar]
- Xie X, Mikkelsen TS, Gnirke A, Lindblad-Toh K, Kellis M, Lander ES. Systematic discovery of regulatory motifs in conserved regions of the human genome, including thousands of CTCF insulator sites. Proc Natl Acad Sci U S A. 2007;104:7145–7150. doi: 10.1073/pnas.0701811104. [DOI] [PMC free article] [PubMed] [Google Scholar]
- Yang MQ, Elnitski LL. Diversity of core promoter elements comprising human bidirectional promoters. BMC Genomics. 2008;9(Suppl 2):S3. doi: 10.1186/1471-2164-9-S2-S3. [DOI] [PMC free article] [PubMed] [Google Scholar]
- Zhang R, Su B. Small but influential: the role of microRNAs on gene regulatory network and 3'-UTR evolution. J Genet Genomics. 2009;36:1–6. doi: 10.1016/S1673-8527(09)60001-1. [DOI] [PubMed] [Google Scholar]
Associated Data
This section collects any data citations, data availability statements, or supplementary materials included in this article.