

Abstract
The Phenomenex EZ:faast™ amino acid analysis kit is available for gas (GC) or liquid (LC) chromatographic analysis of amino acids (AA) using mass spectrometry (MS) and other GC detectors. We used it for rapid GC determination of plasma tryptophan, its brain uptake competitors (Val, Leu, Ile, Phe and Tyr) and many other amino acids. Based on solid-phase extraction, this fast method enables one person to process two plasma samples in 8–10 min and six samples in ∼15 min up to GC injection and a 7-min GC run per plasma sample. Using a Perkin-Elmer Clarus 500 GC, a Total Chrome software, a flame-ionisation detector (FID) and norvaline as internal standard, we used this method to analyse ∼1,000 plasma samples from normal subjects undergoing acute tryptophan depletion and loading tests. The limit of detection for most amino acids is 1 nmol/ml (1 μM) and in many cases less. With manual injection, coefficients of variation for the above six amino acids were 1.5–6.2% (intra-assay) and 3.8–9.7% (inter-assay). This simple, rapid and elegant method will be valuable to the amino acid analyst and researcher, as it can save much manpower time and meet urgent emergency requests and the demands of a high-throughput laboratory.
Keywords: Analysis, EZ:faast, Gas chromatography, Isoleucine, Leucine, Phenylalanine, Tryptophan, Tyrosine, Valine
Introduction
Amino acid (AA) analysis in biological fluids is an important laboratory test in the diagnosis of inherited disorders of AA metabolism, the monitoring of bone and muscle disorders and of patients requiring long-term nutritional support, evaluation of new baby milks and parenteral and enteral feeds, and detection of renal drug toxicity (for a review, see Walker and Mills 1995). In psychopharmacological research and practice, the monitoring of tryptophan, and other aromatic and branched-chain AA (BCAA) under basal conditions and following the acute tryptophan depletion (or loading) test (Young et al. 1985; Reilly et al. 1997) is a vital research and diagnostic tool for assessing the role of the brain indolylamine 5-hydroxytryptamine (5-HT or serotonin) in mood and other behavioural disorders. Walker and Mills (1995) examined many of the problems encountered with the various AA analytical procedures. One such problem is the relatively long time required for sample preparation and analysis. Sample preparation requires protein precipitation, removal of interfering substances and derivatisation, all of which combine to cause a significant time delay before analysis. Furthermore, analysis time with the commonly used existing techniques varies between 2 and 4 h with cation-exchange-based dedicated AA auto-analysers and up to 1 h with high-performance liquid chromatography (HPLC; Walker and Mills 1995). Even with the faster mass spectrometry (MS), time (up to 40 min) has still to be spent on deproteinisation of samples.
A method that considerably overcomes the above time delays is the use of the Phenomenex EZ:faast™ family of amino acid analysis kits (Phenomenex EZ:faast [easy fast] amino acid sample testing kit 2003), which utilise gas chromatography (GC) with flame ionisation (FID), nitrogen-phosphorus (NPD) or mass spectrometric (GC-MS) detection or liquid chromatography (LC-MS). The kit for LC-MS can measure at least 50 amino acids and their derivatives, including the various sulphur and urea cycle AA, whereas the GC kits do not measure arginine, cysteine, citrulline, 1- and 3-methylhistidines and taurine. Faced with the need to analyse a large number of plasma samples obtained from subjects undergoing acute tryptophan depletion and loading tests, we successfully applied the above kit for analysis of the relevant plasma AA using GC-FID. Based on solid-phase extraction (SPE), this simple, elegant and thus far the most rapid method will be invaluable to AA analysts and researchers and will meet emergency requirements and the needs of high throughput clinical laboratories. A brief account of a part of this work has appeared in the abstract form (Badawy et al. 2005) and experimental data concerning the specificity of the acute Trp depletion and loading tests using this method are already in press (Badawy et al. 2007).
Materials and methods
Amino acids and other chemicals
Amino acids were purchased from the Sigma-Aldrich Co. Ltd. (Fancy Road, Poole, Dorset, BH12 4QH, UK), whereas all other laboratory reagents were from VWR International Ltd. (Hunter Boulevard, Magna Park, Leicestershire LE17 4XN, UK) and were of the purest commercially available grades. For HPLC experiments, the relevant (HPLC) grade chemicals were used when commercially available.
Kit components and other material
These are listed in Table 1. Other materials required, but not supplied in the kit, were: (1) 100 μL–1 mL pipette; (2) 30–300 μL pipette; (3) pipette tips; (4) vortex; (5) vials of appropriate volumes with caps; (6) Pasteur pipettes for sample transfer; (7) container for proper waste disposal; (8) septa.
Table 1.
Components of the EZ:faast™ GC-FID amino acid analysis kit
| Components | Name/detail | Capacity/number |
|---|---|---|
| A: Reagents | ||
| Reagent 1 | Internal standard solution | 50 mL |
| Reagent 2 | Washing solution | 90 mL |
| Reagent 3A | Elution medium component 1 | 60 mL |
| Reagent 3B | Elution medium component 2 | 40 mL |
| Reagent 4 | Organic solution I | Four vials, 6 mL@ |
| Reagent 5 | Organic solution II | 50 mL |
| Reagent 6 | Acid solution | 50 mL |
| Standards 1, 2 and 3 | Amino acid standard mixture | Two vials of each Standard, 2 mL@ |
| B: Supplies | ||
| Sorbent tips in racks | 4 × 96 | |
| Sample preparation vials | 4 × 100 | |
| Vial rack | 1 | |
| Microdispenser, 20–100 μL | 1 | |
| Syringes, 0.6 mL and 1.5 mL | 10 of each | |
| ZB-AAA GC column (10 m × 0.25 mm) | 1 | |
| EZ:faast™ demo video and reference CD | 1 | |
| User manual | 1 | |
| Focus liners™ | 5 | |
Reagents 2, 3A, 5 and 6 should be stored at room temperature, whereas reagents 1, 3B and 4 should be stored at 4°C. The 3 Phenomenex standards should all be stored in a freezer. If stored under these conditions, all these reagents would have a shelf life of 1 year.
The Phenomenex standards 1, 2 and 3
Standards 1 and 2 are mixtures of most amino acids occurring in plasma and were used throughout this work, whereas Standard 3 was not used, as it contains the six urine-specific components: α-aminopimelic acid, cystathionine, glycine-proline dipeptide, hydroxylysine, proline-hydroxyproline dipeptide and thioproline. Standard 2 contains only the 3 amino acids, which are unstable in acid solution, namely asparagine, glutamine and tryptophan, whereas Standard 1 contains 23 other amino acids.
Preparation of the elution medium
The elution medium (200 μL per sample) should be prepared freshly on the day of the experiment, in economical amounts, depending on the total number of samples to be analysed, by mixing three parts of Reagent 3A with two parts of Reagent 3B in a capped vial of appropriate size. The prepared mixture should be stored at room temperature and any unused amount discarded by the end of the experiment.
General procedure
Pipette 100 μL of the sample (serum, plasma or other) and 100 μL of Reagent 1 [the norvaline internal standard (NVIS)] into each sample preparation vial.
Attach a sorbent tip to a 1.5 mL syringe and loosen the syringe piston, then immerse the tip and let the solution in the sample preparation vial pass through the sorbent tip by slowly pulling back the syringe piston in small steps (∼1 min).
Pipette 200 μL of Reagent 2 (wash solution) into the same sample preparation vial and pass this solution slowly through the sorbent tip and into the syringe barrel. Drain the liquid from the sorbent bed by pulling air through the sorbent tip, then detach the latter and leave it in the sample preparation vial, discarding the liquid accumulated in the syringe.
Pipette 200 μL of the freshly prepared elution medium in the same sample preparation vial.
Pull back the piston of a 0.6 mL syringe halfway up the barrel and attach the sorbent tip used in steps 2–4. Wet the sorbent with the eluting medium; watch as the liquid rises through the sorbent particles and stop when the liquid reaches the filter plug in the sorbent tip.
Eject the liquid and sorbent particles out of the tip and into the sample preparation vial. Repeat steps 5 and 6 until the sorbent particles in the tip are expelled into the sample preparation vial. Only the filter disc should remain in the empty tip.
Using the adjustable Drummond Dialamatic Microdispenser provided (The Drummond Scientific Co., Broomall, PA 19008, USA), transfer 50 μL of Reagent 4 (organic solution 1) into the sample preparation vial, ensuring that the tip of the microdispenser does not touch the inner wall of the vial.
Emulsify the liquid in the vial by repeated vortexing for ∼5–8 s, holding the vial straight and firmly between fingers. Allow the reaction to proceed for at least 1 min. The emulsion will gradually separate into two layers.
Re-emulsify the liquids in the vial by vortexing again for 5 s and allow the reaction to proceed for another minute.
Transfer with the microdispenser 100 μL of Reagent 5 (50 μL twice, for convenience) and mix for 5 s. Allow the reaction to proceed for 1 more minute.
Pipette 100 μL of Reagent 6 (not with the microdispenser) and vortex for ∼5 s, then allow the emulsion to separate into two layers. The upper layer contains the derivatised AA to be analysed by GC. Transfer part of this upper layer using a Pasteur pipette into an autosampler (or other) vial for GC injection.
For standards for plasma AA, follow the whole procedure using 100 μL each of standard 1 and standard 2 (or your own standard) and 100 μL of the NVIS. Each AA in all these standards is present at a 200 μM concentration.
GC conditions
We used a Clarus 500 GC (Perkin-Elmer) with a flame-ionisation detector (FID) and manual injection (1 μL) using a 1 μL SGE syringe (SGE Europe Ltd., UK:http://www.uk@sge.com). The column was a Zebron ZB-AAA 10 m × 0.25 mm capillary GC column. The column oven temperature programme was: 32°C per min from 110 to 320°C. The FID detector temperature was 320°C and 1 μL was injected at an injection temperature of 250°C and a split level of 1:2. The carrier gas was H2 at a pressure of 8 psi (a flow rate of 1 mL/min). The flow rate, pressure setting and split ratios will need adjusting, depending on GC instrument specifications, the carrier gas chosen and other practical considerations.
Other analytical procedures
For total (free + albumin-bound) Trp analysis, we compared this GC method with two other methods, namely the standard fluorimetric method of Denckla and Dewey (1967), as modified by Bloxam and Warren (1974) and detailed previously (Badawy and Evans 1976), and another newly developed HPLC method for the separation and quantification of Trp and its kynurenine metabolites, details of which will be published elsewhere (Badawy et al., in preparation). Briefly, we used a Perkin-Elmer LC200 quaternary system run isocratically using a reverse-phase column (Synergi 4 μ Fusion-RP80A, 250 × 4.6 mm) plus guard column from Phenomenex Ltd., a mobile phase mixture of methanol and sodium dihydrogen phosphate buffer (27:73, by volume), final pH 2.8, at a flow rate of 1.2 ml/min at 37°C, and a uv/vis detector (220 nm). The same Total Chrome software used in the GC method also controlled the data handling and processing. As the fluorimetric and HPLC methods involve initial acid precipitation of proteins, the Trp measured is the total Trp. The small (5–10%) fraction of circulating Trp in the free (non-albumin-bound) state was determined separately by the above fluorimetric method in plasma ultrafiltrates, as described previously (Badawy et al. 2005).
AA recovery from plasma
Although the need for assessing recovery of AA during the solid-phase extraction and derivatisation procedure is rendered unnecessary by the use of the internal standard, recovery of some amino acids of interest from plasma samples was tested. Four different plasma samples were spiked with three concentrations (50, 200 and 400 μM) of the three AA of interest, namely Val, Leu and Ile. The lowest concentration is equal to or less than the physiological lower value, whereas the highest can be attained and/or exceeded during the acute Trp depletion or loading tests. The values obtained from each control (unspiked) plasma sample were subtracted from those observed with the corresponding spiked plasma and recorded as a percentage of the corresponding standard concentration of each AA calibrant. Additionally, a recovery of the norvaline internal standard (NVIS; added at the 200 μM concentration used routinely) was calculated from a previous experiment with 10 different plasma samples.
Sources of samples
The material for the analysis of which this GC method was applied consisted of ∼1,000 plasma samples from 114 healthy, US subjects of both genders and diverse ethnicity, undergoing an 8 h time-course pharmacokinetic study of acute tryptophan depletion and loading tests, the preliminary results of which have been reported in the abstract form (Dougherty et al. 2005) and will be published in detail elsewhere. Informed consent from the study subjects and ethical approval from the Institutional Ethical Review Board of the University of Texas Health Sciences Center at Houston were obtained by the group leader Professor D. M. Dougherty.
Results
Comments on and experience with the EZ:faast™ amino acid analysis kit
The kit is based on solid-phase extraction using a proprietary cation-exchange mechanism. The acid solution of the norvaline internal standard (Reagent 1) ensures that plasma amino acids are in an anionic form suitable for cationic binding, whereas the alkali of Reagent 3A of the elution medium ensures that the AA cations are released prior to derivatisation. We found the procedure simple and enjoyable. Because of the toxicity of some components, the procedure should be performed in a fume cabinet. To avoid the occasional blockage of the sorbent tip by the buffy layer, thawed plasma sample should be centrifuged at ∼2,000–3,000g for 5 min and a clear portion is pipetted. This is not necessary with freshly isolated plasma. Initially, two plasma samples can be processed in 8–10 min, but, with experience, one person can process six samples in ∼15 min.
GC Profiles of standards and plasma samples
Figure 1 illustrates a number of GC profiles. The first (a) is of a 6-component standard prepared in our laboratory containing a 200 μM concentration each of Trp, Tyr, Phe, Val, Leu and Ile, to which the norvaline internal standard (NVIS) was added, whereas the second (b) is of the Phenomenex standards 1 and 2 containing the above 6 and 20 other amino acids and the NVIS, also at 200 μM each. The order of elution of 25 of these 26 AA (plus the NVIS) is as follows: Ala, Sar, Gly, ABA, Val, BAIB, NVIS, Leu, ALeu, Ile, Thr, Ser, Pro, Asn, Asp, Met, Hyp, Glu, Phe, AAA, Gln, Orn, Lys, His, Tyr and Trp. Although its peak follows that of Trp, the 26th AA (cystine) is not defined here. As shown, the run took less than 7 min. Three plasma profiles are also illustrated in Fig. 1, which shows clearly the differences in the Trp peaks between the normal fasting plasma sample (c) and those obtained from two subjects undergoing, respectively, acute Trp depletion (d) and loading (e) tests. In both these two latter tests, a mixture of 15 amino acids was consumed, which was rich in the 5 Trp competitors (Val, Leu, Ile, Phe and Tyr), but with Trp either omitted (depletion) or added (loading), hence: (1) the differences in the Trp peaks; (2) the larger peaks of the 3 branched-chain amino acids Val, Leu and Ile and (3) of 10 of the other 12 amino acids added (Ala, Gly, Thr, Ser, Pro, Met, Phe, Lys, His and Tyr), compared with those in the fasting sample (c). The other two amino acids added to the above mixture (namely Arg and Cys) could not be identified because of their absence from the standards (see below).
Fig. 1.
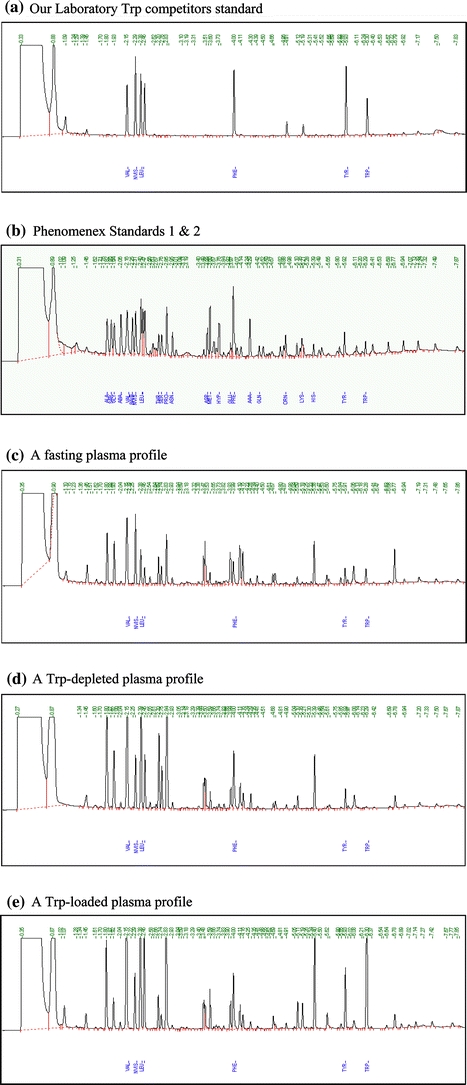
Gas-chromatographic profiles of: a our laboratory standard mixture of six amino acids (Val, Leu, Ile, Phe, Tyr and Trp); b the Phenomenex Standards 1 and 2 containing 23 plus 3 amino acids, respectively; c fasting plasma; d plasma of a subject 4 h after consumption of a tryptophan-free amino acid formulation; e plasma of a subject 4 h after consumption of a tryptophan-loaded amino acid formulation. The standard amino acids in (a) and (b) are all at 200 μM concentration each. All standards and plasma samples included the norvaline internal standard (NVIS), also at 200 μM, whose peak appears immediately after that of Val. For the elution order of all AA in (b), see the “Results” section
Validation of the method
Detection and its limit
We have confirmed the manufacturer’s statement that the limit of detection for most AA is 1 nmol/ ml (1 μM) and were able to detect levels as low as 0.5 μM, except for Asp and Thr, which were not detectable at this latter concentration. Additionally, βAIB (β-aminoisobutyric acid) was not detectable at 0.5 or 1 μM. By contrast, taurine was not detectable by this method, as it is not retained due to its strong sulphonic acid group (pKa 1.9). Also, the inhibitory neurotransmitter amino acid GABA (γ-aminobutyric acid), which is of interest in epilepsy and alcoholism research, cannot be determined in plasma by this method, because it co-elutes with serine. However, the GABA plasma levels (0.15 μM determined by HPLC, see Cowley et al. 1996) are much smaller than those of serine to present a significant interference in Ser analysis. As stated above, Arg and Cys could not be identified by this GC-FID procedure. The kit manufacturer does, however, provide chromatographic information on these two and other AA, suggesting that: (1) Cys migrates after AAA (α-aminoadipic acid) and before Gln; (2) the derivative of Arg is not volatile, hence its determination is achieved with the LC-MS kit; (3) these and all other AA not mentioned so far (e.g. citrulline, 1- and 3-methylhistidines and other sulphur-containing AA) can be measured using the kit for LC-MS.
Precision
The intra-assay coefficient of variation (CV) was tested by injection of one derivatised sample of the Phenomenex standards 1 and 2 (containing 200 μM of each AA) ten times in succession. Inter-assay CV’s were determined from daily GC injections of 25 different calibration mixtures of standards 1 and 2 (also containing 200 μM AA concentrations) for 25 days. The results, limited to our six amino acids of special interest, are shown in Table 2. As shown, all CVs were <10%, in agreement with the manufacturer’s data for most AA.
Table 2.
Intra-assay and Inter-assay coefficients of variation for seven amino acids
| Amino acid | Intra-assay CV (%) (n = 10) |
Inter-assay CV (%) (n = 25) |
|---|---|---|
| Val | 1.9 | 7.8 |
| Leu | 2.3 | 3.8 |
| Ile | 1.5 | 5.6 |
| Phe | 3.8 | 6.3 |
| Tyr | 6.2 | 6.7 |
| Trp | 4.2 | 9.7 |
| NVIS | 4.2 | 8.2 |
Recovery
AA recovery from plasma was assessed for three AA of interest, whose levels vary widely during the acute Trp depletion and loading tests. As shown in Table 3, full or almost full recoveries were observed for all three AA at all three concentrations, with only one exception (Leu at 50 μM, which is below its normal range). The recovery of the NVIS, which is corrected by the software, was also good (96%).
Table 3.
Recovery of some amino acids from plasma samples
| Concentration added (μM) to plasma | |||
|---|---|---|---|
| 50 | 200 | 400 | |
| Recovery (%) | |||
| Val | 108 ± 7 | 105 ± 6 | 118 ± 5 |
| Leu | 89 ± 0 | 98 ± 1 | 100 ± 1 |
| Ile | 104 ± 5 | 99 ± 3 | 104 ± 2 |
Values are means ± SEM for three to four determinations using different plasma samples for each concentration. The NVIS recovery from ten plasmas was 96 ± 3
Comparison with other methods of tryptophan determination
We have compared our GC procedure for plasma total Trp determination with two other methods: the standard fluorimetric method of Denckla and Dewey (1967) and an HPLC procedure, developed in our laboratory, details of which will be reported elsewhere. Both methods also measure total Trp, since they involve prior acid-precipitation and removal of proteins. The opportunity of comparing low, high and normal Trp values was provided by our study of the acute Trp depletion and loading tests, in which extreme decreases and increases in plasma total [Trp], respectively, are induced. The results showed highly significant ((P < 0.0001) linear correlations (r = 0.9784–0.9907) between the Trp values determined by GC and HPLC for both the low-normal and normal-high ranges (data not shown) and between the Trp values determined by GC and the standard fluorimetric method (r = 0.9774) (Fig. 2). These highly significant correlations are not surprising, since they illustrate a comparison of results by two methods measuring the same parameter (Jones and Payne 1997). Bland and Altman (1986) plots were then drawn for the means of each two methods and the differences between them. No absolute or proportionate bias could be detected, as nearly a half of all points lay on the 45° line with the other half equally distributed above and below this line. In addition, the results in Fig. 2 further confirm that the Trp measured by this GC kit is total Trp, as the values shown corresponded to those obtained by fluorimetry, which involves acid precipitation of, and release of Trp from, proteins.
Fig. 2.
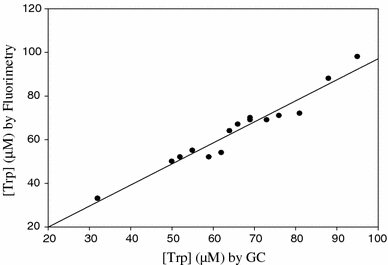
Comparison of plasma total tryptophan determination by gas chromatography (GC) and fluorimetry in 16 samples taken from subjects in the fasting and non-fasting states
Derivatised sample stability
The manufacturer states that the chloroformate-derivatising agent derivatises both the amino and carboxylic acid groups and that the resultant derivatives are stable for 1 day at room temperature and for several days at 4°C. We have not tested stability at room temperature, but can confirm stability at −24 to −32°C for up to 48 h (the longest duration tested). This could be helpful if, for any reason, a stored calibrant (reference) has to be used again 1 or 2 days later, although we recommend the processing of the calibrant reference in each experiment.
Linearity
This was tested using both the Phenomenex Standards 1 and 2 and our own six-component standard (all at 200 μM AA concentration each). Linearity was established for the 1–200 μM range for Val, Leu, Ile and Phe, and for the 2–200 μM range for Tyr and Trp.
Normal values and other results
The mean plasma values ± SD for our six amino acids of special interest in fasting control adult subjects are shown in Table 4, which includes a comparison with some previously published plasma values (Armstrong and Stave 1973). It is clear that our means for most of the above AA are similar, but that our sample shows a larger variation. The close agreement in the [Trp] values between our GC procedure and the cation-exchange method used by the above authors further confirms that the solid-phase particles bind both the free and albumin-bound Trp fractions in plasma, thus measuring total [Trp]. This is further confirmed by the close correlation and agreement between the GC results and those obtained by fluorimetry, which also measures total Trp. It should be emphasised here that a strict comparison between our GC and the cation-exchange method used by the above authors is not possible, since other experimental differences may exist, including population differences. The results in Table 5 (derived mostly from the data in Table 4) give for the first time normal plasma values in 114 healthy, US subjects of parameters of Trp and Tyr availability to the brain, which are the most accurate predictors of the rates of central synthesis of serotonin and dopamine (and hence noradrenaline), respectively. In addition to the above results and the three plasma profiles in Fig. 1, the time course of changes in plasma concentrations of Trp and its five competitors after oral consumption of a 100 g dose of the acute Trp depletion test formulation by 24 normal subjects is illustrated in Fig. 3, which shows, as expected, the decrease in [Trp] and the varying levels of rises in the five competitors reflecting their different contents in the formulation (see Badawy et al. 2007).
Table 4.
Fasting normal values for plasma tryptophan and its competitors
| Amino acid | Mean ± SD | Mean ± SD* |
|---|---|---|
| Ile | 59 ± 23 | 84 ± 18 |
| Leu | 109 ± 33 | 160 ± 27 |
| Phe | 78 ± 27 | 65 ± 9 |
| Trp | 63 ± 20 | 60 ± 15 |
| Tyr | 59 ± 30 | 72 ± 15 |
| Val | 246 ± 53 | 252 ± 37 |
Values are in μmol/L for plasma samples from 114 adult, US subjects analysed by GC (our results) and for those analysed by *cation-exchange from 91 subjects in the study by Armstrong and Stave (1973)
Table 5.
Normal plasma values for parameters of tryptophan and tyrosine availability to the brain in 114 healthy, US subjects
| Parameter | Mean ± SD | Range |
|---|---|---|
| [Free Trp] (μM) | 6.4 ± 0.3 | 1.5–14.9 |
| [Total Trp] (μM) | 63 ± 20 | 27–127 |
| [CAA] (μM) | 552 ± 114 | 317–907 |
| [Free Trp]/[CAA] ratio | 0.0125 ± 0.0056 | 0.0070–0.0272 |
| [Total Trp]/[CAA] ratio | 0.117 ± 0.036 | 0.050–0.236 |
| [Phe + Tyr] (μM) | 138 ± 49 | 61–464 |
| [LNAA + Trp] (μM) | 478 ± 100 | 272–850 |
| [Phe + Tyr]/[LNAA + Trp] ratio | 0.2940 ± 0.1029 | 0.1482–0.9261 |
[Free Trp] was determined fluorimetrically in ultrafiltrates, whereas those of all other amino acids including total Trp were determined by GC, from which ratios were calculated. Apart from [Free Trp], the above data are derived from those in Table 4. CAA is the sum of Val, Leu, Ile, Phe and Tyr, whereas LNAA are the sum of Val, Leu and Ile
Fig. 3.
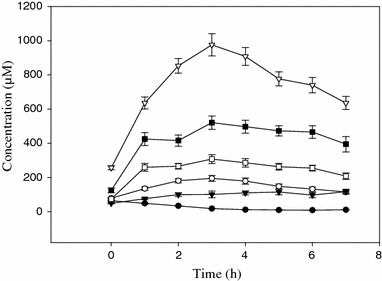
Time course of changes in concentrations of some amino acids following consumption of a 100 g dose of the acute tryptophan depletion test formulation. Plasma was analysed before and at hourly intervals for 7 h after oral consumption of the formulation for Trp (filled circle), Phe (filled inverted triangle),Tyr (open circle), Ile (open square), Leu (filled square) and Val (openinverted triangle). Values are means ± SEM (bars) for n = 24 subjects
Discussion
In the present work, we have successfully applied the Phenomenex EZ:faast™ amino acid analysis kit for gas-chromatographic (GC) determination of plasma amino acid concentrations. In our experience, this is a rapid, simple, elegant and sensitive method possessing two particularly important new features. The first is that it does not require prior removal of proteins, urea or other interfering substances, as it uses solid-phase extraction, thus avoiding lengthy sample preparative (including derivatisation) procedures and the associated losses due to instability and poor recoveries of some amino acids (Walker and Mills 1995). Secondly, coupled with suitable data handling and processing software (the Perkin-Elmer Total Chrome system), it can deliver an almost complete amino acid profile for the reference and first plasma sample in <30 min from start to finish. This is because the 7-min GC run per plasma sample is preceded by a short sample preparation time of 8–10 min per two samples, and ∼15 min for six samples. Other advantages include: (1) freedom from interference by drugs or their metabolites; (2) stability of reagents for 12 months; (3) rapid (1 min) derivatisation in aqueous solution of both the NH2 and COOH groups at room temperature; (4) stability of the derivatised AA for several hours at room temperature and for days at 4°C or below. All these advantages coupled with the greater sensitivity, resolution, sharpness and reproducibility of its peaks combine to make GC the ideal technique for amino acid analysis in the clinical or research laboratory. The result is a dramatic reduction in manpower hours and a simultaneous improvement in analytical performance, hitherto unseen with other analytical techniques, including existing GC methods with an average analysis time of 30 min (Walker and Mills 1995), which far outweigh the not excessive cost of equipment. Although different versions of the kit can be used with a GC with different detector types (FID, NPD, MS) or with liquid chromatography (LC-MS), our experience with the cheapest system (GC-FID), using the corresponding kit, which is the fastest within this family of kits (7 min run time versus 12 min with LC-MS), was very satisfactory, even with manual injection. A refrigerated liquid autosampler would enable overnight running of samples at the rate of 8 samples/h, an eightfold advance over HPLC (Walker and Mills 1995). Only such a speed can meet emergency requests and the demands of a high throughput clinical or research laboratory.
The only disadvantage of the GC family of kits is its inability to determine some amino acids, namely Arg, Cit, 1- and 3-methylhistidines, Cys and some other sulphur-containing AA. All these and other AA and their derivatives (up to 50 in total), can, however, be determined using the kit for LC-MS. Thus, depending on the requirements of, and the availability of equipment in, the analytical laboratory, the appropriate kit can be used for various clinical and research purposes.
We have confirmed the manufacturer’s data on the stability of the chloroformate derivatives and the limits of detection of the various AA and have additionally examined other aspects of method validation, including linearity, precision, recovery from plasma, comparison with other methods (using Trp only) and comparison of normal fasting plasma values for six AA with corresponding values in literature using cation-exchange chromatography, all of which had satisfactory outcomes.
We have not examined the chromatographic behaviour of the six urine-specific AA and their derivatives, and it therefore remains for others to include these in future assessments. This method is not suitable for the analysis of plasma taurine or GABA; the former is not retained due to its strong sulphonic acid group, whereas the latter co-elutes with serine, but this is not a problem, given the minimal contribution of physiological concentrations of this neurotransmitter (Cowley et al. 1996) to the serine peak.
Although we placed a special emphasis on analysis of Trp and other amino acids, which compete with it for entry into the brain (Val, Leu, Ile, Phe and Tyr), by a happy coincidence, this particular AA group is also of special interest in phenylketonurea (PKU), tyrosinaemia and maple-syrup disease (MSD) research and clinical management. This method will therefore be of additional special interest to those working in these areas. In this latter respect, another GC method, also using solid-phase extraction, but after derivatisation of amino acids suitably extracted from neonatal blood samples, has been published by Deng et al. (2004), using GC-MS, which involved a ∼1 h AA extraction from blood spots, twice as long derivatisation and processing time (15 min) and twice as long GC run time (∼14 min). Nevertheless, though slower than our Phenomenex, this latter method further demonstrates the faster performance of GC over other chromatographic procedures.
As we have limited our comparison of this GC method with other methods only for plasma Trp analysis, we could not provide direct comparisons for other AA. However, and despite the fact that different laboratories have different normal values and ranges depending on various factors, indirectly, this GC method gives values for the 5 Trp competitors Val, Leu, Ile, Phe and Tyr (and also Trp) not dissimilar to those in the literature (Table 4).
We have provided in Table 5 the normal values of 114 healthy, US subjects for parameters of availability to the brain of the amino acid precursors of serotonin (Trp) and dopamine and noradrenaline (Phe and Tyr), which should make a useful reference in future research in this area. Previously, we had provided corresponding data for serum parameters of Trp availability to the brain and established criteria for assessing the serotonin-biosynthetic status using values from 42 fasting, healthy, adult UK subjects (Badawy et al. 2005). Determination of these parameters is important in assessing the serotonin and catecholamine status in normal subjects and in those with behavioural disorders (Sheehan et al. 1996; Reilly et al. 1997; Badawy et al. 2005).
In summary, our informal evaluation of the Phenomenex EZ:faast procedure for analysis of circulating amino acids using the kit for GC-FID has demonstrated the advantages of this new method. The versatility of the procedure through availability of various kits will enable AA analysts to select the most suitable of the kits for their purposes. We believe that our study will raise the awareness, in AA analysts and researchers, of this new procedure and will lead to further assessments and its eventual adoption as the method of choice in clinical and research laboratories.
Acknowledgments
The experimental part of this study was completed during the tenure of the authors at the Cardiff and Vale NHS Trust’s Biomedical Research Laboratory, Whitchurch Hospital, which has been decommissioned in July 2006 after nearly 100 years of celebrated history in neurochemical research. We thank Mr. Ben Atkins, technical consultant, Phenomenex UK Ltd., for his helpful advice and discussions and provision of kit components at the early stages of this study, Professor Donald M. Dougherty and his research team at the University of Texas at San Antonio, TX, USA, for provision of the plasma samples used in the present work, Dr. M. A. Anwar for participating in the initial exploration of this GC procedure, and the Wellcome Trust for funding the GC equipment through a project grant to AA-BB.
References
- Armstrong MD, Stave U (1973) A study of plasma free amino acid normal levels. II. Normal values for children and adults. Metabolism 22:561–569 [DOI] [PubMed]
- Badawy AA-B, Evans M (1976) Animal liver tryptophan pyrrolases: absence of apoenzyme and of hormonal induction mechanism from species sensitive to tryptophan toxicity. Biochem J 158:79–88 [DOI] [PMC free article] [PubMed]
- Badawy AA-B, Morgan CJ, Llewelyn MB, Albuquerque SRJ, Farmer A (2005) Heterogeneity of serum tryptophan concentration and availability to the brain in patients with the chronic fatigue syndrome. J Psychopharmacol 19:385–391 [DOI] [PubMed]
- Badawy AA-B, Morgan CJ, Turner JA (2005) Application of the Phenomenex EZ:faast amino acid analysis kit for rapid determination of concentrations of plasma tryptophan and its competitors. J Psychopharmacol 19(Suppl to No 5):A35 [DOI] [PMC free article] [PubMed]
- Badawy AA-B, Morgan CJ, Turner JA, Dougherty DM, Marsh DM, Mathias CW, Jagar AA, Addicott MA, Moeller FG (2007) The acute tryptophan depletion and loading tests: specificity issues. In: Takai K (ed) Proceedings of the 11th meeting of the international society for tryptophan research, Tokyo, 4–7 July 2006, ICS 1304C, pp 159–166
- Bland JM, Altman DG (1986) Statistical methods for assessing agreement between two methods of clinical measurement. Lancet i:307–310 [PubMed]
- Bloxam DL, Warren WH (1974) Error in the determination of tryptophan by the method of Denckla and Dewey: a revised procedure. Anal Biochem 60:621–625 [DOI] [PubMed]
- Cowley DS, Roy-Byrne PP, Greenblatt DJ, Kramer GL, Petty F (1996) Effect of diazepam on plasma γ-aminobutyric acid in sons of alcoholic fathers. Alcohol Clin Exp Res 20:343–347 [DOI] [PubMed]
- Denckla WD, Dewey HK (1967) The determination of tryptophan in plasma, liver and urine. J Lab Clin Med 69:160–169 [PubMed]
- Deng C, Li N, Zhang X (2004) Rapid determination of amino acids in neonatal blood samples based on derivatisation with isobutyl chloroformate followed by solid phase microextraction and gas chromatography/mass spectrometry. Rapid Commun Mass Spectrom 18:2558–2564 [DOI] [PubMed]
- Dougherty DM, Marsh DM, Mathias CW, Addicott MA, Jaggar AA, Morgan CJ, Badawy AA-B (2005) Time-course and side effect comparison of amino acid formulations for manipulation of plasma l-tryptophan. J Psychopharmacol 19(Suppl to No 5):A34
- Jones R, Payne R (1997) Analytical methods: control and comparison. In: Jones R, Payne B (eds) Clinical investigation and statistics in laboratory medicine. ACB Venture, Ch 2, London, pp 27–64
- Phenomenex EZ:faast (easy fast) amino acid sample testing kit (2003) User guide, Phenomenex, 411 Madrid Avenue, Torrance, CA 90501–1430, USA (http://www.phenomenex.com)
- Reilly JG, McTavish SFB, Young AH (1997) Rapid depletion of plasma tryptophan: a review of studies and experimental methodology. J Psychopharmacol 11:381–392 [DOI] [PubMed]
- Sheehan BD, Tharyan P, McTavish SFB, Campling GM, Cowen PJ (1996) Use of a dietary manipulation to deplete plasma tyrosine and phenylalanine in healthy subjects. J Psychopharmacol 10:231–244 [DOI] [PubMed]
- Walker V, Mills GA (1995) Quantitative methods for amino acid analysis in biological fluids. Ann Clin Biochem 32:28–57 [DOI] [PubMed]
- Young SN, Smith SE, Pihl R, Ervin FR (1985) Tryptophan depletion causes a rapid lowering of mood in normal males. Psychopharmacology 87:173–177 [DOI] [PubMed]