Abstract
OBJECTIVE
RAGE interacts with the endogenous ligands S100 calgranulins and high mobility group box 1 (HMGB1) to induce inflammation. Since hyperglycemia-induced reactive oxygen species (ROS) activate many pathways of diabetic tissue damage, the effect of these ROS on RAGE and RAGE ligand expression was evaluated.
RESEARCH DESIGN AND METHODS
Expression of RAGE, S100A8, S100A12, and HMGB1 was evaluated in human aortic endothelial cells (HAECs) incubated in normal glucose, high glucose, and high glucose after overexpression of either uncoupling protein 1 (UCP1), superoxide dismutase 2 (SOD2), or glyoxalase 1 (GLO1). Expression was also evaluated in normal glucose after knockdown of GLO1. Expression was next evaluated in high glucose after knockdown of nuclear factor (NF)-κB p65 (RAGE) and after knockdown of activated protein-1 (AP-1) (S100A8, S100A12, and HMGB1), and chromatin immunoprecipitation (ChIP) was performed ± GLO1 overexpression for NFκB p65 (RAGE promoter) and AP-1 (S100A8, S100A12, and HMGB1 promoters). Finally, endothelial cells from nondiabetic mice, STZ diabetic mice, and STZ diabetic mice treated with the superoxide dismutase mimetic Mn(III)tetrakis(4-benzoic acid)porphyrin chloride (MnTBAP) were evaluated.
RESULTS
High glucose increased RAGE, S100A8, S100A12, and HMGB1 expression, which was normalized by overexpression of UCP1, SOD2, or GLO1. GLO1 knockdown mimicked the effect of high glucose, and in high glucose, overexpression of GLO1 normalized increased binding of NFκB p65 and AP-1. Diabetes increased RAGE, S100A8, and HMGB1 expression, and MnTBAP treatment normalized this.
CONCLUSIONS
These results show that hyperglycemia-induced ROS production increases expression of RAGE and RAGE ligands. This effect is mediated by ROS-induced methylglyoxal, the major substrate of glyoxalase 1.
The receptor for advanced glycation end products (RAGE) is a pattern recognition receptor that interacts with a number of endogenous ligands in normal physiology, playing a homeostatic role in lung development, osteoclast differentiation, innate immunity, and inflammatory cell recruitment and adhesion (1–3). However, conditions such as diabetes disturb homeostasis, increase RAGE expression (4), increase advanced glycation end product formation, and cause release of intracellular calcium binding molecules, the S100 calgranulins (5–7), and the DNA binding protein amphoterin, or high mobility group box 1 (HMGB1), which act as danger signals, called alarmins, that bind to RAGE with high affinity and activate immune cells and vascular endothelium (1,8,9). RAGE signaling stimulates a host of proinflammatory events (1,3). Normally, these appear to play an important role in acute inflammation. In contrast, when responding to persistent elevations of endogenous ligands, RAGE signaling promotes chronic inflammation. Such chronic inflammation plays a major role in the development of diabetic complications, including atherosclerosis (10–12).
Because hyperglycemia-induced reactive oxygen species (ROS) activate many pathways of diabetic tissue damage, including intracellular AGE formation (13,14), the effect of these ROS on RAGE and RAGE ligand expression was evaluated. Although a large number of S100 proteins have been shown to interact with RAGE in cell-based assays (15), S100A8 and S100A12 were selected for study because these proteins are found in high concentrations in inflamed tissue, and they exhibit proinflammatory effects in vitro at concentrations found at sites of inflammation in vivo (9).
RESEARCH DESIGN AND METHODS
Primary human aortic endothelial cells (HAECs) (from Cambrex) and conditionally immortalized HAECs (generated by Dr. Anita Samuga, Albert Einstein College of Medicine) were maintained in EBM-2 medium (from Lonza) with all the supplements. Immortalized HAECs were grown at 33°C, but experiments and treatment were performed at the nonpermissive temperature of 37°C. Mn(III)tetrakis(4-benzoic acid)porphyrin chloride (MnTBAP) was obtained from Calbiochem (San Diego, CA). UCP1, SOD2, and GLO1 cDNAs (obtained from Open Biosystems) were cloned into the shuttle vector pAd5CMVK-NpA, and adenoviral vectors and empty control virus were prepared by the Gene Transfer Vector Core at the University of Iowa. Extracellular HMGB1 level was analyzed by an HMGB1 ELISA detection kit (#APO-54N-043 from Apotech) according to the manufacturer's instructions. shRNA lentivirus for human GLO1 and nontarget control were obtained from Sigma. GLO1 mouse antibody was obtained from Abnova. siRNA for the nuclear factor (NF)-κB p65 subunit, activated protein-1 (AP-1) (c-Jun), and scrambled oligonucleotide as control (sc-37007) were obtained from Santa Cruz Biotech. The antibodies for RAGE (sc-74473), S100A8 (sc-20174 for human, and sc-8113 for mouse), HMGB1 (sc-56698), and 3-nitrotyrosine (sc-32731) were obtained from Santa Cruz Biotech. Methylglyoxal-modified protein was measured by Western blotting using a monoclonal antibody to the major intracellular methylglyoxal-derived epitope, N-acetyl-N (5-hydro-5-methyl)-4-imidazolone.
Measurement of ROS generation.
Treated cells seeded in a 96-well plate were incubated with 10 μmol/l CM-H2DCFDA (Invitrogen) for 45 min at 37°C, and the intracellular formation of ROS was measured at excitation/emission wavelengths of 485/530 nm using a Wallac 1420 Fluorescent Plate Reader.
RT reaction and real-time quantitative PCR.
Total RNA from cells was extracted using the RNeasy Mini Kit or RNeasy Micro Kit (Qiagen), and the RNA was reverse-transcribed with the SuperScript III First Strand Synthesis System (Invitrogen). Real-time quantitative PCR (qPCR) was run on a LightCycler Roche 480 with LightCycler 480 SYBR Green I Master kit (Roche). PCR was performed by denaturing at 95°C for 7 min, followed by 45 cycles of denaturation at 95°C, annealing at 60°C, and extension at 72°C for 10 s, respectively. Results were normalized by β-actin. Primer sequences are shown in Table 1.
TABLE 1.
Sequences of primers
| Gene | Target | Species | Forward primer (5′→3′) | Reverse primer (5′→3 ′) |
|---|---|---|---|---|
| β-actin | mRNA | Human | gatgcagaaggagatcactgc | atactcctgcttgctgatcca |
| RAGE | mRNA | Human | ctaccgagtccgtgtctacca | catccaagtgccagctaagag |
| S100A8 | mRNA | Human | tatcaggaaaaagggtgcaga | tctttgtggctttcttcatgg |
| S100A12 | mRNA | Human | tctaagggtgagctgaagcag | caatggctaccagggatatga |
| HMGB1 | mRNA | Human | ggagatcctaagaagccgaga | catggtcttccacctctctga |
| RAGE | Promoter/ChIP | Human | aacatcaacactgtcccatcc | ccatcacacttccaacctgtc |
| S100A8 | Promoter/ChIP | Human | caaacttgccgttttccataa | accacctgacacctacaagga |
| S100A12 | Promoter/ChIP | Human | caggagggcaaaattcagtct | ttagcccttgggtgaagaaat |
| HMGB1 | Promoter/ChIP | Human | actttcacggctccaaaaa | ggtttggccctgagatgtatt |
| β-actin | mRNA | Mouse | tcttgggtatggaatcctgtg | atctccttctgcatcctgtca |
| vWR | mRNA | Mouse | cctctctcaggactgcaacac | tattggcagatcccactgaag |
| α-actin | mRNA | Mouse | tggacttcgagaatgagatgg | cgcagactccataccgataaa |
| RAGE | mRNA | Mouse | acatgtgtgtctgagggaagc | agctctgaccgcagtgtaaag |
| S100A8 | mRNA | Mouse | ccatgccctctacaagaatga | tatcaccatcgcaaggaactc |
| HMGB1 | mRNA | Mouse | cttcggccttcttcttgttct | ggcagctttcttctcataggg |
Western blotting.
Proteins were separated on 10% SDS-PAGE gels, blotted with the indicated primary antibodies, and then simultaneously incubated with the differentially labeled species-specific secondary antibodies, anti-RABBIT IRDye 800CW (green), and anti-MOUSE (or goat) ALEXA680 (red). Membranes were scanned and quantitated with the ODYSSEY Infrared Imaging System (LI-COR, Lincoln, NE).
GLO1 activity assay.
GLO1 activity was measured by using a spectrophotometric method that monitors the increase in absorbance at 240 nm due to the formation of S-d-lactoylglutathione (ε240 = 3.37 mmol · l−1 · cm−1) for 2 min at 25°C (16). Briefly, treated cells were harvested, protein lysates prepared, and protein concentration measured by the Coomassie Protein Assay kit (Thermo Fisher Scientific) using BSA as a standard. The reaction buffer (7.9 mmol/l methylglyoxal, 1 mmol/l freshly prepared glutathione, and 16 mmol/l MgSO4 in 200 mmol/l imidazole buffer, pH 7.0) was incubated for at least 2 min to ensure the equilibration of hemimercaptal, the actual substrate of GLO1. The hemimercaptal is formed nonenzymatically and its concentration was calculated to be 0.7 mmol/l using Keq = 3.1 mmol/l. The reaction was initiated by the addition of a rate-limiting volume of protein lysates (10–30 μg) to 3.0 ml of reaction mixture. One unit of GLO1 activity is defined as the amount of enzyme catalyzing formation of 1 μmol of S-d-lactoylglutathione per minute.
Chromatin immunoprecipitation (ChIP).
Treated cells were washed and cross-linked using 1% formaldehyde for 20 min. After stopping cross-linking by addition of 0.1 mol/l glycine, cell lysates were sonicated and centrifuged. A total of 500 μg protein was precleared by BSA/salmon sperm DNA and a slurry of protein A agarose beads. Immunoprecipitations were performed using the indicated antibodies or preimmune rabbit IgG in the presence of BSA/salmon sperm DNA and a 50% slurry of protein A agarose beads. Input and immunoprecipitates were washed and eluted and then incubated for 2 h at 42°C in the presence of proteinase K followed by 6 h at 65°C to reverse the formaldehyde cross-linking. DNA fragments were recovered by phenol/chloroform extraction and ethanol precipitation. The related fragments on promoters of RAGE (−720 to −561), S100A8 (−1,290 to −1,132), S100A12 (−163 to −4), and HMGB1 (−200 to −54) were amplified by real-time PCR (qPCR).
In vivo mouse experiments.
Diabetes was induced in C57/Blk6 mice by consecutive injection of 50 mg/kg streptozotocin (STZ) (0.05 mol/l sodium citrate, pH 5.5) for 5 days after an 8-h fast. Animals with blood glucose >300 mg/dl were considered diabetic. After 4 weeks of diabetes, one group of STZ mice was treated with 10 mg/kg MnTBAP intraperitoneally for 7 days, whereas control mice received only vehicle. Mice were killed by cervical dislocation, and the aorta was dissected and snap-frozen in OCT compound. Then, 10-μm sections were cut by microtome and mounted on PEN (polyethylene naphthalate) membrane slides (2.0 μm, Leica). Aortic endothelial cells or smooth muscle cells were isolated by laser capture microdissection for analysis of mRNA expression level by qPCR. All in vivo procedures were approved by the Institutional Animal Care and Use Committee of the Albert Einstein College of Medicine. Blood glucose values were 158 ± 19 mg/dl for CTL, 391 ± 21 mg/dl for STZ diabetic, and 376 ± 26 mg/dl for MnTBAP-treated STZ mice. Body weights were 29.7 + 1.7 g (CTL), 26.7 + 1.8 g (STZ), and 27.1 + 1.4 g (MnTBAP-treated STZ mice).
Statistical analysis.
Results are expressed as means ± SD. All experiments were performed at least in triplicate. Data distribution was analyzed, and statistical differences for different treatments were evaluated by ANOVA and the Tukey-Kramer test using SPSS 15 software.
RESULTS
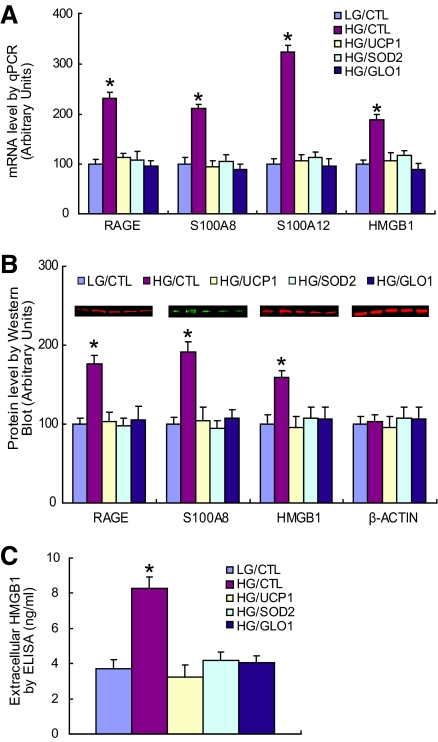
In cultured HAECs, mRNA levels of RAGE, S100A8, and S100A12 calgranulins and HMGB1 were increased by high glucose by 2.3-, 2.1-, 3.4-, and 1.7-fold, respectively (Fig. 1A). Each of these high glucose-induced increases was prevented by overexpression of either uncoupling protein-1 (UCP1) or manganese superoxide dismutase (SOD2), both of which prevent hyperglycemia-induced superoxide production by the mitochondrial electron transport chain (13,14). Increased gene expression of RAGE, S100A8, S100A12, and HMGB1 was also prevented by overexpression of the α-oxoaldehyde degradating enzyme glyoxalase 1 (GLO1). The major physiological substrate for GLO1, methylglyoxal, is a highly reactive dicarbonyl that accumulates in endothelial cells and in several other cell types exposed to hyperglycemia, as a consequence of increased mitochondrial superoxide production. Overexpression of UCP1, SOD2, and GLO1 in cells subjected to 5 mmol/l glucose decreased ROS levels by 40% (data not shown).
FIG. 1.
Hyperglycemia-induced ROS increase expression of RAGE, S100 calgranulins, and HMGB1. A: Primary HAECs were infected with UCP1, SOD2, GLO1, or empty control adenovirus (CTL). After incubation with either low glucose (LG) (5 mmol/l) or high glucose (HG) (30 mmol/l) for 5 days, mRNA levels were determined by real-time PCR (n = 3). B: Intracellular protein levels of RAGE, S100A8, and HMGB1 were determined by Western blotting (n = 4). Protein sizes were evaluated by standard protein markers, and their sizes were as follows: RAGE (46 kDa), S100A8 (11 kDa), and HMGB1 (25 kDa). C: Levels of secreted HMGB1 were determined in culture medium by enzyme-linked immunosorbent assay (ELISA) (n = 5). Values are shown as means + SD, *P < 0.05 vs. LG/CTL group. (A high-quality color digital representation of this figure is available in the online issue.)
Protein expression of RAGE, S100A8, and intracellular HMGB1 paralleled mRNA levels (Fig. 1B). High glucose increased levels 1.7-, 1.9-, and 1.5-fold, respectively. Because HMGB1 is released into the extracellular milieu under stressed conditions (17), extracellular HMBG1 protein was also measured in the medium (Fig. 1C). Extracellular HMGB1 increased 2.2-fold in high glucose. This increase was totally normalized by overexpression of either UCP1, or SOD2, or GLO1.
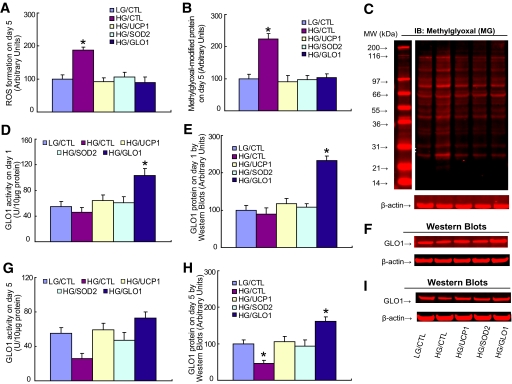
High glucose increased ROS twofold, and this was prevented by overexpression of either UCP1, SOD2, or GLO1 (Fig. 2A). Similarly, high glucose increased levels of methylglyoxal-modified intracellular protein, and this was also prevented by overexpression of either UCP1, SOD2, or GLO1 (Fig. 2B). Representative Western blots are shown in Fig. 2C. Endogenous GLO1 activity and protein levels were unchanged after incubation in high glucose for 24 h (Fig. 2D and E). Representative Western blots for Fig. 2E are shown in Fig. 2F. However, after 5 days, hyperglycemia-induced ROS reduced endogenous GLO1 activity (Fig. 2G) and protein levels (Fig. 2H) by 50%. Representative Western blots for 2 h are shown in Fig. 2I.
FIG. 2.
Overexpression of UCP1, SOD2, and GLO1 prevents hyperglycemia-induced ROS generation and methylglyoxal formation. Primary HAECs were infected with UCP1, SOD2, GLO1, or empty control adenovirus (CTL). After incubation with either low glucose (LG) (5 mmol/l) or high glucose (HG) (30 mmol/l) for 1 or 5 days, the cells were used for analysis. A: ROS formation on day 5. B: Methylglyoxal-modified protein on day 5. C: Representative blots for B. D: GLO1 activity on day 1. E: GLO1 protein on day 1. F: Representative blots for E. G: GLO1 activity on day 5. H: GLO1 protein level on day 5. I: Representative blots for H. n = 4. *P < 0.05 vs. LG/CTL group. Values are shown as means + SD. (A high-quality color digital representation of this figure is available in the online issue.)
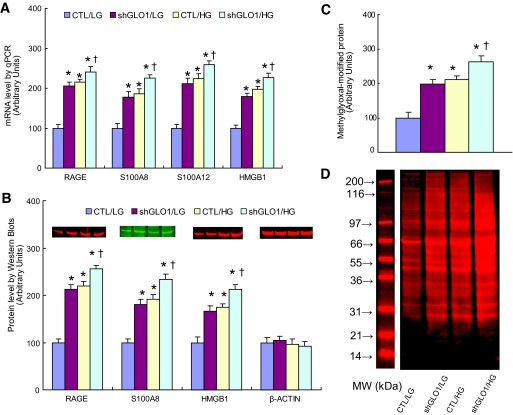
To confirm that hyperglycemia-induced increases in intracellular methylglyoxal were sufficient to increase expression of RAGE and RAGE ligands, GLO1 was knocked down 80% by shRNA in cells exposed to normal glucose (Fig. 3A and B). When GLO1 was knocked down, mRNA levels for RAGE, S100A8, S100A12, and HMGB1 were increased by 2.3-, 1.9-, 2.4- and 1.7-fold, respectively, levels equivalent to those induced by high glucose (Fig. 3A). In cells incubated in high glucose, GLO1 siRNA further increased expression of RAGE and RAGE ligands. Similarly, RAGE, S100A8, and HMGB1 protein levels increased 2.1-, 1.8-, and 1.6-fold, respectively, when GLO1 was knocked down in cells exposed to normal glucose (Fig. 3B), levels equivalent to those induced by high glucose. In cells incubated in high glucose, GLO1 siRNA further increased expression of RAGE and RAGE ligands. No antibody was available for S100A12. GLO1 knockdown also increased intracellular levels of methylglyoxal-modified protein to that caused by high glucose incubation (Fig. 3C). Representative Western blots for Fig. 3C are shown in Fig. 3D.
FIG. 3.
GLO1 knockdown duplicates the effect of hyperglycemia on expression of RAGE, S100 calgranulins, and HMGB1. Conditionally immortalized HAECs were infected with either shGLO1 or nontargeting control (CTL) lentivirus and then incubated in either low glucose (LG) or high glucose (HG) for 5 days. A: mRNA levels were determined by real-time PCR (n = 3). B: Protein levels were determine by Western blotting (n = 4). Protein sizes were evaluated and confirmed by standard protein markers, and their sizes were as follows: RAGE (46 kDa), S100A8 (11 kDa), and HMGB1 (25 kDa). C: Intracellular methylglyoxal-modified proteins were quantitated by Western blotting (n = 4). D: Representative blots for C. Values are shown as means + SD. *P < 0.05 vs. CTL group. (A high-quality color digital representation of this figure is available in the online issue.)
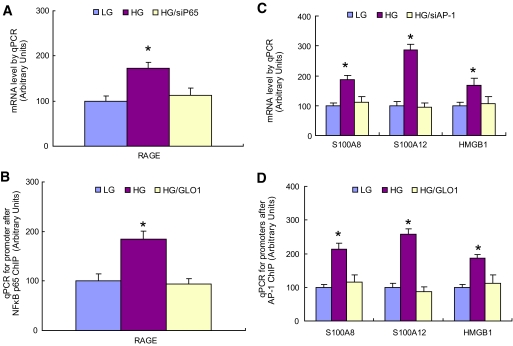
We next asked how ROS-induced increases in methylgloxal-modified protein caused increased expression of RAGE and its endogenous ligands. Induction of RAGE expression by AGEs and ligands such as tumor necrosis factor (TNF)-α requires binding of the transcription factor NFκB (p65/p50) to canonical binding sites in the RAGE promoter, while induction by other ligands requires binding of the transcription factor Sp1 (18,19). Because hyperglycemia-induced ROS cause increased expression of p65 (20), the effect of p65 knockdown by siRNA on RAGE expression was determined. Knockdown of NFκB p65 (80%) prevented increased RAGE expression by high glucose (Fig. 4A). GLO1 knockdown increases p65 expression in the absence of hyperglycemia, and GLO1 overexpression prevents high glucose-induced p65 expression (20). Therefore, the effect of GLO1 overexpression on NFκB p65 binding to the RAGE promoter was determined using chromatin immunoprecipitation (ChIP). As shown in Fig. 4B, high glucose increased binding of this transcription factor to the RAGE promoter, and GLO1 overexpression prevented this. A search of the S100A8, S100A12 calgranulin, and HMGB1 promoters for common putative transcription factor binding sites showed that binding sites for the redox-sensitive transcription factor AP-1 were common to all three promoters. Therefore, the effect of AP-1 (c-jun) knockdown by siRNA on RAGE expression was determined. Knockdown of AP-1 prevented increased S100A8, A100A12 calgranulin, and HMGB1 expression by high glucose (Fig. 4C). The effect of GLO1 overexpression on AP-1 binding to the promoters of S100A8, S100A12, and HMGB1 are shown in Fig. 3D. AP-1 binding to these promoters was determined using ChIP. High glucose increased binding of this transcription factor to the three RAGE ligand promoters, and GLO1 overexpression prevented this increase.
FIG. 4.
Hyperglycemia-induced methylglyoxal increases binding of NFκB to the RAGE promoter and binding of AP-1 to the S100A8, S10012, and HMGB1 promoters. A: Conditionally immortalized HAECs were treated with low glucose (LG), high glucose (HG), or HG after transfection with either scrambled oligonucleotides (LG and HG) or siRNA for p65 (HG/siP65) for 5 days, and the RAGE mRNA level was determined by qPCR (n = 3). B: Primary HAECs were treated with LG, HG, or HG after infections with either nontarget control or GLO1 adenovirus (HG/GLO1) for 5 days. Chromatin immunoprecipitation was performed using the p65 antibody, and the RAGE promoter was amplified by qPCR (n = 4). C: Conditionally immortalized HAECs were treated with LG, HG, or HG after transfection with either scrambled oligonucleotides or siRNA for AP-1 (c-Jun) (HG/siAP-1) for 5 days, and mRNA levels of S100A8, S10012, and HMGB1 were determined by qPCR (n = 3). D: Primary HAECs were treated with LG, HG, or HG after infections with either nontarget control or GLO1 adenovirus (HG/GLO1) for 5 days. Chromatin immunoprecipitation was performed using c-Jun antibody, and the S100A8, 100A12, and HMGB1 promoters were amplified by qPCR (n = 4). Values are shown as means + SD. *P < 0.05 vs. LG group. (A high-quality color digital representation of this figure is available in the online issue.)
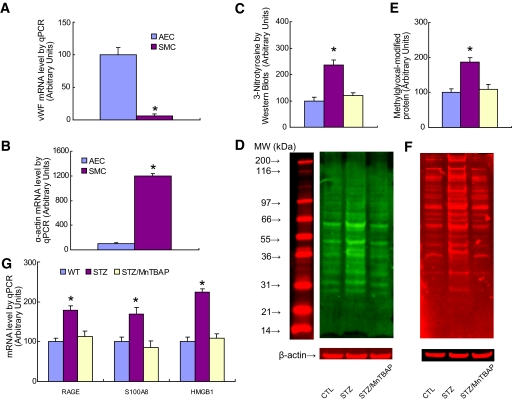
Finally, expression of RAGE, S100A8, and HMGB1 was evaluated in aortic endothelial cells isolated by laser capture microdissection from nondiabetic mice, STZ diabetic mice, and STZ diabetic mice treated with the superoxide dismutase mimetic MnTBAP (Fig. 5). S100A12 was not measured, since the S100A12 gene is not expressed in rodents (21). To confirm that laser capture microdissection had successfully isolated endothelial cells, mRNA levels of vWF, an endothelial cell–specific marker; α-actin, a smooth muscle cell marker; and β actin, a control gene, were measured (Fig. 5A and B). vWF mRNA was greatly enriched in endothelial cells compared with SMCs, whereas SMCs were greatly enriched in α-actin compared with endothelial cells.
FIG. 5.
Treatment of diabetic mice with MnTBAP normalizes increased expression of RAGE, S100 calgranulins, and HMGB1. A: Aortic endothelial cells (AEC) or smooth muscle cells (SMC) were isolated from either wild-type (WT) mice, STZ-induced diabetic mice (STZ), or STZ-diabetic mice treated with MnTBAP (STZ/MnTBAP), using laser capture microdissection. mRNA levels for vWF (A) and α-actin (B) were determined by qPCR (n = 3, *P < 0.05 vs. AEC group). C: 3-Nitrotyrosine content of aortic cells from the above mice was determined by Western blot (n = 4, *P < 0.05 vs. CTL group). D: Representative blots for C. E: Methylglyoxal-modified protein content of aortic cells from the above mice was determined by Western blot (n = 4, *P < 0.05 vs. CTL group). F: Representative blots for E. G: Aortic endothelial cells were used for analysis of gene expression by qPCR (n = 3, *P < 0.05 vs. WT group). Values are shown as means + SD. (A high-quality color digital representation of this figure is available in the online issue.)
Diabetes increased intracellular ROS, as determined by 3-nitrotyrosine levels, and MnTBAP treatment normalized this (Fig. 5C). Representative Western blots for Fig. 5C are shown in Fig. 5D. Intracellular levels of methylglyoxal-modified protein were similarly increased by diabetes and normalized by MnTBAP treatment (Fig. 5E). Representative Western blots for Fig. 5E are shown in Fig. 5F.
Diabetes increased RAGE mRNA levels by 1.8-fold, S100A8 calgranulin mRNA levels by 1.7-fold, and HMGB1 mRNA levels by 2.4-fold (Fig. 5G). Treatment of diabetic mice with the superoxide dismutase mimetic compound MnTBAP normalized diabetic endothelial cell RAGE, S100A8, and HMGB1 mRNA levels.
DISCUSSION
In the present study, we show that hyperglycemia-induced ROS production by the mitochondrial electron transport chain increases expression of RAGE and three high-affinity endogenous RAGE ligands—S100A8 calgranulin, S100A12 calgranulin, and HMGB1—that exhibit proinflammatory effects in vitro at concentrations found at sites of inflammation in vivo (9). This effect is mediated by ROS-induced production of methylglyoxal, the major α-oxoaldehyde substrate of the enzyme glyoxalase 1. This increases binding of NFκB to the RAGE promoter and of AP-1 to the S100A8, S100A12, and HMGB1 promoters. Diabetes also increased expression of RAGE, S100A8, and HMGB1 in aortic endothelial cells in vivo, and treatment of diabetic mice with the superoxide dismutase mimetic MnTBAP normalized each of these increases.
Much evidence supports a unified mechanism of hyperglycemia-induced cellular damage, in which intracellular hyperglycemia develops in target cells of diabetic complications, causing increased mitochondrial production of ROS. The ROS cause strand breaks in nuclear DNA, which activate the enzyme poly(ADP-ribose) polymerase (PARP). PARP then modifies GAPDH, thereby reducing its activity. This decreased GAPDH activity activates the polyol pathway, increases intracellular AGE formation, activates PKC isoforms, increases NFκB p65 transcription and activity, and activates hexosamine pathway flux (13,14,20). The data presented in the current study demonstrate that increased expression of RAGE and of its proinflammatory endogenous ligands are also a consequence of hyperglycemia-induced ROS and thus constitute another element of this unifying mechanism.
RAGE was originally identified by its ability to bind advanced glycation end products. However, there is currently disagreement about the importance of AGE-modified proteins as agonists of RAGE in vivo, because proteins modified by AGEs to the extent necessary to bind RAGE are unlikely to exist in physiological systems in vivo (22–24). In contrast, S100/calgranulin proteins and high mobility group-1 protein are present at sites of inflammation in vivo at concentrations that activate RAGE (9,15). While modification of the corepressor mSin3A by the GLO1 substrate methylglyoxal has been shown to mediate hyperglycemia-induced transcription of angiopoietin-2 (25), the specific methylglyoxal-modified protein(s) responsible for hyperglycemia-induced transcription of RAGE and its ligands S100A8 calgranulin, S100A12 calgranulin, and HMGB1 remain to be determined. Regardless of the specific proteins modified, however, the data presented here suggest that pharmacologic agents capable of reducing methylglyoxal concentration in cells susceptible to diabetic complications (14) may have a beneficial effect on the damaging consequences of nonphysiologic RAGE activation (3).
Acknowledgments
This study was funded by a Center Grant from the Juvenile Diabetes Research Foundation and National Institutes of Health Training Grant 5T32HL007675-20.
No potential conflicts of interest relevant to this article were reported.
Footnotes
The costs of publication of this article were defrayed in part by the payment of page charges. This article must therefore be hereby marked “advertisement” in accordance with 18 U.S.C. Section 1734 solely to indicate this fact.
REFERENCES
- 1.Lin L, Park S, Lakatta EG: RAGE signaling in inflammation and arterial aging. Front Biosci 2009;14:1403–1413 [DOI] [PMC free article] [PubMed] [Google Scholar]
- 2.Bopp C, Bierhaus A, Hofer S, Bouchon A, Nawroth PP, Martin E, Weigand MA: Bench-to-bedside review: the inflammation-perpetuating pattern-recognition receptor RAGE as a therapeutic target in sepsis. Crit Care 2008;12:201. [DOI] [PMC free article] [PubMed] [Google Scholar]
- 3.Yan SF, Ramasamy R, Schmidt AM: The receptor for advanced glycation endproducts (RAGE) and cardiovascular disease. Expert Rev Mol Med 2009;11:e9. [DOI] [PMC free article] [PubMed] [Google Scholar]
- 4.Yan SF, Ramasamy R, Schmidt AM: Receptor for AGE (RAGE) and its ligands: cast into leading roles in diabetes and the inflammatory response. J Mol Med 2009;87:235–247 [DOI] [PMC free article] [PubMed] [Google Scholar]
- 5.Hofmann MA, Drury S, Fu C, Qu W, Taguchi A, Lu Y, Avila C, Kambham N, Bierhaus A, Nawroth P, Neurath MF, Slattery T, Beach D, McClary J, Nagashima M, Morser J, Stern D, Schmidt AM: RAGE mediates a novel proinflammatory axis: a central cell surface receptor for S100/calgranulin polypeptides. Cell 1999;97:889–901 [DOI] [PubMed] [Google Scholar]
- 6.Donato R: RAGE: a single receptor for several ligands and different cellular responses: the case of certain S100 proteins. Curr Mol Med 2007;7:711–724 [DOI] [PubMed] [Google Scholar]
- 7.Kosaki A, Hasegawa T, Kimura T, Iida K, Hitomi J, Matsubara H, Mori Y, Okigaki M, Toyoda N, Masaki H, Inoue-Shibata M, Nishikawa M, Iwasaka T: Increased plasma S100A12 (EN-RAGE) levels in patients with type 2 diabetes. J Clin Endocrinol Metab 2004;89:5423–5428 [DOI] [PubMed] [Google Scholar]
- 8.Yan XX, Lu L, Peng WH, Wang LJ, Zhang Q, Zhang RY, Chen QJ, Shen WF: Increased serum HMGB1 level is associated with coronary artery disease in nondiabetic and type 2 diabetic patients. Atherosclerosis 2009;205:544–548 [DOI] [PubMed] [Google Scholar]
- 9.Foell D, Wittkowski H, Vogl T, Roth J: S100 proteins expressed in phagocytes: a novel group of damage-associated molecular pattern molecules. J Leukoc Biol 2007;81:28–37 [DOI] [PubMed] [Google Scholar]
- 10.Park L, Raman KG, Lee KJ, Lu Y, Ferran LJ, Jr, Chow WS, Stern D, Schmidt AM: Suppression of accelerated diabetic atherosclerosis by the soluble receptor for advanced glycation endproducts. Nat Med 1998;4:1025–1031 [DOI] [PubMed] [Google Scholar]
- 11.Soro-Paavonen A, Watson AM, Li J, Paavonen K, Koitka A, Calkin AC, Barit D, Coughlan MT, Drew BG, Lancaster GI, Thomas M, Forbes JM, Nawroth PP, Bierhaus A, Cooper ME, Jandeleit-Dahm KA: Receptor for advanced glycation end products (RAGE) deficiency attenuates the development of atherosclerosis in diabetes. Diabetes 2008;57:2461–2469 [DOI] [PMC free article] [PubMed] [Google Scholar]
- 12.Harja E, Bu DX, Hudson BI, Chang JS, Shen X, Hallam K, Kalea AZ, Lu Y, Rosario RH, Oruganti S, Nikolla Z, Belov D, Lalla E, Ramasamy R, Yan SF, Schmidt AM: Vascular and inflammatory stresses mediate atherosclerosis via RAGE and its ligands in apoE-/- mice. J Clin Invest 2008;118:183–194 [DOI] [PMC free article] [PubMed] [Google Scholar]
- 13.Brownlee M: Biochemistry and molecular cell biology of diabetic complications. Nature 2001;414:813–820 [DOI] [PubMed] [Google Scholar]
- 14.Brownlee M: The pathobiology of diabetic complications: a unifying mechanism. Diabetes 2005;54:1615–1625 [DOI] [PubMed] [Google Scholar]
- 15.Leclerc E, Fritz G, Vetter SW, Heizmann CW: Binding of S100 proteins to RAGE: an update. Biochim Biophys Acta 2009;1793:993–1007 [DOI] [PubMed] [Google Scholar]
- 16.Oray B, Norton SJ: Glyoxalase I from mouse liver. Methods Enzymol 1982;90:542–546 [DOI] [PubMed] [Google Scholar]
- 17.Scaffidi P, Misteli T, Bianchi ME: Release of chromatin protein HMGB1 by necrotic cells triggers inflammation. Nature 2002;418:191–195 [DOI] [PubMed] [Google Scholar]
- 18.Li J, Schmidt AM: Characterization and functional analysis of the promoter of RAGE, the receptor for advanced glycation end products. J Biol Chem 1997;272:16498–16506 [DOI] [PubMed] [Google Scholar]
- 19.Tanaka N, Yonekura H, Yamagishi S, Fujimori H, Yamamoto Y, Yamamoto H: The receptor for advanced glycation end products is induced by the glycation products themselves and tumor necrosis factor-alpha through nuclear factor-kappa B, and by 17beta-estradiol through Sp-1 in human vascular endothelial cells. J Biol Chem 2000;275:25781–25790 [DOI] [PubMed] [Google Scholar]
- 20.El-Osta A, Brasacchio D, Yao D, Pocai A, Jones PL, Roeder RG, Cooper ME, Brownlee M: Transient high glucose causes persistent epigenetic changes and altered gene expression during subsequent normoglycemia. J Exp Med 2008;205:2409–2417 [DOI] [PMC free article] [PubMed] [Google Scholar]
- 21.Fuellen G, Nacken W, Sorg C, Kerkhoff C: Computational searches for missing orthologs: the case of S100A12 in mice. OMICS 2004;8:334–340 [DOI] [PubMed] [Google Scholar]
- 22.Thornalley PJ: Dietary AGEs and ALEs and risk to human health by their interaction with the receptor for advanced glycation endproducts (RAGE): an introduction. Mol Nutr Food Res 2007;51:1107–1110 [DOI] [PubMed] [Google Scholar]
- 23.Ramasamy R, Yan SF, Schmidt AM: Arguing for the motion: yes, RAGE is a receptor for advanced glycation endproducts. Mol Nutr Food Res 2007;51:1111–1115 [DOI] [PubMed] [Google Scholar]
- 24.Heizmann CW: The mechanism by which dietary AGEs are a risk to human health is via their interaction with RAGE: arguing against the motion. Mol Nutr Food Res 2007;51:1116–1119 [DOI] [PubMed] [Google Scholar]
- 25.Yao D, Taguchi T, Matsumura T, Pestell R, Edelstein D, Giardino I, Suske G, Rabbani N, Thornalley PJ, Sarthy VP, Hammes HP, Brownlee M: High glucose increases angiopoietin-2 transcription in microvascular endothelial cells through methylglyoxal modification of mSin3A. J Biol Chem 2007;282:31038–31045 [DOI] [PubMed] [Google Scholar]


