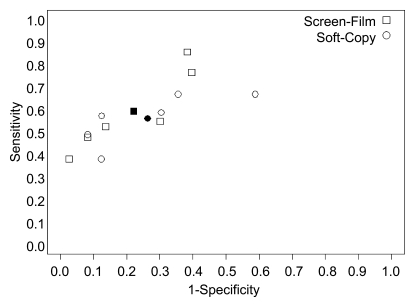
Figure 6a:
Graphs show sensitivity versus 1 − specificity according to reader for (a) Fischer, (b) Fuji, and (c) GE digital reader sets. □ = sensitivity versus 1 − specificity points for each reader with screen-film mammography; ○ = points for each reader with soft-copy digital mammography. ▪ And • = sensitivity versus 1 − specificity points for film and digital mammography, respectively, averaged over all readers (n = 6 for Fischer; n = 12 for Fuji and GE).

