We investigated whether molecular imaging could be used to accurately assess human epidermal growth factor receptor type 2/neu–targeted therapy of human mammary carcinomas with trastuzumab.
Abstract
Purpose:
To use near-infrared (NIR) optical imaging to assess the therapeutic susceptibility and drug dosing of orthotopic human breast cancers implanted in mice treated with molecularly targeted therapy.
Materials and Methods:
This study was approved by the institutional animal care and use committee. Imaging probes were synthesized by conjugating the human epidermal growth factor receptor type 2 (HER2)-specific antibody trastuzumab with fluorescent dyes. In vitro probe binding was assessed with flow cytometry. HER2-normal and HER2-overexpressing human breast cancer cells were orthotopically implanted in nude mice. Intravital laser scanning fluorescence microscopy was used to evaluate the in vivo association of the probe with the tumor cells. Mice bearing 3–5-mm-diameter tumors were intravenously injected with 0.4 nmol of HER2 probe before or after treatment. A total of 123 mice were used for all in vivo tumor growth and imaging experiments. Tumor fluorescence intensity was assessed, and standard fluorescence values were determined. Statistical significance was determined by performing standard analysis of variance across the imaging cohorts.
Results:
HER2 probe enabled differentiation between HER2-normal and HER2-overexpressing human breast cancer cells in vitro and in vivo, with binding levels correlating with tumor trastuzumab susceptibility. Serial imaging before and during trastuzumab therapy revealed a significant reduction (P < .05) in probe binding with treatment and thus provided early evidence of successful HER2 inhibition days before the overall reduction in tumor growth was apparent.
Conclusion:
NIR imaging with HER2-specific imaging probes enables evaluation of the therapeutic susceptibility of human mammary tumors and of drug dosing during HER2-targeted therapy with trastuzumab. This approach, combined with tomographic imaging techniques, has potential in the clinical setting for determining patient eligibility for and adequate drug dosing in molecularly targeted cancer therapies.
© RSNA, 2008
Noninvasive methods of measuring tumor physiologic parameters on the molecular level are being developed (1). Such molecular imaging technology is becoming increasingly important as new cancer therapeutic agents more specifically target tumor cell signaling pathways, with the goal of increasing tumor response while minimizing systemic toxicity (2).
The introduction of these agents into clinical practice is generating new prognostic and diagnostic questions that molecular imaging has the potential to address. Pretherapy imaging, by enabling physicians to determine the tumor expression profile of particular molecules, could be used to identify patients who are likely to benefit from targeted therapies. During the course of treatment, imaging could also facilitate early assessment of therapeutic target inhibition before alterations in tumor size become apparent. This would expedite the dosing process by ensuring that each patient received the optimal dose that inhibits the molecular target while minimizing side effects, and given the tremendous expense associated with these agents, this protocol would also be of substantial financial benefit to patients (3,4). The ability to assess molecular target inhibition independently of tumor response is important for these agents because molecular inhibition is the primary endpoint of therapeutic efficacy, while control of tumor growth is a secondary therapeutic consequence. Such imaging ensures that the lack of tumor response observed during treatment represents true therapy failure (ie, lack of tumor response despite adequate target inhibition) and not inadequate drug delivery.
Among the different technologies being used to image molecular events, near-infrared (NIR) fluorescence optical imaging is particularly promising (4). NIR light (650–900 nm) can penetrate to a depth of up to 5–10 cm in tissue owing to the low photon absorption by water and hemoglobin in this spectral range (5,6); thus, it enables imaging of tumors within tissue such as breast tissue. This technology is readily applicable to human breast tumor evaluation because diffuse optical tomography and spectroscopy with NIR light are currently being evaluated in clinical studies to distinguish benign from malignant breast lesions and follow tumor response to chemotherapy (7–9).
We chose to investigate human epidermal growth factor receptor type 2 (HER2)/neu-targeted therapy with the monoclonal antibody trastuzumab (Herceptin; Genentech, San Francisco, Calif) in human breast cancer. HER2/neu is a tyrosine kinase receptor that is overexpressed in 20%–25% of invasive human breast cancers, and tumor cell levels of HER2/neu expression are associated with increased biological aggressiveness and a worse clinical prognosis (10,11). Trastuzumab is a humanized monoclonal antibody targeting the HER2/neu extracellular domain and has been approved for treatment of patients with HER2/neu-overexpressing breast cancers (12). The purpose of our study was to use NIR fluorescence optical imaging to assess the therapeutic susceptibility and drug dosing of orthotopic human breast cancers implanted in mice treated with molecularly targeted therapy.
MATERIALS AND METHODS
This study was performed according to a protocol approved by the institutional animal care and use committee and was compliant with National Institutes of Health guidelines for the care of laboratory animals.
Optical Probe Generation
An optical imaging probe for detecting HER2 was generated (F.R., L.J.) by means of covalent modification of the humanized anti-HER2/neu antibody trastuzumab with the NIR dye cyanine 5.5 (Cy5.5; Invitrogen, Carlsbad, Calif), followed by purification over a Sephadex G50 column (Amersham, Piscataway, NJ). Dye concentration was measured spectrophotometrically, whereas total probe concentration was determined by using the bicinchoninic acid method (Bio-Rad, Hercules, Calif). Multiple probes were synthesized with molar ratios of fluorochrome to antibody ranging from 0.5:1 to 2.0:1 and were tested for affinity for binding to HER2/neu-overexpressing SKBR-3 tumor cells. For serial imaging of HER2 inhibition, a second optical probe was generated by combining trastuzumab with AF750 (Invitrogen), an NIR dye with an excitation and emission spectrum distinct from cyanine 5.5, to ensure that any residual fluorescence from the cyanine 5.5 probe administered before treatment would not contribute to the fluorescent signal at posttreatment imaging. Compared with the cyanine 5.5-labeled probe, the AF750-conjugated HER2 probe demonstrated comparable affinity for binding to HER2/neu receptor (10 nmol/L) and comparable in vivo half-life in blood (36 hours).
Determination of Probe Binding to HER2/neu
Probe binding to HER2/neu was assessed (M.S.G., R.U., and H.B.) by using a modified version of a previously established flow cytometric binding assay (13). Briefly, 106 SKBR-3 cells were incubated in suspension with various concentrations of cyanine 5.5– or AF750-conjugated trastuzumab for 15 minutes at 37°C in a total volume of 150 μL and then washed twice in Hanks balanced salt solution. Fluorescence intensity was assessed with flow cytometry (FacsCalibur; Becton Dickinson, Franklin Lakes, NJ). For competitive inhibition of probe binding, 5 nmol/L labeled probe, along with different concentrations (0–500 nmol/L) of unlabeled trastuzumab, was added to the SKBR-3 cells by using the same incubation and washing conditions; flow cytometric analysis was then performed. As a control for nonspecific competition, purified whole human immunoglobulin G (Jackson Immunoresearch, West Grove, Pa) was also tested at equivalent molar concentrations. Fluorescence microscopy (with an Olympus microscope; Olympus, Center Valley, Pa) of probe-stained tumor cells was also performed for visual confirmation of membrane localization. All experiments were carried out in triplicate, and the mean values calculated for the three experiments were plotted to form a saturation binding curve. The dissociation constant (KD) was determined from the saturation binding plot by using computer software (GraphPad Prism; GraphPad Software, San Diego, Calif).
Cell Lines and Mice
We used human cancer cells with varying levels of HER2 expression, including the 9L glioma line, which does not express HER2/neu; the MCF-7 breast cancer line, which expresses normal mammary HER2/neu levels (single copy of the HER2/neu locus); and the BT-474 and SKBR-3 breast cancer lines, which overexpress HER2/neu (four- to eightfold gene amplification) (12,14,15). The 9L human glioma cell line was maintained in Dulbecco's modified Eagle's medium–F12 medium supplemented with 10% fetal bovine serum and penicillin-streptomycin (ie, complete Dulbecco's modified Eagle's medium–F12 medium). The BT-474 human mammary carcinoma cell line was maintained in complete Dulbecco's modified Eagle's medium–F12 medium supplemented with human insulin (3.6 × 10⁻³ mg/mL). The MCF-7 and SKBR-3 human mammary carcinoma cell lines were maintained in complete McCoy medium. For intravital laser scanning microscopy with dorsal window chambers, the tumor cell lines were stably transfected (R.U., H.B.) with an expression vector encoding green fluorescent protein (pAcGFP-N1; Clontech, Mountain View, Calif) by using a transfection reagent (SuperFect; Qiagen, Valencia, Calif) according to the manufacturer's protocol. Female C57BL/6 nude mice were purchased from Jackson Laboratories (Bar Harbor, Me). The mice were housed and maintained under aseptic conditions according to guidelines set by the institutional animal care and use committee. A total of 123 mice were used for all animal experiments.
Determination of HER2 Probe in Vivo Plasma Half-life
The imaging dose (0.4 nmol) of AF750-conjugated probe was intravenously administered to the mice. Plasma samples were obtained from the mice (H.B., R.U.) at multiple time points (6, 24, 48, 72, and 96 hours) after probe administration. Whole blood samples were centrifuged in capillary tubes. Plasma was subsequently analyzed with an NIR fluorimeter at 694 nm to measure cyanine 5.5 fluorescence or at 779 nm to measure AF750 fluorescence. A total of eight mice were used for these plasma half-life measurements.
Multichannel Intravital Laser Scanning Fluorescence Microscopy
Tumor cells were implanted in dorsal skin fold window chambers by a surgeon (M.M.) according to a previously described protocol (16). A custom-made aluminum saddle was used to bracket each chamber. For each chamber, (2.5–5.0) × 106 tumor cells were implanted in a total volume of 20 μL of buffered saline. One chamber was implanted in each mouse. Seven to 10 days after implantation, intravital laser scanning fluorescence microscopy was performed (H.B., R.U.) by using a miniaturized four-laser scanning microscopy system optimized for visible and NIR imaging, as previously described (17). Excitation laser and band-pass filter settings were optimized for green fluorescent protein (excitation at 488 nm, emission at 509 nm), cyanine 5.5 (excitation at 675 nm, emission at 694 nm), and AF750 (excitation at 752 nm, emission at 779 nm) excitation and emission. HER2 probe was administered intravenously and imaged according to the protocol described earlier for imaging orthotopic tumors. All image stacks were acquired by using identical laser power, window, and level settings. All images were recorded and stored as proprietary multilayer 16-bit tagged image file format files. Five window chambers were imaged per tumor type (BT-474, SKBR-3, MCF-7, and 9L) by using one chamber per mouse (n = 20).
In Vivo Tumor Experiments
For tumor implantation, tumor cells in culture were detached by using a protease-free phosphate-buffered saline– edetic acid solution (Versene; Invitrogen). The tumor cells were mixed with 100 μL of a gelatinous protein mixture secreted by mouse tumor cells (Matrigel; Becton Dickinson) and then implanted orthotopically into the mammary glands of female C57BL/6 nude mice (Jackson Laboratories) by a surgeon (M.M.). Totals of 10 × 106 BT-474, SKBR-3, and MCF-7 cells and 106 9L cells were implanted in each tumor. For the mice bearing BT-474 or MCF-7 tumors, a 0.72-mg (60-day release) 17β-estradiol pellet (Innovative Research, Sarasota, Fla) was implanted subcutaneously at the time of tumor cell inoculation (18). The tumors were measured bidirectionally (M.S.G.) twice per week by using calipers, and tumor size was calculated by approximating the volume of a spheroid (0.52 · W2 · L), where W2 is the square width and L is the length. Five untreated and five trastuzumab-treated tumors were measured in each tumor group (forty mice total). Trastuzumab therapy consisted of intraperitoneal administration of 100 mg of trastuzumab per kilogram of body weight diluted in sterile saline (2 mg [15 nmol] per dose) every 7 days, starting when the tumors reached 50–100 mm3. The mice with untreated tumors received intraperitoneal injections of saline solution according to the same schedule. Ten additional mice bearing BT-474 tumors were also treated with an intermediate dose of trastuzumab (5 mg/kg). The treated tumors were followed up for 14 days after the initiation of trastuzumab therapy.
Whole-Animal NIR Fluorescence Imaging
HER2 imaging was performed 0, 6, 24, and 48 hours (R.U. and H.B.) after the intravenous administration of 0.4 nmol of HER2 probe (five mice per tumor type, 20 mice total). Peak probe uptake in the HER2-overexpressing tumors occurred 48 hours after injection, and this time point was used for all subsequent experiments. Whole-animal epifluorescence imaging was performed as described previously (19) by using a multichannel whole-animal optical imaging system (BonSAI; Siemens Medical Solutions, Malvern, Pa) optimized for cyanine 5.5 and AF750 excitation and emission wavelengths. Imaging times were 0.3 second for all cyanine 5.5 imaging examinations and 1.1 seconds for all AF750 imaging examinations. Quantitative measurements (R.U., H.B.) on the acquired epifluorescent images were performed by using a circular, roughly 2000-pixel region of interest placed over each xenograft (approximately 0.25 mm2 covering most of the tumor) and were reported by using image analysis software (Syngo; Siemens Medical Solutions). For serial probe imaging before and after trastuzumab treatment, the cyanine 5.5–conjugated probe was used for pretreatment imaging while the AF750-conjugated probe was injected 16 hours after trastuzumab injection and was used for posttreatment imaging (five mice per tumor type, 20 mice total). Standardized fluorescence values were calculated by dividing the fluorescence within the tumor region of interest by the fluorescence within an identical-size region of interest placed on the skin of one of the hind legs. Five additional mice were used to image BT-474 tumors that were treated with an intermediate (5 mg/kg) trastuzumab dose.
Statistical Analysis
Data are presented as means ± standard errors of the mean. Statistical significance was assessed (R.U.) by using standard repeated-measures analysis of variance to compare mean fluorescence values of HER2 probe binding in vivo. The Student t test was used to compare the mean fluorescence intensities of HER2 probe binding to cell lines with flow cytometry in vitro. A statistical software package (Octave Software, Madison, Wis) was used for data analysis. P < .05 was considered to indicate a significant difference.
RESULTS
Probe Binding to HER2/neu
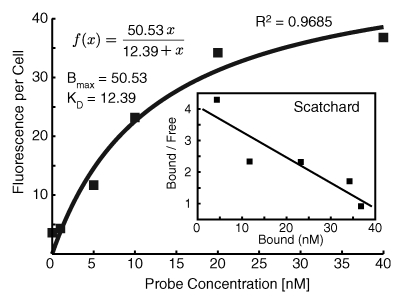
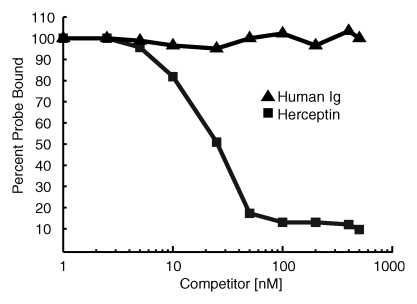
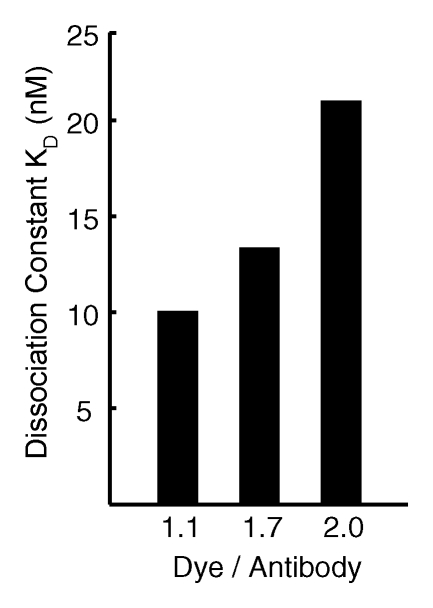
The HER2 probe demonstrated high-affinity saturable HER2/neu binding, with a KD of 12.4 nmol/L (Fig 1a). At competition receptor-binding assay, nonlabeled trastuzumab competed specifically with the HER2 probe for binding to the SKBR-3 cells, while nonspecific human immunoglobulin G did not (Fig 1b). An initial molecular ratio of fluorochrome to antibody of 1.1 was chosen on the basis of findings in prior studies of other fluorescently labeled proteins (20). We synthesized other variations of the probe with increased fluorochrome-to-antibody ratios; however, these probes were not used owing to decreased binding affinity (Fig 1c). A probe containing a lower dye-to-antibody ratio (0.5) was also rejected, because although it maintained high binding affinity, it had reduced fluorescence intensity (data not shown).
Figure 1a:
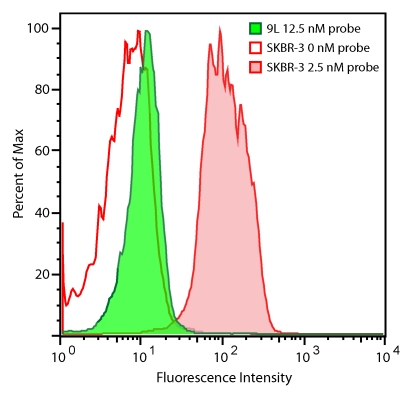
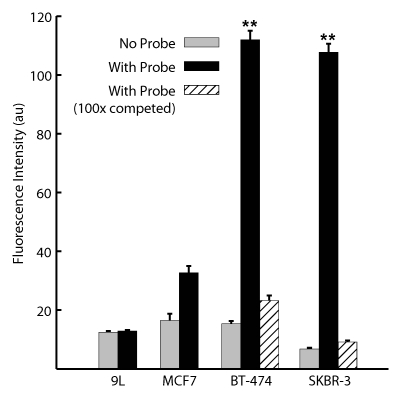
Graph characterizations of NIR fluorescence HER2 imaging probe. (a) Saturation probe receptor assay for cyanine 5.5–trastuzumab binding to HER2/neu-overexpressing SKBR-3 cells. Inset illustrates Scatchard analysis of probe binding. Bmax = maximal bound probe concentration (in nanomolars), f(x) = linear relationship of the Scatchard plot. (b) Competitive inhibition of cyanine 5.5–trastuzumab binding with increasing molar concentrations of nonlabeled trastuzumab (Herceptin) or nonspecific human immunoglobulin G (Ig). (c) Probe-binding affinity as a function of fluorescent dye–to-protein ratio. (d) Representative flow cytometry histograms of cultured SKBR-3 cells without (open red-outlined spectrum) and with (filled red-outlined spectrum) addition of 2.5 nmol/L cyanine 5.5–conjugated HER2 probe. To demonstrate probe specificity, the histogram of 9L cells (green) treated with a fivefold higher (12.5 nmol/L) probe concentration is also shown. Max = maximum. (e) Flow cytometry summary of HER2 probe binding. Mean fluorescence intensity, with standard error of mean, for tumor cells without and with 100 ng of HER2 probe are shown. For competitive inhibition experiments, a 100-fold molar excess of unlabeled trastuzumab was added to the cells simultaneously with the probe. au = arbitrary units, ** = significant difference (P < .01).
Figure 1b:
Graph characterizations of NIR fluorescence HER2 imaging probe. (a) Saturation probe receptor assay for cyanine 5.5–trastuzumab binding to HER2/neu-overexpressing SKBR-3 cells. Inset illustrates Scatchard analysis of probe binding. Bmax = maximal bound probe concentration (in nanomolars), f(x) = linear relationship of the Scatchard plot. (b) Competitive inhibition of cyanine 5.5–trastuzumab binding with increasing molar concentrations of nonlabeled trastuzumab (Herceptin) or nonspecific human immunoglobulin G (Ig). (c) Probe-binding affinity as a function of fluorescent dye–to-protein ratio. (d) Representative flow cytometry histograms of cultured SKBR-3 cells without (open red-outlined spectrum) and with (filled red-outlined spectrum) addition of 2.5 nmol/L cyanine 5.5–conjugated HER2 probe. To demonstrate probe specificity, the histogram of 9L cells (green) treated with a fivefold higher (12.5 nmol/L) probe concentration is also shown. Max = maximum. (e) Flow cytometry summary of HER2 probe binding. Mean fluorescence intensity, with standard error of mean, for tumor cells without and with 100 ng of HER2 probe are shown. For competitive inhibition experiments, a 100-fold molar excess of unlabeled trastuzumab was added to the cells simultaneously with the probe. au = arbitrary units, ** = significant difference (P < .01).
Figure 1c:
Graph characterizations of NIR fluorescence HER2 imaging probe. (a) Saturation probe receptor assay for cyanine 5.5–trastuzumab binding to HER2/neu-overexpressing SKBR-3 cells. Inset illustrates Scatchard analysis of probe binding. Bmax = maximal bound probe concentration (in nanomolars), f(x) = linear relationship of the Scatchard plot. (b) Competitive inhibition of cyanine 5.5–trastuzumab binding with increasing molar concentrations of nonlabeled trastuzumab (Herceptin) or nonspecific human immunoglobulin G (Ig). (c) Probe-binding affinity as a function of fluorescent dye–to-protein ratio. (d) Representative flow cytometry histograms of cultured SKBR-3 cells without (open red-outlined spectrum) and with (filled red-outlined spectrum) addition of 2.5 nmol/L cyanine 5.5–conjugated HER2 probe. To demonstrate probe specificity, the histogram of 9L cells (green) treated with a fivefold higher (12.5 nmol/L) probe concentration is also shown. Max = maximum. (e) Flow cytometry summary of HER2 probe binding. Mean fluorescence intensity, with standard error of mean, for tumor cells without and with 100 ng of HER2 probe are shown. For competitive inhibition experiments, a 100-fold molar excess of unlabeled trastuzumab was added to the cells simultaneously with the probe. au = arbitrary units, ** = significant difference (P < .01).
The HER2 probe demonstrated a greater than 10-fold increase in binding to BT-474 and SKBR-3 cells compared with its binding to 9L cells, as measured according to fluorescence intensity (P < .005, Student t test) (Fig 1d, 1e), with binding reaching a plateau at probe concentrations greater than 20 nmol/L. Probe binding to the SKBR-3 and BT-474 cells was 3.3 and 3.4 times higher, respectively, than that to the HER2/neu-normal MCF-7 cells, consistent with the four- to eightfold gene amplification exhibited by these cells. Probe binding was competitively inhibited by the addition of a 100-fold molar excess of unlabeled trastuzumab (Fig 1e). Fluorescence microscopy findings confirmed the increased probe binding to HER2/neu-overexpressing cell lines and demonstrated probe localization to the cell membrane (data not shown).
Figure 1d:
Graph characterizations of NIR fluorescence HER2 imaging probe. (a) Saturation probe receptor assay for cyanine 5.5–trastuzumab binding to HER2/neu-overexpressing SKBR-3 cells. Inset illustrates Scatchard analysis of probe binding. Bmax = maximal bound probe concentration (in nanomolars), f(x) = linear relationship of the Scatchard plot. (b) Competitive inhibition of cyanine 5.5–trastuzumab binding with increasing molar concentrations of nonlabeled trastuzumab (Herceptin) or nonspecific human immunoglobulin G (Ig). (c) Probe-binding affinity as a function of fluorescent dye–to-protein ratio. (d) Representative flow cytometry histograms of cultured SKBR-3 cells without (open red-outlined spectrum) and with (filled red-outlined spectrum) addition of 2.5 nmol/L cyanine 5.5–conjugated HER2 probe. To demonstrate probe specificity, the histogram of 9L cells (green) treated with a fivefold higher (12.5 nmol/L) probe concentration is also shown. Max = maximum. (e) Flow cytometry summary of HER2 probe binding. Mean fluorescence intensity, with standard error of mean, for tumor cells without and with 100 ng of HER2 probe are shown. For competitive inhibition experiments, a 100-fold molar excess of unlabeled trastuzumab was added to the cells simultaneously with the probe. au = arbitrary units, ** = significant difference (P < .01).
Figure 1e:
Graph characterizations of NIR fluorescence HER2 imaging probe. (a) Saturation probe receptor assay for cyanine 5.5–trastuzumab binding to HER2/neu-overexpressing SKBR-3 cells. Inset illustrates Scatchard analysis of probe binding. Bmax = maximal bound probe concentration (in nanomolars), f(x) = linear relationship of the Scatchard plot. (b) Competitive inhibition of cyanine 5.5–trastuzumab binding with increasing molar concentrations of nonlabeled trastuzumab (Herceptin) or nonspecific human immunoglobulin G (Ig). (c) Probe-binding affinity as a function of fluorescent dye–to-protein ratio. (d) Representative flow cytometry histograms of cultured SKBR-3 cells without (open red-outlined spectrum) and with (filled red-outlined spectrum) addition of 2.5 nmol/L cyanine 5.5–conjugated HER2 probe. To demonstrate probe specificity, the histogram of 9L cells (green) treated with a fivefold higher (12.5 nmol/L) probe concentration is also shown. Max = maximum. (e) Flow cytometry summary of HER2 probe binding. Mean fluorescence intensity, with standard error of mean, for tumor cells without and with 100 ng of HER2 probe are shown. For competitive inhibition experiments, a 100-fold molar excess of unlabeled trastuzumab was added to the cells simultaneously with the probe. au = arbitrary units, ** = significant difference (P < .01).
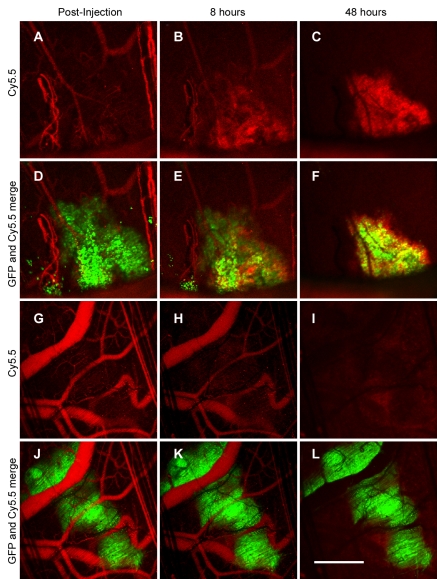
The probe intravenously administered in microscopic tumors implanted into the dorsal window chambers initially was confined to the blood pool (Fig 2, D, J). In the HER2-overexpressing tumors, serial imaging revealed a gradual loss of probe signal in the circulation accompanied by progressive probe accumulation around the tumor cells. By 48 hours, detectable probe was localized exclusively around the tumor cells (Fig 2, C, F). In contrast, the probe injected into the mice with 9L tumors left the circulation without marked tumor cell localization or accumulation (Fig 2, I, L). Serial quantitation of plasma fluorochrome levels after probe administration in the normal mice demonstrated an in vivo plasma half-life of 37 hours.
Figure 2:
Intravital laser scanning fluorescence imaging of microscopic tumors after probe administration. Serial images of A–F, BT-474 tumors, and, G–L, 9L tumors obtained 0, 8, and 48 hours after intravenous HER2 probe (red) administration are shown. Overlaid images of both tumor cells and probe (D–F, J–L) are included to demonstrate specificity of probe localization. Tumor cells are shown in green. GFP = green fluorescent protein. Scale bar equals 1 mm.
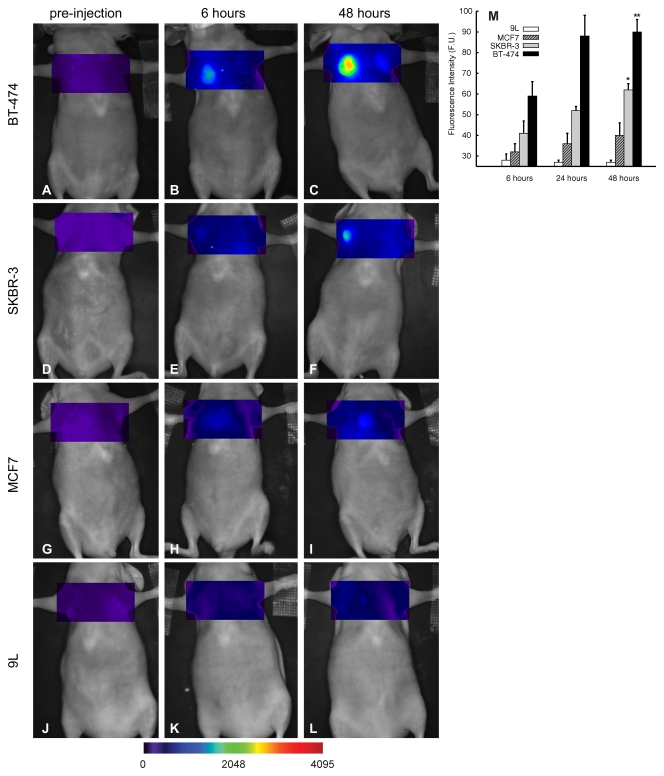
Serial tumor imaging in vivo (Fig 3) revealed progressive HER2 probe accumulation in the BT-474 and SKBR-3 tumors, which was maximal at 48 hours after probe injection (Fig 3, C, F). The MCF-7 tumors exhibited an intermediate level of probe binding, which was significantly lower (P < .05) than the binding exhibited by the HER-2/neu-overexpressing tumors (40% and 57% lower than binding of SKBR-3 and BT-474 tumors, respectively, at 48 hours [Fig 3, M]). The 9L tumors did not demonstrate probe accumulation at any time point tested. Thus, as in the in vitro experiments, HER2 probe binding to tumors in vivo was dependent on the level of tumor cell HER2/neu expression, with mean values of probe binding to BT-474 (90 fluorescence units) and SKBR-3 (62 fluorescence units) tumors at 48 hours being significantly (P < .05, repeated-measures analysis of variance) higher than mean values for binding to MCF-7 tumors (39 fluorescence units).
Figure 3:
A–L, Time course of HER2 tumor imaging in vivo: Mice bearing BT-474 (A–C), SKBR-3 (D–F), MCF-7 (G–I), or 9L (J–L) tumors were serially imaged after administration of HER2 probe at various time points. M, Graph shows mean tumor standard fluorescence values measured 6, 24, and 48 hours after HER2 probe administration. Error bars indicate standard error of the mean A (five tumors for each group). Significance of differences is shown: * = P < .05, ** = P < .005. F.U. = fluorescence units.
Trastuzumab Treatment
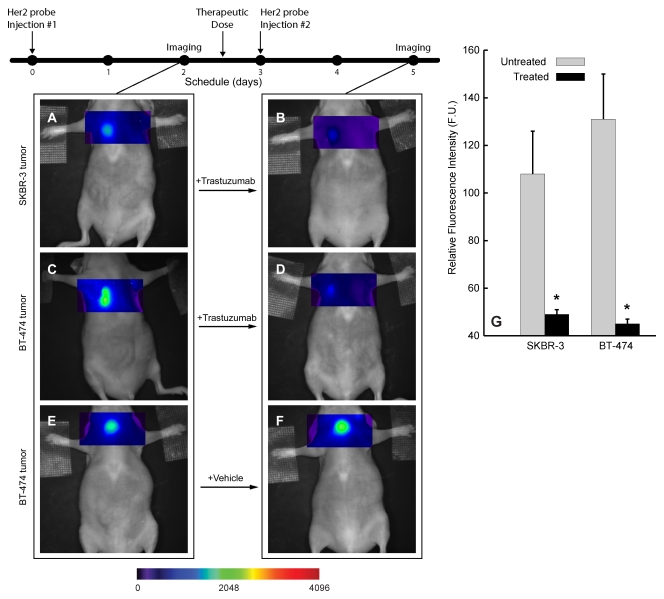
Serial imaging after probe administration both before and 18 hours after the initial trastuzumab dose enabled rapid interval assessment of the initial receptor level and adequate inhibition after therapy initiation (Fig 4). Comparison of pre- and posttreatment imaging findings revealed that trastuzumab treatment reduced the fluorescent signal from the HER2 probe binding by 55% in the SKBR-3 tumors and by 65% in the BT-474 tumors (P < .05) (Fig 4, A–D, G). Treatment with saline solution alone did not alter probe binding (Fig 4, E, F). There were no significant changes in tumor sizes within the first 24 hours after trastuzumab treatment (mean tumor volumes: 48 mm3 ± 10 before vs 45 mm3 ± 9 at 24 hours after treatment for SKBR-3, 50 mm3 ± 12 before vs 49 mm3 ± 10 at 24 hours after treatment for BT-474; P > .6 for both tumor types).
Figure 4:
Fluorescence imaging of tumor target inhibition during trastuzumab therapy. A–F, Serial images of representative HER2-overexpressing BT-474 and SKBR-3 tumors before (A and C) and 18 hours after (B and D) trastuzumab treatment with cyanine 5.5– and AF750-conjugated HER2 probes according to the schedule outlined in the timeline (top left), E, F, Images of vehicle (saline solution)-treated BT-474 tumor are shown for comparison. G, Graph summarizes standard fluorescence values for SKBR-3 and BT-474 tumors measured before and after trastuzumab treatment. Error bars indicate standard errors of mean. F. U. = fluorescence units, * = significant difference (P < .05).
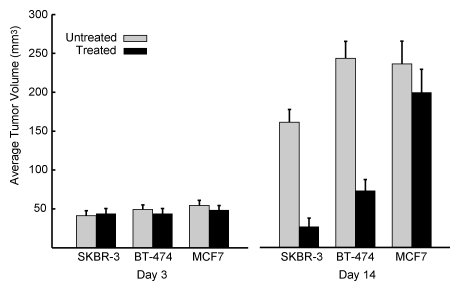
Trastuzumab treatment did not significantly affect the growth of HER2-normal MCF-7 tumors, with mean tumor volume from the trastuzumab-treated group (209 mm3 ± 32) similar to that of the saline solution–treated (control) group (240 mm3 ± 30, P > .05) after 14 days of treatment. In contrast, trastuzumab treatment of the HER2-overexpressing BT-474 and SKBR-3 tumors (Fig 5) led to a significant reduction in tumor growth, with mean posttreatment tumor volumes, respectively, 70% (245 mm3 ± 20 before vs 68 mm3 ± 15 after treatment, P < .001) and 87% (170 mm3 ± 18 before vs 33 mm3 ± 11 after treatment, P < .001) lower than those for the saline solution–treated tumors after 14 days of therapy.
Figure 5:
Graph illustrates effects of trastuzumab treatment on tumor size. Mean (ie, average) volumes for established trastuzumab-treated and control BT-474, SKBR-3, and MCF-7 tumors at days 3 and 14 of therapy are shown. All in vivo imaging examinations were performed on day 2 of therapy. Error bars indicate standard errors of mean.
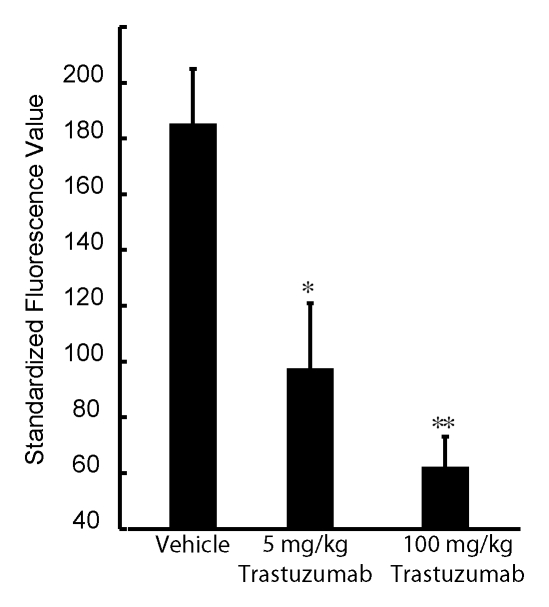
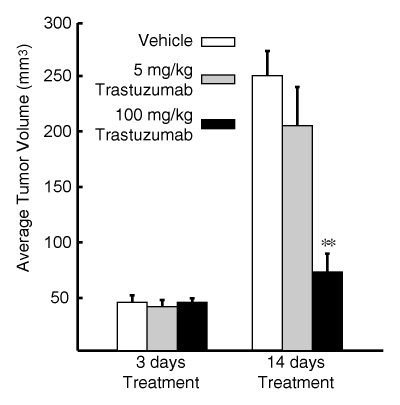
The BT-474 tumors treated with an intermediate dose (5 mg/kg) of trastuzumab, as compared with the untreated tumors, demonstrated significant (P < .05) partial blocking of the fluorescent HER2 probe (Fig 6a). The relative fluorescence intensities of these tumors were lower than those of the untreated tumor cohort but greater than those of the tumor cohort that received the full trastuzumab dose. In addition, the mean tumor volume of mice that received the intermediate drug dose (Fig 6b) was between that of the untreated and full-dose treatment groups, consistent with subtherapeutic effect.
Figure 6a:
Graphs illustrate imaging dose escalations with trastuzumab treatment. (a) Summary of standard fluorescence values for three groups of BT-474 tumors, which were injected with an empty (saline solution) vehicle, an intermediate dose of trastuzumab, or a full dose of trastuzumab. Fluorescent signal from the AF750-conjugated HER2 probe was either partially or almost completely blocked by the two trastuzumab doses compared with the signal from the probe in the untreated (control) tumor group. (b) Mean (ie, average) volumes for tumors administered the (saline solution) vehicle, an intermediate dose of trastuzumab, or the full dose of trastuzumab at days 3 and 14 of therapy are shown. All in vivo imaging examinations were performed on day 2 of therapy. Error bars indicate standard errors of mean (five or more tumors in each group). Significance of differences is illustrated: * = P < .05, ** = P < .005.
Figure 6b:
Graphs illustrate imaging dose escalations with trastuzumab treatment. (a) Summary of standard fluorescence values for three groups of BT-474 tumors, which were injected with an empty (saline solution) vehicle, an intermediate dose of trastuzumab, or a full dose of trastuzumab. Fluorescent signal from the AF750-conjugated HER2 probe was either partially or almost completely blocked by the two trastuzumab doses compared with the signal from the probe in the untreated (control) tumor group. (b) Mean (ie, average) volumes for tumors administered the (saline solution) vehicle, an intermediate dose of trastuzumab, or the full dose of trastuzumab at days 3 and 14 of therapy are shown. All in vivo imaging examinations were performed on day 2 of therapy. Error bars indicate standard errors of mean (five or more tumors in each group). Significance of differences is illustrated: * = P < .05, ** = P < .005.
DISCUSSION
Imaging has the potential to noninvasively provide insight about the physiologic features of tumors, which can aid in initial tumor characterization and determination of therapy response. Our study results demonstrate the ability of NIR fluorescence optical imaging to enable reproducible noninvasive assessment of tumor treatment susceptibility and drug target inhibition. The ability to assess the adequacy of drug target inhibition is particularly important in the examination of patients undergoing molecularly targeted cancer therapy, in which the primary endpoint of efficacy is tumor cell molecular inhibition, with control of tumor growth being the secondary endpoint. In cases in which tumor size does not decrease, it is important to know whether the lack of response is due to therapeutic resistance or inadequate drug delivery. In addition, assessment of the kinetics and degree of molecular target inhibition would enable optimal therapy dosing in individual patients for a maximized therapeutic effect while minimizing drug toxicity. Heretofore, treatment effectiveness has been determined according to the decrease in overall tumor size or changes in the architecture or cell morphology of the tumor at histologic analysis of excised tumor tissue (21). The imaging methods used in our study provide multiple advantages, including the ability to promptly demonstrate therapeutic efficacy (or the lack thereof) and the opportunity for serial determination of target dose levels in patients receiving increasing drug doses.
We investigated whether molecular imaging could be used to accurately assess HER2/neu-targeted therapy of human mammary carcinomas with trastuzumab. This was the ideal therapy model to study because of the widespread clinical use of trastuzumab in the treatment of patients with HER2/neu-overexpressing breast cancers. An additional advantage was the availability of human breast cancer cell lines with known levels of HER2 expression that correlated with trastuzumab susceptibility. In fact, all three cell lines used in our study have been used as controls to standardize the immunohistochemical (IHC) assay for HER2 expression in excised biopsy tissue. The MCF-7 cell line, which exhibits normal mammary HER2/neu levels (single copy of the HER2/neu locus), corresponds to IHC grade 0, which indicates no overexpression (22). BT-474 and SKBR-3 cells, both of which exhibit four- to eightfold HER2/neu gene amplification, correspond to grade 3+ IHC overexpression (22,23).
The imaging probe used in our study was specific for the HER2/neu receptor and consisted of trastuzumab conjugated with an NIR fluorochrome (either cyanine 5.5 or AF750). Imaging agents derived from antibodies directed against HER2 have demonstrated binding to HER2/neu-overexpressing tumors in preclinical models (24,25). In our study, comparative probe-binding experiments involving the use of breast cancer cell lines with varying degrees of HER2/neu expression revealed that the described NIR fluorescent HER2 probe can be used to discriminate between HER2-normal and HER2-overexpressing tumors both in vitro and in vivo. The distinction between HER2-normal and HER2-overexpressing mammary carcinomas is clinically important both as an independent marker of biological aggressiveness and as the primary determinant of trastuzumab susceptibility. More recently, HER2 overexpression has also been shown to indicate susceptibility to anthracycline-based adjuvant chemotherapy regimens (26).
It is interesting that although the BT-474 and SKBR-3 cell lines demonstrate comparable HER2 probe binding in vitro, BT-474 tumors exhibit greater probe binding than do SKBR-3 tumors in vivo, despite comparable tumor size. The explanation for this is unclear, but it may be related to tumor-specific differences in the physiologic parameters that affect probe delivery, such as vascular density, permeability, and interstitial pressure. Another factor in the different binding capacities of these tumors may be the differences in tumor cell size. BT-474 cells are smaller than SKBR-3 cells, and for a tumor of a given size, there are a higher number of BT-474 cells, and, thus, there is a higher surface area–to-volume ratio. Regardless of these factors, the difference in probe binding between these HER2/neu-overexpressing tumors is minor compared with the difference between the probe binding of these two tumor lines and that of the HER2-normal MCF-7 tumors, the former being significantly higher (P < .05).
Serial imaging of HER2-overexpressing tumors before and after trastuzumab treatment revealed significantly reduced (P < .05) tumor HER2 probe binding 18 hours after the initiation of therapy, showing that this probe can be used as an early indicator of successful therapeutic HER2 inhibition. Decreased probe uptake was reproducibly observed in the SKBR-3 and BT-474 tumors days before differences in the overall tumor size were apparent. The benefit gained from early imaging of HER2 inhibition is likely to be even greater in patients because tumors arising in humans tend to have a slower baseline growth rate and no control tumors are available for growth rate comparisons.
The described HER2 imaging method was shown to be dose sensitive: The BT-474 tumors treated with an intermediate subtherapeutic dose of trastuzumab (5 mg/kg intraperitoneally) demonstrated a lower degree of HER2 probe binding compared with the untreated tumor cohort but a greater degree of probe binding compared with the cohort that received the therapeutic dose. This intermediate level of probe binding helped to predict subsequent partial tumor response to treatment, as characterized by partial inhibition of tumor growth. The ability to assess the kinetics and degree of molecular target inhibition has the potential to lead to optimized cancer therapy dosing and scheduling on an individual patient basis for a maximized therapeutic effect while minimizing drug toxicity. Our study results demonstrate that NIR fluorescence imaging of the degree of HER2 inhibition can provide an early temporal window in which to modify trastuzumab dosing before changes in tumor growth become apparent.
One issue related to NIR fluorescence imaging was the quantitation and comparison of fluorescence intensities. To that end, we devised a method of calculating the standard fluorescence values for each tumor, with which the fluorescence intensity in the tumor region of interest was normalized to dermal fluorescence at a site away from the tumor. This method enabled us to compare probe uptake among the different tumors. Alternatively, quantitative NIR fluorescence tomographic methods may be used to make such assessments.
Potential limitations of our study included the relatively long plasma half-life of the HER2 probe that resulted from our use of the intact trastuzumab antibody for imaging probe synthesis. We included the entire antibody to maximize HER2/neu binding affinity, which for our probe (KD = 12.4 nmol/L) was considerably higher than that of the indium 111–labeled trastuzumab Fab fragments used for nuclear imaging (27). The strong binding affinity of our probe was largely responsible for our ability to distinguish between HER2-normal and HER2-overexpressing tumors. The circulating plasma half-life of the probe (37 hours) was comparable to that of the native trastuzumab antibody (28). Serial HER2 imaging before and after trastuzumab therapy was possible owing to the use of two HER2 probes with similar HER2/neu binding activity but distinct fluorescent spectra. Because the dose of probe administered was so low (0.4 nmoL per 20 g per mouse), administration of the first probe was presumed not to have affected the second probe's binding (similar to tracer concentrations used in nuclear imaging techniques). Future study investigators may explore the use of NIR fluorescence imaging probes synthesized from antibody fragments, which exhibit more rapid clearance and may enable serial administration of a single wavelength probe (29,30). However, the potential disadvantage of using such smaller probes is reduced tumor binding owing to multiple mechanisms, including rapid clearance, renal trapping, and fluorophore steric interference of target binding.
An additional limitation of NIR optical tomographic imaging in general is that it is not yet approved for routine clinical use. However, recent clinical studies have revealed the ability to distinguish benign from malignant breast lesions in humans with use of NIR optical spectroscopy, both alone and in combination with magnetic resonance imaging (8,9). It is hoped that the lack of ionizing radiation and the ability to assess multiple physiologic parameters simultaneously will lead to more widespread clinical application of NIR imaging.
Practical applications of the NIR imaging protocol assessed in our study include the potential translation of these concepts to the clinic, including noninvasive in situ characterization of breast tumors, individualized trastuzumab dosing in patients with breast cancer, and imaging of primary therapeutic efficacy before changes in tumor growth are apparent. Furthermore, this approach is generalizable to other monoclonal antibody cancer therapies. It is hoped that the use of a small tracer dose of labeled antibody to assess the adequacy of therapeutic dosing of the same antibody to block the target receptor may be of clinical benefit to patients with cancer in the future.
Advances in Knowledge.
A synthesized near-infrared (NIR) fluorescence imaging probe specific for human epidermal growth factor receptor type 2 (HER2)/neu was used to distinguish HER2-normal from HER2-overexpressing human breast tumors in vitro and in vivo. Probe-binding levels were associated with susceptibility to molecular therapy with the HER2/neu-targeted monoclonal antibody trastuzumab.
Serial imaging of HER2-overexpressing human breast tumors before and after therapeutic administration of trastuzumab revealed a significant decrease (P < .05) in HER2 probe binding after treatment, reflecting therapeutic HER2 inhibition. HER2 imaging performed within the first 48 hours after therapy initiation can be used to predict subsequent tumor response to treatment.
Received August 22, 2007; revision requested October 10; revision received November 16; accepted December 28; final version accepted March 3, 2008.
Funding: This work was supported by the National Institutes of Health (grants R01-EB001872, R01-EB004472, R24-CA92782, P50-CA86355).
Authors stated no financial relationship to disclose.
Supported by Susan G. Komen for the Cure and by NIH grants R01-EB001872, R01-EB004472, R24-CA92782, and P50-CA86355.
Abbreviations:
- HER2
- human epidermal growth factor receptor type 2
- NIR
- near infrared
References
- 1.Rudin M, Weissleder R.Molecular imaging in drug discovery and development. Nat Rev Drug Discov 2003;2:123–131 [DOI] [PubMed] [Google Scholar]
- 2.Chabner BA, Roberts TG Jr.Timeline: chemotherapy and the war on cancer. Nat Rev Cancer 2005;5:65–72 [DOI] [PubMed] [Google Scholar]
- 3.Nadler E, Eckert B, Neumann PJ.Do oncologists believe new cancer drugs offer good value? Oncologist 2006;11:90–95 [DOI] [PubMed] [Google Scholar]
- 4.Weissleder R.Molecular imaging in cancer. Science 2006;312:1168–1171 [DOI] [PubMed] [Google Scholar]
- 5.Jobsis FF.Noninvasive, infrared monitoring of cerebral and myocardial oxygen sufficiency and circulatory parameters. Science 1977;198:1264–1267 [DOI] [PubMed] [Google Scholar]
- 6.Taroni P, Pifferi A, Torricelli A, Comelli D, Cubeddu R.In vivo absorption and scattering spectroscopy of biological tissues. Photochem Photobiol Sci 2003;2:124–129 [DOI] [PubMed] [Google Scholar]
- 7.Spinelli L, Torricelli A, Pifferi A, Taroni P, Danesini G, Cubeddu R.Characterization of female breast lesions from multi-wavelength time-resolved optical mammography. Phys Med Biol 2005;50:2489–2502 [DOI] [PubMed] [Google Scholar]
- 8.Tromberg BJ, Cerussi A, Shah N, et al. Imaging in breast cancer: diffuse optics in breast cancer—detecting tumors in pre-menopausal women and monitoring neoadjuvant chemotherapy. Breast Cancer Res 2005;7:279–285 [DOI] [PMC free article] [PubMed] [Google Scholar]
- 9.Choe R, Corlu A, Lee K, et al. Diffuse optical tomography of breast cancer during neoadjuvant chemotherapy: a case study with comparison to MRI. Med Phys 2005;32:1128–1139 [DOI] [PubMed] [Google Scholar]
- 10.Slamon DJ, Clark GM, Wong SG, Levin WJ, Ullrich A, McGuire WL.Human breast cancer: correlation of relapse and survival with amplification of the HER-2/neu oncogene. Science 1987;235:177–182 [DOI] [PubMed] [Google Scholar]
- 11.Mendelsohn J, Baselga J.The EGF receptor family as targets for cancer therapy. Oncogene 2000;19:6550–6565 [DOI] [PubMed] [Google Scholar]
- 12.Lewis GD, Figari I, Fendly B, et al. Differential responses of human tumor cell lines to anti-p185HER2 monoclonal antibodies. Cancer Immunol Immunother 1993;37:255–263 [DOI] [PMC free article] [PubMed] [Google Scholar]
- 13.Olafsen T, Tan GJ, Cheung CW, et al. Characterization of engineered anti-p185HER-2 (scFv-CH3)2 antibody fragments (minibodies) for tumor targeting. Protein Eng Des Sel 2004;17:315–323 [DOI] [PubMed] [Google Scholar]
- 14.Kraus MH, Popescu NC, Amsbaugh SC, King CR.Overexpression of the EGF receptor-related proto-oncogene erbB-2 in human mammary tumor cell lines by different molecular mechanisms. EMBO J 1987;6:605–610 [DOI] [PMC free article] [PubMed] [Google Scholar]
- 15.Lewis GD, Lofgren JA, McMurtrey AE, et al. Growth regulation of human breast and ovarian tumor cells by heregulin: evidence for the requirement of ErbB2 as a critical component in mediating heregulin responsiveness. Cancer Res 1996;56:1457–1465 [PubMed] [Google Scholar]
- 16.Huang Q, Shan S, Braun RD, et al. Noninvasive visualization of tumors in rodent dorsal skin window chambers. Nat Biotechnol 1999;17:1033–1035 [DOI] [PubMed] [Google Scholar]
- 17.Alencar H, Mahmood U, Kawano Y, Hirata T, Weissleder R.Novel multiwavelength microscopic scanner for mouse imaging. Neoplasia 2005;7:977–983 [DOI] [PMC free article] [PubMed] [Google Scholar]
- 18.van Slooten HJ, Bonsing BA, Hiller AJ, et al. Outgrowth of BT-474 human breast cancer cells in immune-deficient mice: a new in vivo model for hormone-dependent breast cancer. Br J Cancer 1995;72:22–30 [DOI] [PMC free article] [PubMed] [Google Scholar]
- 19.Mahmood U, Tung CH, Tang Y, Weissleder R.Feasibility of in vivo multichannel optical imaging of gene expression: experimental study in mice. Radiology 2002;224:446–451 [DOI] [PubMed] [Google Scholar]
- 20.Petrovsky A, Schellenberger E, Josephson L, Weissleder R, Bogdanov A Jr.Near-infrared fluorescent imaging of tumor apoptosis. Cancer Res 2003;63:1936–1942 [PubMed] [Google Scholar]
- 21.Kurosumi M.Significance and problems in evaluations of pathological responses to neoadjuvant therapy for breast cancer. Breast Cancer 2006;13:254–259 [DOI] [PubMed] [Google Scholar]
- 22.Penault-Llorca F, Adelaide J, Houvenaeghel G, Hassoun J, Birnbaum D, Jacquemier J.Optimization of immunohistochemical detection of ERBB2 in human breast cancer: impact of fixation. J Pathol 1994;173:65–75 [DOI] [PubMed] [Google Scholar]
- 23.Rhodes A, Jasani B, Couturier J, et al. A formalin-fixed, paraffin-processed cell line standard for quality control of immunohistochemical assay of HER-2/neu expression in breast cancer. Am J Clin Pathol 2002;117:81–89 [DOI] [PubMed] [Google Scholar]
- 24.Hilger I, Leistner Y, Berndt A, et al. Near-infrared fluorescence imaging of HER-2 protein over-expression in tumour cells. Eur Radiol 2004;14:1124–1129 [DOI] [PubMed] [Google Scholar]
- 25.Robinson MK, Doss M, Shaller C, et al. Quantitative immuno-positron emission tomography imaging of HER2-positive tumor xenografts with an iodine-124 labeled anti-HER2 diabody. Cancer Res 2005;65:1471–1478 [DOI] [PubMed] [Google Scholar]
- 26.Pritchard KI, Shepherd LE, O'Malley FP, et al. HER2 and responsiveness of breast cancer to adjuvant chemotherapy. N Engl J Med 2006;354:2103–2111 [DOI] [PubMed] [Google Scholar]
- 27.Tang Y, Wang J, Scollard DA, et al. Imaging of HER2/neu-positive BT-474 human breast cancer xenografts in athymic mice using (111)In-trastuzumab (Herceptin) Fab fragments. Nucl Med Biol 2005;32:51–58 [DOI] [PubMed] [Google Scholar]
- 28.Yeon CH, Pegram MD.Anti-erbB-2 antibody trastuzumab in the treatment of HER2-amplified breast cancer. Invest New Drugs 2005;23:391–409 [DOI] [PubMed] [Google Scholar]
- 29.Smith-Jones PM, Solit DB, Akhurst T, Afroze F, Rosen N, Larson SM.Imaging the pharmacodynamics of HER2 degradation in response to Hsp90 inhibitors. Nat Biotechnol 2004;22:701–706 [DOI] [PubMed] [Google Scholar]
- 30.Olafsen T, Kenanova VE, Sundaresan G, et al. Optimizing radiolabeled engineered anti-p185HER2 antibody fragments for in vivo imaging. Cancer Res 2005;65:5907–5916 [DOI] [PMC free article] [PubMed] [Google Scholar]


