Abstract
Intermolecular double quantum coherences (iDQCs), signals that result from simultaneous transitions of two or more separated spins, are known to produce images that are highly sensitive to subvoxel structure, particularly local anisotropy. Here we demonstrate how iDQCs signal can be used to efficiently detect the anisotropy created in breast tumor tissues and prostate tumor tissues by targeted (LHRH-conjugated) superparamagentic nanoparticles (SPIONs), thereby distinguishing the necrotic area from the surrounding tumor tissue.
Keywords: iMQC, iDQC, dipolar field, CRAZED, SPION, LHRH
Introduction
Over the past 15 years, intermolecular multiple quantum coherences (iMQCs) in solution and soft tissue have been used to enhance magnetic resonance [1] and functional magnetic resonance imaging [2], to improve sample structure determination [3], and to provide resolution enhancement in magnetic resonance spectroscopy [4]. iMQCs are converted into observable signal by intermolecular dipolar couplings, which are generally effective if the magnetization density is made anisotropic. For example, in the n-quantum CRAZED (Cosy Revamped by Asymmetric Z-Gradient Echo Detection) sequence (Fig. 1) and its variants, the area of the gradients defines a characteristic length scale, referred to as the correlation distance and typically 10μm-10mm, over which the magnetization is highly modulated. Hence, the dipolar interaction creates observable macroscopic signal over this distance. In homogeneous samples, such as a test tube of water, the choice of correlation distance has no effect on the iMQC signal, unless it is so short that diffusion becomes important during the sequence. In heterogeneous samples, however, it dramatically affects image contrast [3], since the iMQC signal provides a direct measure of the dipolar field at the selected correlation distance. Heterogeneity in the magnetization over this distance scale interferes with signal creation. This makes iMQCs particularly suitable for structure determination in samples with interesting structural details that are too large to be probed by diffusion-based methods, and too small to be detected directly by standard MRI imaging experiments.
Figure 1.
Standard CRAZED sequence used to detect signal from intermolecular double-quantum coherences. This specific implementation sequence starts with a crusher module to eliminate signal leakage for one scan to the next.
In this paper, we use computer simulations and both phantom and in vivo experiments to demonstrate how susceptibility differences (specifically, those generated by superparamagnetic nanoparticles) can provide sufficient frequency anisotropy to yield bright iMQC contrast. In particular, we show that, by using intermolecular double-quantum coherence (iDQC) imaging plus targeted contrast agents, we can create positive contrast that directly maps the nanoparticle loading in highly heterogeneous areas such as breast and prostate tumor tissues. Our work also demonstrates the potential for tumor stage assessment through iDQCs, by differentiating inside tumor tissues between the loading region (the live part of the tumor) and the background necrotic area.
SPIONs and their effects on intermolecular coherences
Superparamagnetic iron oxide nanoparticles (essentially small rust particles (Fe3O4)) are commonly used for tumor detection in clinical studies. SPIONs have some advantages compared to gadolinium chelates, as they present low toxicity and require lower concentration for MRI detection. Tissue perfused with SPIONs inevitably becomes magnetically heterogeneous. This field inhomogeneity reduces both T2* and apparent T2 relaxation times, since spins can diffuse through different environments, giving “dark contrast” in T2 and T2* weighted images. However, many other phenomena can also induce local loss of coherence, resulting in confounding dark areas that are indistinguishable from the SPION-perfused area. Several techniques have been proposed to invert the dark contrast into bright contrast, including gradient echo imaging with a partial rephasing of the slice selection gradient [5], selective RF excitation and refocusing of off-resonance water spins [6], off-resonance irradiation [7], and inversion-recovery with on-resonant water suppression [8]. Nonetheless, sensitivity remains a fundamental challenge, particularly for in vivo experiments.
The unique feature of SPIONs is that they create large magnetization that aligns with the bulk field, creating an anisotropic resonance frequency distribution with a very well-defined spatial distribution over a short (microns) distance scale. In general, iMQCs are also sensitive to local magnetic field gradients, particularly if they create well-defined spatial anisotropy. This has been studied by several different approaches, the oldest of which compared the variation in signal with correlation distance [3,10]. However, even clusters of nanoparticles (and the region where the field is perturbed) are vastly smaller than the correlation distance in any reasonable CRAZED experiment, so this approach is not expected to be particularly specific. A second approach (extensively explored by Faber et al.[9]) is to set the correlation gradient along the magic angle (x+y+z), which turns off the dipolar field interactions from uniform magnetization, rendering the bulk iMQC signal undetectable. In this case, again, the method does not exploit the special spatial characteristic of the field distribution, and experimentally the residual iMQC signal from SPIONs is small, and the signal amplitude is stronger if an SQC phase cycle is used with magic angle iMQC experiments.
In this work, we combine three different images obtained with the correlation gradients Gc oriented in the three different orthogonal directions (Gx, Gy and Gz). The method has been previously used by Bouchard et al. [12] to detect anisotropy in structured samples. In isotropic media, the iMQC signal has a spatial dependence (1 − 3cos2(θ)), where θ is the angle between the external magnetic field B0 and the direction of the correlation gradient; this implies that the combined image Gx+Gy+Gz (or |Gy|+|Gx|-|Gz|) should be completely blank since the X and Y images are −1/2 times as strong as the Z image. However, for a structured sample, the combination is not blank, and the intensity and phase of the combined signal reflects the local sample structure [12]. The major advantage over the magic angle gradient case is shown, both with simulations and in experiments, to arise from a strong difference between the effects of transverse (x,y) and longitudinal (z) gradients, which leads to large anisotropy signals.
Methods
Simulation
In order to understand how the dipolar field produces contrast in anisotropy map imaging experiments (abbreviated as AMI), we run a series of simulations. We simulated our signal behavior for the standard iDQC CRAZED sequence with correlation gradients aligned along x, y, and z. The inhomogeneity is created by assigning an exceedingly large value for the magnetization density to the center voxel, and letting it remain unaffected by RF or gradient pulses. The large difference in magnetization density between the central voxel and the rest of the sample effectively produces a surrounding dipolar field gradient similar to that produced by a water bubble, a SPION particle, or a SPION cluster.
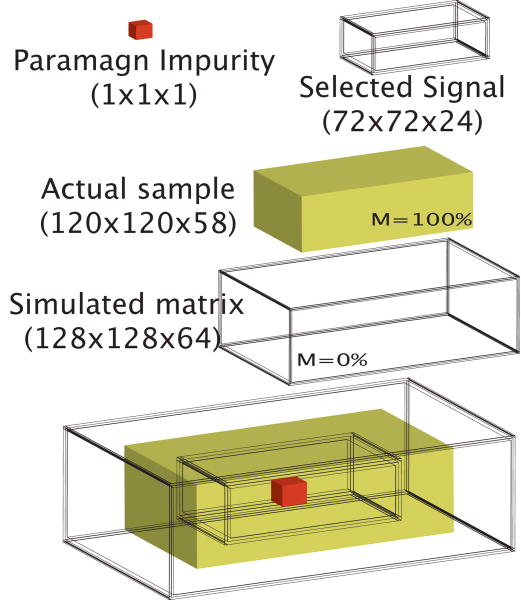
The simulations are performed by numerically integrating the modified Bloch equations based on the finite element method and a Runge-Kutta algorithm [10,12]. The simulated sample has 120×120×56 grid points with magnetization density equal to 100% surrounded by a 4 grid point shell of empty space. To avoid edge effects, the results of the simulations are then extracted only from the inner [72×72×24] core. The results of 72×72×24 voxels are then summed together to form a matrix of 3×3×1 to mimic the experimental situation where the voxel size is much larger than the SPION particle or SPION cluster. The spin resonant frequency is 360MHz, the sample temperature 300K, and the calculated dipolar demagnetizing time is 240ms. Relaxation and diffusion effects are not included in the calculations. The correlation gradient helix is defined by 12 grid points. Each image is obtained by performing a 4 step phase cycle to detect only iDQC signal and eliminate possible single and zero quantum contaminations.
Phantom experiments
All MRI experiments are performed on a 300 MHz, 21 cm horizontal-bore Magnex magnet, equipped with 12 cm bore imaging gradients (40 G/cm) and interfaced with a Bruker Biospect console. The sample consists of a spherical water sample containing a single air bubble. For all phantom imaging experiments, we select an axial slice with an in-plane spatial resolution of 469μm/pixel and a slice thickness of 2mm. Spin-echo and gradient echo images are acquired with echo times of 15ms and 3.3ms, respectively, and TR=3s. A frequency map image is also acquired at the same resolution using an unbalanced spin-echo sequence (Δt=50μs). A series of iDQC images with different correlation gradient strengths and directions, with and without phase cycling, are also acquired to investigate different AMI methods and possible sources of signal contamination. In all of the iDQC experiments presented in this paper, we avoid the stimulated echo contaminations and any kind of leakage of signal from one scan to the next by including a crusher module (a 90 degree pulse surrounded by unbalanced crush gradients at the magic angle) at the beginning of the sequence. The receiver gain is the same for all of the iDQC experiments.
LHRH-SPION nanoparticles
For the in vivo experiments, we create anisotropy by loading tumor tissues with superparamagnetic nanoparticles. The sensitivity and specificity of nanoparticles can be improved by functionalizing the particles with ligands. In our experiments SPIONs, synthesized at CAMD/LSU using the Schlenk technique [13], are coated with LHRH (luteinizing hormone releasing hormone), a naturally occurring hormone that controls sex hormones in both men and women. LHRH receptors are over-expressed in MDA-MB-435s human breast cancer cells and PC-3 human prostate cancer cells. LHRH-SPIONs can be specifically targeted to accumulate in human breast cancer cells that over-express LHRH-receptors, increasing the iron accumulation within the cells by up to 100pg of iron per cell [14]. The LHRH-SPIONs are fabricated as described in Zhou et al. [15]. The size of the uncoated particles is around 12 nm and the hydrodynamic size of the LHRH-coated particles is less than 50 nm. These particles are designed to provide target specificity, a long circulation time, and low opsonization in order to escape macrophage recognition. The decoration of SPION with LHRH serves multiple purposes in this case: targeting, cell specific accumulation through receptor mediated endocytosis, and coating to decrease RES (Reticulo-Endothelial System) recognition and increase circulation time. After IV injection, the accumulation of LHRH-SPION can be detected in tumor tissues and metastatic cancer cells as clusters smaller than 0.5μm [13].
Animal Preparation and Imaging Protocol
For our in vivo studies, female nude mice (homozygous nu/nu, strain code 088, sourced from the Charles River laboratory) at 6 weeks of age (22-27g body weight) are injected subcutaneously with MDA-MB-435s cancer cells (suspended in 0.1 ml of phosphate buffered saline (PBS) and 0.3 ml Matrigel), or male nude mice are injected with PC-3 prostate cancer cells (also suspended in 0.1 ml of PBS and 0.3 ml Matrigel). After 28 days, the tumor bearing mice receive a suspension of LHRH-SPION (100mg/kg) before the imaging session. For the MRI study, the animals are anesthetized using an i.p. injection of 80mg/kg of ketamine and maintained with intravenous (i.v) maintenance doses of 20mg/kg every 30 minutes. Respiratory pattern and body temperature are continuously monitored throughout the study. All in vivo studies are conducted in compliance with the Duke Institutional Animal Care and Use Committee regulations.
Two hours after the contrast agent injection, we acquire standard axial spin echo images, T2 map images, and a series of iDQC images with a spatial resolution of 234×375μm/pixel and slice thickness of 4mm for the breast tumor mice, and with a spatial resolution of 470×470μm/pixel and slice thickness of 2mm for the prostate tumor mice. The iDQC images are acquired by selecting the correlation gradient along the three orthogonal gradient directions x, y and z, with a correlation distance of 90μm. The anisotropy map images are obtained by a point-by-point subtraction of the three images |Gx|+|Gy|-|Gz|. The same series of images are also acquired postmortem. At the end of the imaging session, the prostate tumor tissue is excised, fixed in formalin, embedded in paraffin, sliced, and stained with hematoxylin-eosin or Prussian blue.
Results
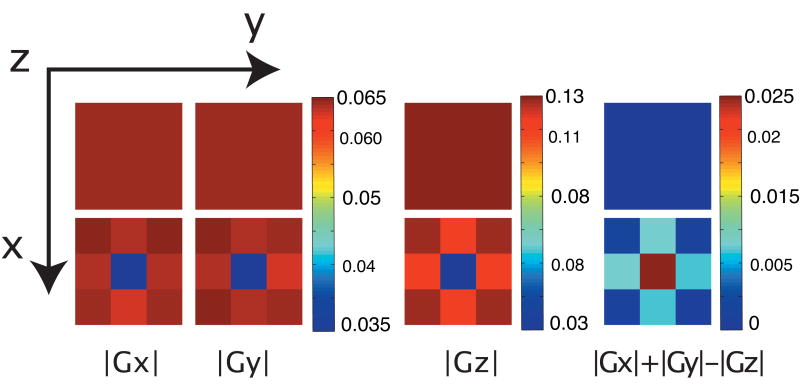
To begin, we ran calculations and experiments on a spherical water sample containing one single air bubble, which produces susceptibility gradients with similar geometry (though not the same strength and on a vastly different distance scale), of those created by SPION particles or SPION clusters. As can be seen in simulations (Fig. 3), in the bulk of the sample, the anisotropy map image produces no signal for a homogenous sample, as the Gx and Gy gradients produce a signal that is -1/2 the amplitude of the signal from Gz gradients. However, in the presence of local gradients, the signal produced by Gx and Gy gradients becomes stronger, and the anisotropy image gives a non-null signal.
Figure 3.
Simulated results from homogeneous (top) and inhomogeneous (bottom) samples. The images show the absolute value of the transverse magnetization in axial x,y plane (72,72,24). Each voxel corresponds in this case to a 24×24×12 simulated voxels.
Phantom results are shown in Fig. 4-7. The gradient echo image (Fig. 4a) shows strong artifacts due to the susceptibility gradients created by the water-air interface, which are reduced in the spin echo image (Fig. 4b) as expected. A frequency map (Fig. 4c) reveals gradients close to the water-air interfaces, on the order of several mGauss/cm.
Figure 4.
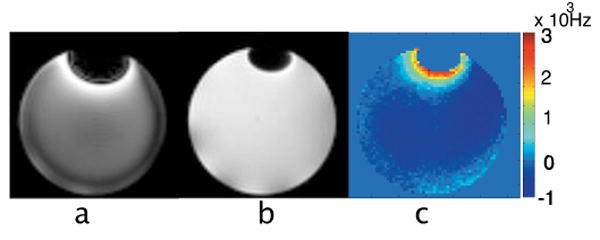
Axial images ((x, y and z are respectively read, phase and slice encoding directions) of the water phantom containing a single air enclosure on top. a. Gradient echo image. b. Spin-echo image. c. Frequency map image obtained with the spin-echo sequence run twice with balanced and unbalanced (50 μs) echo time.
Figure 7.
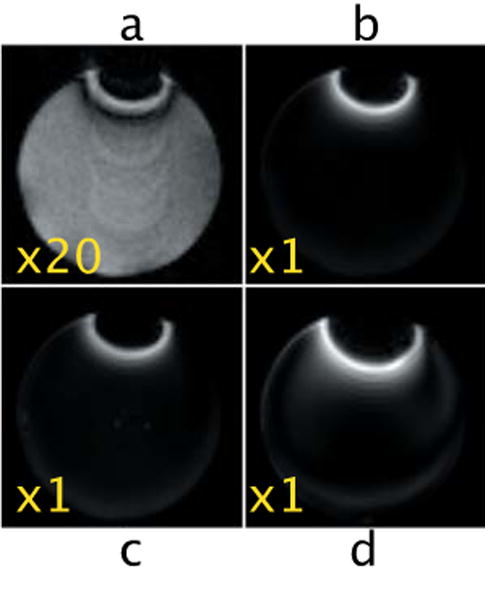
iDQC images acquired with a Gz correlation gradient selecting a dc=1mm and NA=4.
a. TE=40ms and t1=3ms, with phase cycle.
b. TE=40ms and t1=3ms, no phase cycle.
c. TE=100ms and t1=3ms, no phase cycle.
d. TE=40ms and t1=10ms no phase cycle.
Figure 5 shows the signal obtained from an iDQC sequence at different correlation gradient strengths and for different phase cycles. Selection of the correlation gradient along the magic angle does not lead to the observation of an iDQC signal, and an evaluation of the contamination can easily be done. Comparing Fig 5b and Fig 5a shows that the residual signal without phase cycling is mainly an SQC signal, refocused by the local susceptibility gradients. Strong correlation gradients completely unwind the SQC signal, except at the water-air interface, where the stronger susceptibility gradients can interfere and still partially refocus the SQC signal. The partial volume effect, on the other hand, becomes the dominant effect when weak correlation gradients are employed (Fig. 5c and 5d). In this case, the multiple quantum filter does not work properly, and even with a 4-step phase cycle, unwanted coherences can still affect the measured signal, as can be seen from the corresponding k-space images (Fig. 5e and 5f).
Figure 5.
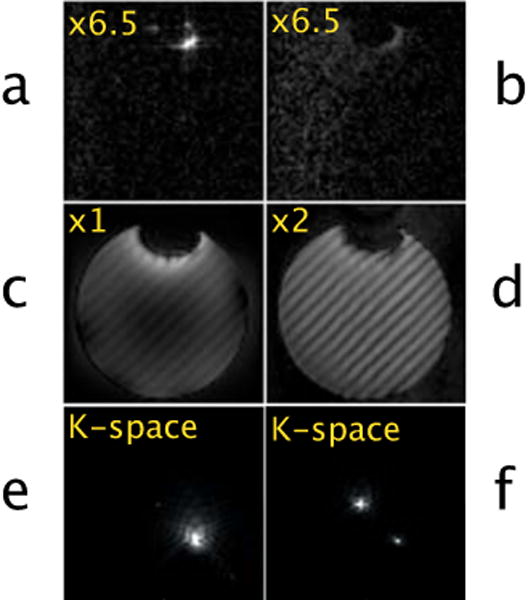
iDQC images of the same water phantom run with the correlation gradient oriented along the magic angle.
a. dc=90μm, no phase cycle.
b. dc=90μm, with phase cycle.
c. dc=1mm, no phase cycle.
d. dc=1mm, with phase cycle.
e. k-space of figure c.
k. k-space of figure d.
Figure 6 shows iDQC images and iDQC anisotropy map images obtained with different correlation gradient strengths. Clearly, strong correlation gradients generate clean signals that allow the acquisition of a true anisotropy map image by a point by point subtraction of the three images |Gy|+|Gx|-|Gz|, in perfect agreement with the simulated results in Fig. 3. On the other hand, when weaker correlation gradients are selected (Fig. 6 bottom row), strong contaminations are still visible, and a clean anisotropy map image cannot be obtained. When weak correlation gradients are selected along one of the imaging encoding directions, the contamination is mainly a partial volume effect, which manifests itself by the characteristic striping pattern (Fig. 6f and Fig. 6g) as the imaging encoding gradients interfere with the dipolar field encoding gradients (thus generating spurious signal in the images, which can be easily seen during the acquisition as an off-centered echo). When the correlation gradient is selected along the slice direction, the partial volume effect is, in general, attenuated (the correlation gradient is usually much smaller than the selected slice thickness). However, if a phase cycle is not employed, a stronger contamination can still arise from internal gradients which can locally refocus the SQC signal (Fig. 7a-b) through a mechanism similar to that described in Mani et al [5]. These local gradients are essentially always turned on, and can be only refocused by a spin-echo type sequence. During the iDQC sequence, on the other hand, the SQC signal is dephased by the correlation gradients, but can be rephased by the local gradients acting during the non-refocused t1 evolution. This explanation is in complete agreement with the experimental results shown in Fig. 7: the characteristic SQC signal decays as TE is increased (compare 7b and 7c), and the refocused area changes as t1 is varied (compare 7b and 7d.)
Figure 6.
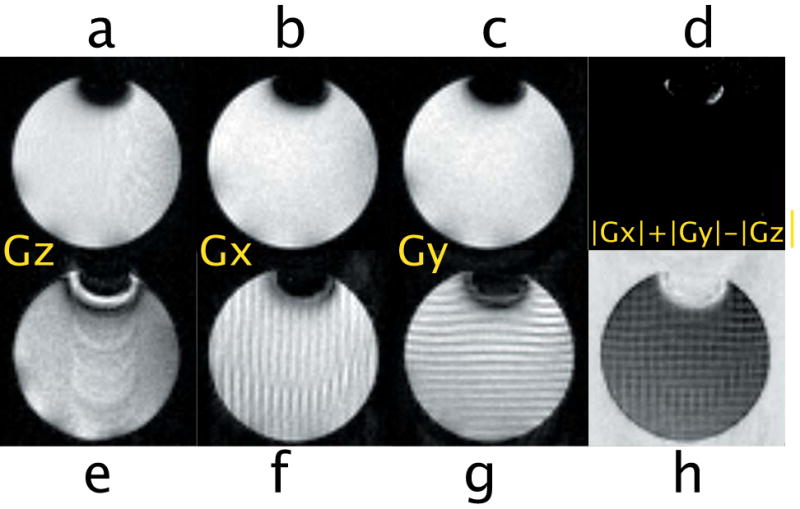
iDQC images acquired with a phase cycle to select the iDQC signal. Top row dc=90μm, bottom row dc=1mm. d and h are anisotropy map images obtained by a point by point subtraction of the magnitude images.
In vivo experiments on breast tumor and prostate tumor bearing mice are shown in Fig. 9 and Fig. 10 respectively. Fig. 8 shows the two tumor lobes located on the back of the mouse across the spinal cord (the right tumor lobe is about 4 times larger than the left lobe). Fig. 8 (bottom) shows a coronal spin-echo image; the contour of the axial slice selected for the iDQC anisotropy experiment is shown in red. Fig. 9 compares the conventional spin-echo image to the low resolution iDQC image obtained with the correlation gradient along the z direction. Overall, this image exhibits reduced SNR with respect to the standard spin-echo image and the postmortem iDQC image (SNR∼4.6 for the spin-echo image, SNR∼1.1 for the iDQC in vivo image and SNR∼5 for the post-mortem iDQC image, calculated for the ROI(2)), mainly due to respiratory motion that affects the signal encoding of the correlation gradient pulses. In comparing the breast tumor images (Fig. 9c) to the prostate tumor images (Fig. 10d), it is interesting to notice the difference in SNR on the iDQC images (SNR∼1.1 for the in vivo breast image, SNR∼8.2 for the iDQC prostate tumor image calculated for ROI(2)). In the breast tumor images, chest motion does not affect the spin echo image quality as much as the iDQC image quality, where stronger gradients are used for correlation encoding. In the second case, the tumor was located in the flank area, where respiratory motions are strongly attenuated, leading to a better image quality. Though the iDQC breast tumor images and prostate tumor images show very low SNR and reduced resolution compared to the standard spin-echo images (SNR∼4.6 for the spin-echo breast image, and SNR∼55 for the spin-echo prostate image), the combined images (Fig. 9e, Fig. 9f and Fig. 10f) have a better contrast to noise ratio that shows very clean tumor tissue highlighting (CNR∼1 for the in vivo anisotropy breast image, CNR∼0.5 for the in vivo breast spin-echo image, CNR ∼9.6 for the in vivo anisotropy prostate image and CNR∼1.1 for the in vivo prostate spin-echo image, calculated by SNR(ROI(2))-SNR(ROI(1))). Moreover, the iDQC anisotropy map image obtained for the prostate tumor model is astonishingly similar to the anisotropy map obtained for the breast tumor model, showing the same peripheral tumor enhancement. In both Fig 9f and Fig 10f, only the outer part of the tumor is highlighted, while the inside part appears completely dark, similar to the normal surrounding healthy tissue. The enhanced area roughly corresponds to the outer portion of the tumor that also show a marked decreased in T2 values (Fig 9b and Fig 10b) for both prostate tumor tissue, (T2∼60± 5ms for ROI(2), and T2∼85 ± 5ms for ROI(1)), and breast tumor tissue (T2 ∼65± 5ms for ROI(4), vs T2∼80± 5ms for ROI(1)). The left lobe of the breast tissue is also completely highlighted, and presents similar T2 values (T2 ∼60± 5ms for ROI(2)) to the outer part of the bigger lobe (ROI(4) in the same image), which is highlighted as well. Like these tumor areas, other areas of the mouse body show a decreased transverse relaxation time, although they are not highlighted in the iDQC anisotropy map image. This suggests that our method is not showing mere T2 variations, but rather resonance frequency variations that reveal the targeting pattern of the LHRH-SPION and therefore the boundaries between viable and necrotic tumor tissues. LHRH-SPIONs are unable to accumulate in necrotic cells of the xenograft, (dark in the image). In contrast, viable cancer cells in the xenografts actively accumulate LHRH-SPIONs, increasing the local frequency variation and magnetization anisotropy. Necrotic cancer cells are already present in the center of the prostate tumor mass (Fig. 10c) and most likely on the bigger right lobe of the breast tumor tissue, while the smaller left lobe had probably none. This was later confirmed only for the prostate tumor tissue by histological examinations. Microscopically, the tumor was extensively necrotic over most of the area that had shown no enhancement in the iDQC anisotropy map image (Fig 10c), while viable cancer cells, present in the highlighted outer portion of the tumor tissue, had been targeted by the LHRH-SPION particles (inset in Fig 10c)).
Figure 9.
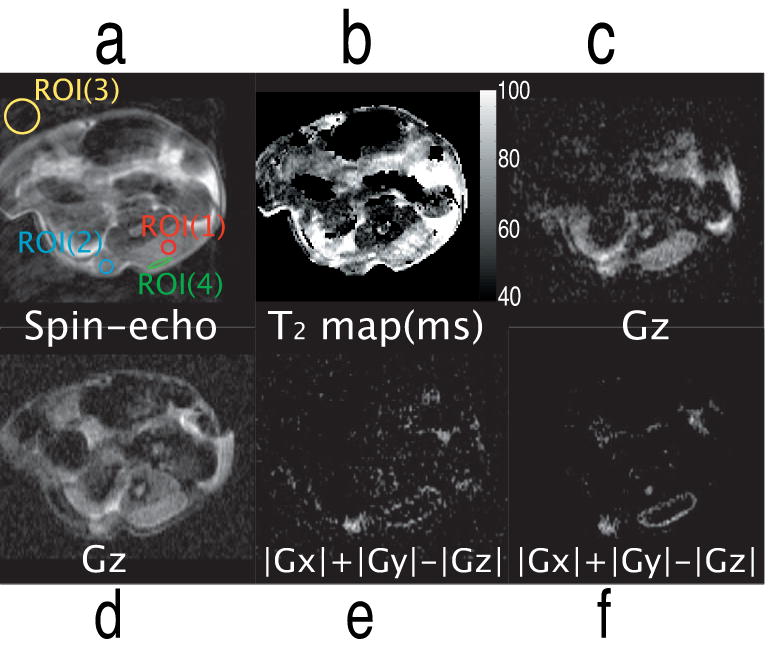
a. Axial Spin-echo image (TE=10ms, TR=2.5s). The tumor burden is clearly seen on the bottom. The image also shows the selected ROI used for the measurements of SNR and CNR. ROI(1) is placed in the inner region of the right tumor lobe (likely necrotic), ROI(2) cover most of the left lobe (more likely still viable), ROI(3) is placed within ghost-free regions of the image background, outside the mouse, and ROI(4) is placed in the outer region of the right lobe (probably viable).
b. T2 map image in milliseconds obtained with a multi-spin-echo sequence (TE=10ms, TR=4s, NEchoes=16).
c. In vivo iDQC image with the correlation gradient along the z direction (NA=8, t1=2.25 ms, TE=30ms, TR=4s)
d. Post mortem iDQC image using the same sequence parameters as in c.
e. In vivo anisotropy map image obtained subtracting 3 iDQC images with correlation gradient along the z, x and y directions.
f. Post mortem anisotropy map image obtained as in e.
Figure 10.
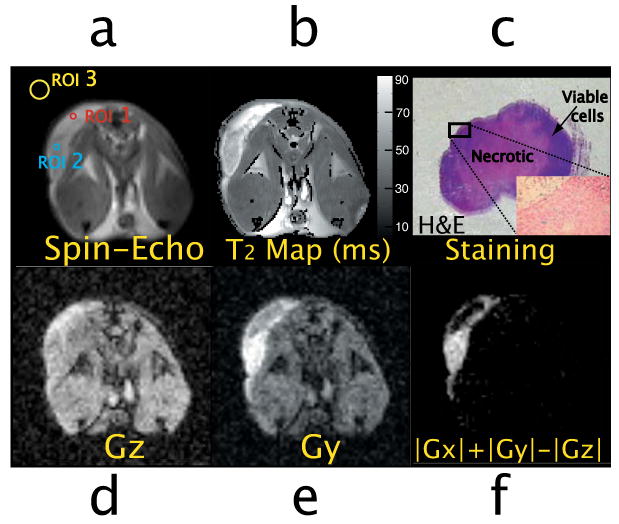
In vivo images of the prostate tumor mouse. The tumor lobe can be easily seen on the upper left corner.
a. Spin-echo image indicating the selected ROI (ROI1, ROI2 and ROI3 for the measurements of SNR and CNR. ROI(1) is placed in the inner region of the tumor (necrotic), ROI(2) is placed in the outer region of the tumor (viable tumor region), and ROI(3) is placed within ghost-free regions of the background, outside the mouse.
b. T2 map image in milliseconds obtained using a multi-spin-echo sequence: TE=7ms, TR=4s, NEchoes=16.
c. Hematoxylin and eosin (H&E) stained section of the imaged prostate tumor tissue (1× amplification): the inner necrotic area (pink area) is surrounded by viable cancer cells (dark blue area). The outer area shows iron positive cells (inset: Prussian blue stained section of the outer area of the tumor, 10× amplification).
d-e. In vivo iDQC images with the correlation gradient along the z and y direction (NA=8, t1=2.25ms, TE=30ms, TR=4s).
f. In vivo iDQC anisotropy map image.
Figure 8.
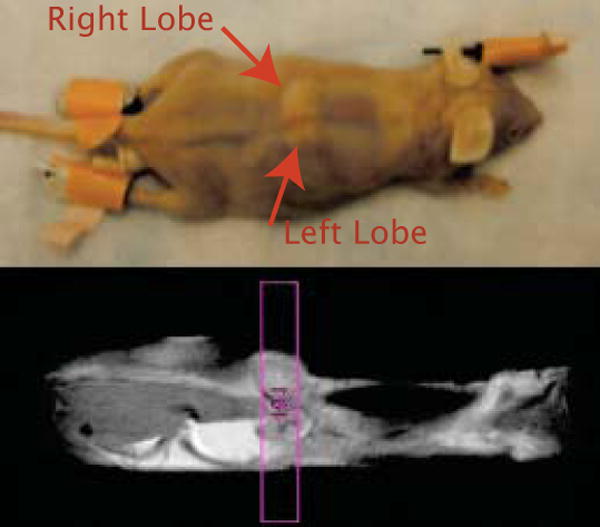
Image of the mouse used for the in vivo experiments. The tumor was located on the back, close to the chest area. Two tumor lobes of different size can be identified on both sides of the spinal cord. The left lobe was clearly smaller than the right lobe. The spin-echo coronal image shows the selected axial slice for the anisotropy study.
Discussion and Conclusions
The strong T2 relaxivity of SPIONs makes them attractive imaging targets for MRI tumor detection, but the tumor area can be hard to distinguish in sequences with negative contrast since other phenomena can also induce local signal losses. Other methods which create positive contrast from SPION particles require good B0 homogeneity, and susceptibility gradients present in most in vivo environments make these techniques applicable only in vitro and in fairly homogeneous areas like the brain. We have shown here that iDQC detection can provide clean anisotropy map images when strong correlation gradients are employed and a correct phase cycle is adopted. In this case, by using iDQC imaging techniques, in conjunction with targeted contrast agents, we showed that we can create positive contrast that directly maps the nanoparticle loading in highly heterogeneous areas such as breast tumor and prostate tumor tissues. In addition, the ability of iDQC to differentiate inside the tumor tissue between the loading region (the live part of the tumor) and the background necrotic area, when used in conjunction with specially targeted SPION particles, opens up exciting possibilities for tumor stage assessment through MRI. This would be a particularly important enhancement in prostate imaging, where this assessment is the single greatest challenge in evaluating therapeutic options.
We also note that a potentially important future application would be use of the same method to track labeled cancer cells, if the necessary sensitivity is available. The major limitation of this method, with respect to the standard methods, is the generally low SNR; moreover, unlike standard methods that give better SNR for short echo time, this method requires a long echo time for the signal build up, and thus could be problematic for tissue with very short T2. However, these experiments could readily be modified to incorporate recently published methods for iMQC sensitivity enhancement [16, 17, 18, 19], as well as recent developments for general sensitivity enhancement such as cooled coils. In addition, while these studies were done at 7T, a cell tracking study might benefit from a lower field. In conventional iMQC imaging, the field dependence is weaker than expected from the nonlinearity alone, because the signal increases with the longer echo time available at lower field; in addition, the paramagnetic particles' saturated magnetization will produce relatively larger effects at lower fields.
Figure 2.
Simulated sample geometry.
Acknowledgments
This work was supported by NIH grant EB02122
References
- 1.Warren WS, Ahn S, Mescher M, Garwood M, Ugurbil K, Richter W, Rizi R, Hopkins J, Leigh JS. MR imaging contrast enhancement based on intermolecular zero quantum coherences. Science. 1998;281:247–251. doi: 10.1126/science.281.5374.247. [DOI] [PubMed] [Google Scholar]
- 2.Richter W, Richter M, Warren WS, Merkle H, Andersen P, Adriany G, Ugurbil K. Functional magnetic resonance imaging with intermolecular multiple-quantum coherences. Magn Reson Imag. 2000;18:489–494. doi: 10.1016/s0730-725x(00)00133-8. [DOI] [PubMed] [Google Scholar]
- 3.Bouchard LS, Rizi RR, Warren WS. Magnetization structure contrast based on intermolecular multiple-quantum coherences. Magn Reson Med. 2002;48:973–979. doi: 10.1002/mrm.10293. [DOI] [PubMed] [Google Scholar]
- 4.Galiana G, Branca RT, Warren WS. Ultrafast intermolecular zero quantum spectroscopy. Journal Am Chem Soc. 2005;127(50):17574–5. doi: 10.1021/ja054463m. [DOI] [PubMed] [Google Scholar]
- 5.Mani V, Briley-Saebo KC, Itskovich VV, Samber DD, Fayad ZA. GRadient echo Acquisition for Superparamagnetic particles with Positive contrast (GRASP): Sequence Characterization in Membrane and Glass Superparamagnetic Iron Oxide Phantoms at 1.5T and 3T. Magn Reson Med. 2006;55:126–135. doi: 10.1002/mrm.20739. [DOI] [PubMed] [Google Scholar]
- 6.Cunningham CH, Arai T, Yang PC, McConnell MV, Pauly JM, Conolly SM. Positive Contrast Magnetic Resonance Imaging of Cells Labeled with Magnetic Nanoparticles. Magn Reson Med. 2005;53:999–1005. doi: 10.1002/mrm.20477. [DOI] [PubMed] [Google Scholar]
- 7.Zurkiya O, Hu X. Off-Resonance Saturation as a Means of Generating Contrast With Superparamagnetic Nanoparticles. Magn Reson Med. 2006;56:726–732. doi: 10.1002/mrm.21024. [DOI] [PubMed] [Google Scholar]
- 8.Stuber M, Gilson WD, Schar M, Kedziorek DA, Hofmann LV, Shah S, Vonken EJ, Bulte JWM, Kraitchman DL. Positive Contrast Visualization of Iron Oxide-Labeled Stem Cells using Inversion-Recovery With ON-Resonant Water Suppression (IRON) Magn Reson Med. 2007;58:1072–1077. doi: 10.1002/mrm.21399. [DOI] [PubMed] [Google Scholar]
- 9.Faber C, Heil C, Zahneisen B, Balla DZ, Bowtell R. Sensitivity to local dipole fields in the CRAZED experiment: An approach to bright spot MRI. Journ Magn Reson. 2006;182:315–324. doi: 10.1016/j.jmr.2006.05.002. [DOI] [PubMed] [Google Scholar]
- 10.Enss T, Ahn S, Warren SW. Visualization of the dipolar field in solution NMR and MR imaging: three-dimensional structure simulations. Chem Phys Lett. 1999;305:101–108. [Google Scholar]
- 11.Bouchard LS, Warren WS. Multiple-quantum vector field imaging by magnetic resonance. Journ Magn Reson Med. 2005;177:9–21. doi: 10.1016/j.jmr.2005.06.019. [DOI] [PubMed] [Google Scholar]
- 12.Garret-Roe S, Warren WS. Numerical studies of intermolecular multiple quantum coherence: high-resolution in inhomogeneous field and contrast enhancement in MRI. J Magn Reson. 2000;146:1–13. doi: 10.1006/jmre.2000.2096. [DOI] [PubMed] [Google Scholar]
- 13.Kumar CSSR, Leuschner C, Doomes EE, Henry L, Juban M, Hormes J. Efficacy of lytic peptide bound magnetite nanoparticles in destroying breast cancer cells. J Nanosci Nanotechnol. 2004;4:245–249. [PubMed] [Google Scholar]
- 14.Leuschner C, Kumar C, Hormes J, Hansel W. Targeting breast cancer cells and their metastases through luteinizing hormone releasing hormone (LHRH) receptors using magnetic nanoparticles. J Biomed Nanotechnol. 2005;1:201–205. [Google Scholar]
- 15.Zhou J, Leuschner C, Kumar C, Hormes JF, Soboyejo WO. Sub-cellular accumulation of magnetic nanoparticles in breast tumors and metastases. Biomaterials. 2006;27(9):2001–2008. doi: 10.1016/j.biomaterials.2005.10.013. [DOI] [PubMed] [Google Scholar]
- 16.Branca RT, Galiana G, Warren WS. Enhanced nonlinear magnetic resonance signals via square wave dipolar fields. J Chem Phys. 2008;129:054502. doi: 10.1063/1.2962976. [DOI] [PMC free article] [PubMed] [Google Scholar]
- 17.Branca RT, Galiana G, Warren WS. Signal enhancement in CRAZED experiments. Journ Magn Reson. 2007;187(1):38–43. doi: 10.1016/j.jmr.2007.02.017. [DOI] [PMC free article] [PubMed] [Google Scholar]
- 18.Tang X, Onga H, Shannon K, Warren WS. Simultaneous acquisition of multiple orders of intermolecular multiple-quantum coherence images. Magn Reson Imag. 2003;21(10):1141–1149. doi: 10.1016/j.mri.2003.08.015. [DOI] [PubMed] [Google Scholar]
- 19.Shannon KL, Branca RT, Galiana G, Cenzano S, Bouchard LS, Soboyejo W, Warren WS. Simultaneous acquisition of multiple orders of intermolecular multiple-quantum coherence images in vivo. Magn Reson Imag. 2004;22(10):1407–1412. doi: 10.1016/j.mri.2004.10.019. [DOI] [PubMed] [Google Scholar]


