Abstract
Vibrio cholerae hemolysin (HlyA) is a 65-kDa water-soluble pore-forming toxin that causes lysis of eukaryotic cells by destroying selective permeability of the plasma membrane bilayer. The HlyA monomer self-assembles on the target cell surface to the more stable β-barrel amphipathic heptamer, which inserts into the membrane bilayer to form a diffusion channel. Deletion of the 15-kDa β-prism lectin domain at the C terminus generates a 50-kDa hemolysin variant (HlyA50) with an ∼1,000-fold decrease in hemolytic activity. Because functional differences are eventually dictated by structural differences, we determined three-dimensional structures of 65- and 50-kDa HlyA oligomers, using cryo-electron microscopy and single-particle methods. Our study clearly shows that the HlyA oligomer has sevenfold symmetry but that the HlyA50 oligomer is an asymmetric molecule. The HlyA oligomer has bowl-like, arm-like, and ring-like domains. The bowl-like domain is coupled with the ring-like domain, and seven side openings are present just beneath the ring-like domain. Although a central channel is present in both HlyA and HlyA50 oligomers, they differ in pore size as well as in shape of the molecules and channel. These structural differences may be relevant to the striking difference in efficiencies of functional channel formation by the two toxin forms.
Vibrio cholerae, a Gram-negative bacterium, is the causative agent of cholera in humans (9). The severe diarrhea of cholera is due primarily to the effects of cholera enterotoxin upon the small intestine epithelial cells (3). In addition to cholera toxin (9), most Vibrio cholerae strains secrete a membrane-damaging protein, designated cholera hemolysin (HlyA) (27) or cytolysin/hemolysin (VCC), with cytotoxic and cytolytic activity toward a wide spectrum of eukaryotic cells. VCC is an extracellular pore-forming toxin (PFT) (26) that exists in two stable forms: one is a water-soluble monomer with a molecular mass of 65 kDa (5, 6, 27, 31), and the other is a β-barrel amphipathic heptamer. The VCC monomer interacts with a cell surface receptor(s), self-assembles to an amphipathic β-barrel by circular oligomerization, and inserts into the membrane lipid bilayer (2, 7, 14, 21). Despite individual variations that depend on amino acid sequence, three-dimensional (3D) structure, and receptor specificity, PFTs have evolved a strikingly common strategy to destroy the permeability barrier of the target cell membrane (16). The soluble PFT monomer interacts with the target cell, self-assembles into an amphipathic β-barrel by circular oligomerization, and translocates from the cell surface or lipid-water interface to the core of the lipid bilayer, forming a transmembrane pore (5, 6).
HlyA is expressed as an 82-kDa preprohemolysin protein, and following removal of the signal sequence, the protein is excreted during in vitro growth as the 79-kDa prohemolysin (proHlyA) (28). Proteolytic removal of 132 residues from the N-terminal region generates the mature 65-kDa HlyA, with a specific hemolytic activity of ∼100 pM toward rabbit erythrocytes (15). The mature toxin has a central cytolytic domain involved in oligomerization and anchoring to the hydrophobic core of the bilayer, followed by two lectin domains homologous to the carbohydrate-binding domains of the plant lectins ricin and jacalin (17). Proteolytic deletion of the 15-kDa β-prism lectin domain, which is apparently involved in specific interaction with β-galactosyl-terminated glycoconjugates (21), from the carboxy-terminal end of the 65-kDa mature hemolysin generates the truncated 50-kDa hemolysin (HlyA50) (8, 29). This truncated 50-kDa hemolysin (HlyA50) retains the oligomerization and membrane-anchoring domains (17, 18) and resembles the mature toxin in surface amphipathicity, nonspecific interaction with target biomembrane and lipid vesicles, and ability to undergo lipid-induced oligomerization (30). HlyA50 is about 1,000-fold less active than HlyA toward rabbit erythrocytes (29, 30), suggesting that the HlyA50 oligomer might be less capable of adopting an insertion-competent configuration.
In the present study, we have attempted to determine the three-dimensional structures of the oligomers generated by the 65-kDa Vibrio cholerae hemolysin and the 50-kDa hemolysin, using cryo-electron microscopy and single-particle analysis techniques. Determination of the three-dimensional structure is important, as it might shed light on the shape of the transmembrane channel as well as on the anchoring and insertion processes of the two toxin forms.
MATERIALS AND METHODS
Purification of V. cholerae HlyA and HlyA50.
HlyA was purified as described earlier (21). Briefly, bacteria (non-O1 V. cholerae strain V2) (21) were grown to stationary phase in brain heart infusion broth at 37°C, and the toxin was purified by sequential application of hydrophobic interaction chromatography on a phenyl-Sepharose CL-4B column and anion-exchange chromatography on a polybuffer exchanger (PBE-94). The HlyA oligomer was generated by incubating the toxin with phosphatidylcholine (PC)-cholesterol vesicles, followed by removal of the lipid by chromatography on a Sepharose CL-4B column in the presence of 1% sodium deoxycholate. The detergent was removed by exhaustive dialysis against 25 mM sodium phosphate buffer containing 1 mM EDTA and 3 mM NaN3, pH 7.2. The 50-kDa C-terminally truncated variant of the toxin, HlyA50, formed spontaneously due to exposure of the toxin to bacterial proteases released in the culture supernatant and was separated from the 65-kDa toxin on a phenyl-Sepharose CL-4B column by virtue of its reduced amphipathicity.
Electron microscopy. (i) Negative staining.
Negative staining was carried out using 2% uranyl acetate on glow-discharged carbon grids.
(ii) Specimen preparation and cryo-electron microscopy of Vibrio hemolysin.
Holey carbon grids were mainly used for specimen preparation in cryo-electron microscopy. Each holey carbon grid was glow discharged immediately before freezing, and about 3 μl of purified hemolysin sample was allowed to adsorb on it. After blotting of excess liquid nearly to dry with a piece of filter paper, the grid was subjected to ultrarapid freezing by being plunged quickly into liquid ethane at −180°C, and a thin layer of vitreous ice was formed in the holes of the support films. The procedure was carried out using a Leica EM CPC instrument. The grid was transferred to a cryo-grid box and stored in liquid nitrogen for further use. The cryo-grids were examined in an FEI Tecnai 12 BioTwin transmission electron microscope fitted with a Gatan 626DH cryo-holder. Electron micrographs of frozen hydrated hemolysin were taken on Kodak SO163 film at different defocus values under low-dose conditions (10 e−/Å2) at −180°C. Micrographs were taken at 120 kV and a magnification of ×49,000. The Kodak SO163 films were developed for 12 min in Kodak D19 full-strength developer.
Image processing and visualization.
The three-dimensional volumes of HlyA and HlyA50 were calculated using single-particle analysis methods, using EMAN 1.8 software (13) operating on a Linux Fedora Core 4 platform. EMAN software requires a preliminary model to calculate a 3D structure and then implements a model-based iterative refinement process to generate the final structure. A reference free class average is used to generate a very rough preliminary model. Initially, 5,700 HlyA particles were boxed out using the graphical program Boxer. The contrast transfer function (CTF) for each particle in the data set was determined using the program ctfit. Selected particles were filtered with a low-pass filter of 40 Å, using the proc2d program of EMAN. These filtered particles were centered using the cenalignint program of EMAN software. Boxed out HlyA particles were distributed in different reference free class averages with respect to their orientation angle. A rough preliminary three-dimensional model was determined by the different class averages of HlyA particles, using the startcsym program. A 2D projection image of the initial model was taken, and particles were classified into different class averages and aligned properly with respect to the 2D projection image of the initial model. This initial model was refined using the Refine (11, 13) program, and C7 symmetry was applied. This orientation cycle was repeated until the model converged, i.e., the model did not change from one round to the next round of refinement.
Symmetry analysis of V. cholerae hemolysin.
The rotational symmetry of the HlyA molecule was determined using the startcsym program (12, 13). Boxed-out particles were classified into two classes: one was the unsymmetrized particle average (class.img), and the other was the symmetrized particle average (sym.img). Unsymmetrized particle averages (classes.img) were compared with the symmetrized (sym.img) versions. The startcsym program was run on all boxed-out particles for all probable applied symmetry. Symmetry of HlyA50 was also determined using the same procedure.
Rotational correlation analysis was performed using the EMAN python script (11). This program reads only the first image of class average (avg.hed). The first image was rotated around the z axis, with a 1-degree increment for each time point, and the correlation coefficient was calculated between each of the rotated and nonrotated images. This rotational correlation was plotted in 1-degree increments.
Initial model preparation of 50-kDa hemolysin.
The initial model preparation technique for asymmetric particles was different from that for symmetric particles. A total of 16,573 HlyA50 particles were boxed out. Raw particles were filtered and centered using a suitable program. Centered particles were classified into different classes using the startnrclasses program. Only well-centered and high signal/noise class averages were used to generate a preliminary 3D model, using the cross-common-line approach. The StartAny program was used to generate the preliminary model, and no symmetry was applied. 2D projections were generated from the preliminary structure, and each selected boxed-out raw particle was classified and realigned into a different class with respect to the 2D projection image. Finally, a 3D model was generated using the same procedure as 3D reconstruction of HlyA.
Few rounds of angular refinement were applied to 65-kDa and 50-kDa V. cholerae hemolysin particles to determine the final three-dimensional reconstruction. This process was iterated until convergence was achieved. A t test was performed to estimate the resolution of three-dimensional reconstruction, using the eotest program of EMAN. The resolution was determined by using a 0.5 Fourier shell correlation (FSC) (1, 12). The internal structure, size of hemolysin, and difference map of hemolysin were determined using UCSF Chimera (4). Three-dimensional structures of both hemolysins were visualized by the Chimera (4) software package.
Docking of atomic model into electron density map of HlyA.
Docking of the HlyA atomic model (Protein Data Bank accession no. 1XEZ) (18) was performed interactively using Chimera software (4). The atomic coordinates of the HlyA atomic model were interactively fitted with the rigid body, using the “fit model in map” command of the 3D viewing software of Chimera (4).
RESULTS
Electron microscopy of Vibrio hemolysin.
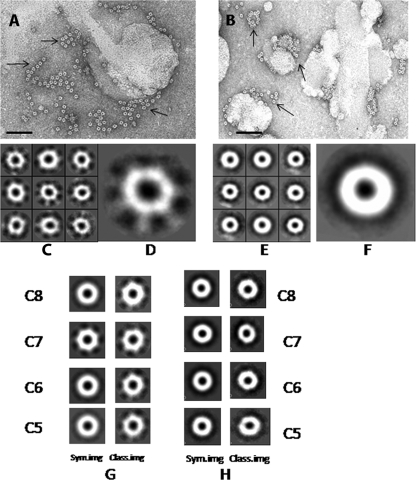
Figure 1A and B show the sample areas of negatively stained electron micrographs of purified HlyA and HlyA50 oligomers, respectively. The populations of HlyA and HlyA50 oligomers are homogeneous, generally nonaggregated, and of uniform size. Both HlyA and HlyA50 oligomers are ring-shaped circular particles, with a central hole in each. These features are clearly seen in electron micrographs of negatively stained HlyA and HlyA50. The copresence of single molecules suggests that HlyA and HlyA50 are well suited for the single-particle analysis technique. Figure 1C shows some boxed-out raw particles, and Fig. 1D shows a larger top view of them. Figure 1C and D show that all raw particles of HlyA are of uniform size and have C7 symmetry. Figure 1E shows some boxed-out raw particles of the HlyA50 oligomer, and Fig. 1F shows a larger top view of them. The boxed-out particles and the large view of boxed-out particles (Fig. 1E and F) indicate that the HlyA50 oligomer is a globular particle with a central hole. Such an overall structure is to be expected for PFTs, and a high-resolution model (PDB accession no. 1XEZ) (18) exists for HlyA.
FIG. 1.
Transmission electron microscopy and symmetry determination of Vibrio cholerae hemolysin. (A) Negatively stained 65-kDa Vibrio cholerae hemolysin (HlyA) oligomer. Arrows show the HlyA oligomer. Bar = 100 nm. (B) Negatively stained 50-kDa Vibrio cholerae hemolysin (HlyA50) oligomer. Arrows show the HlyA50 oligomer. Bar = 100 nm. (C) Boxed-out raw particle images of top view of HlyA oligomer. All raw particles are heptamers, which strongly indicates that HlyA has C7 symmetry. (D) Large view of boxed-out raw particle of 65-kDa HlyA oligomer. (E) Boxed-out raw particle images of top view of HlyA50 oligomer. All raw particles strongly indicate that HlyA50 is asymmetric. (F) Large view of boxed-out raw particle of HlyA50 oligomer. (G) The left column shows the symmetrized (sym.img) particles of HlyA with different symmetry operations, and the right column shows the unsymmetrized particles or class average or raw particle images. The following symmetry options were used: C8 symmetry (top row), C7 symmetry (second row), C6 symmetry (third row), and C5 symmetry (last row). For C7 symmetry, the unsymmetrized or raw particle image is identical with the symmetrized version. (H) The left column shows the symmetrized (sym.img) particles of HlyA50 with different symmetry operations, and the right column shows the unsymmetrized particles or class average or raw particle images for different symmetry operations. The following symmetry options were used: C8 symmetry (top row), C7 symmetry (second row), C6 symmetry (third row), and C5 symmetry (last row).
Determination of symmetry.
Symmetry of the HlyA and HlyA50 particles was determined using EMAN software. The top view of the hemolysin particles was boxed out, and they were classified into class average and symmetry average. The first image of class average was compared with the first image of symmetry average. Figure 1G shows the symmetrized (left column) and unsymmetrized (right column) particles of HlyA. All probable symmetry (C1 to C8) was applied (only C4, C5, C6, and C7 symmetry images are shown). For C7 symmetry, the unsymmetrized particle average or class average was identical with the symmetrized (sym.hed) particle average, indicating that HlyA has C7 symmetry. The symmetry of HlyA50 was determined using the same procedure. Figure 1H shows the symmetrized (left column) and unsymmetrized (right column) particle averages for C5, C6, C7, and C8 rotational symmetry of the HlyA50 oligomer. But unsymmetrized and symmetrized particle averages of HlyA50 were not identical for any possible symmetry (C2 to C8). This indicates that HlyA50 is an asymmetric molecule.
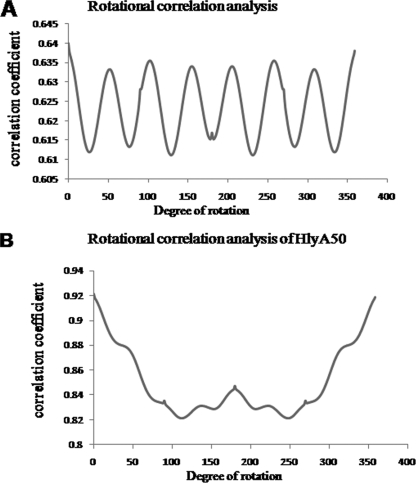
Rotational correlation analysis is an effective method to confirm the symmetry features of raw particles. In this case, rotational correlation between the rotated and nonrotated images of HlyA was calculated (see Materials and Methods). In the representation of rotational correlation analysis, the horizontal axis represents the rotational angle and the longitudinal axis is the rotational correlation of the 2D image (Fig. 2A). Figure 2A clearly shows that seven peaks of uniform height are found, at rotation angles of 51.4°, 102.8°, 154.2°, 205.7°, 257.1°, 308.6°, and 360°. These seven peaks of rotational correlation analysis indicate that HlyA oligomer has C7 symmetry. Figure 2B shows the rotational correlation analysis of the HlyA50 particle, with no clear peak in the graph, clearly indicating that HlyA50 is an asymmetric molecule.
FIG. 2.
Rotational correlation analysis of hemolysin particles. (A) Rotational correlation was calculated from the first image (avg.hed; class average). The horizontal axis represents the rotational angle of the image (0° to 360°), and the perpendicular axis represents the correlation coefficient. The graph possesses seven peaks, with correlation values as high as 0.63, at every 51.4°. (B) The horizontal axis represents the rotational angle of the image (0° to 360°), and the perpendicular axis represents the correlation coefficient. No clear peak is visualized. Only a small peak is observed at a 180° angle. This indicates that HlyA50 is asymmetric.
3D structure of Vibrio cholerae hemolysin.
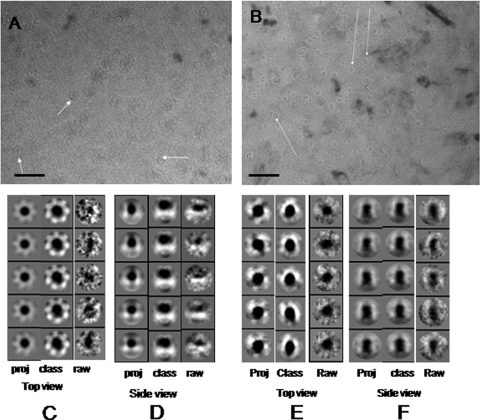
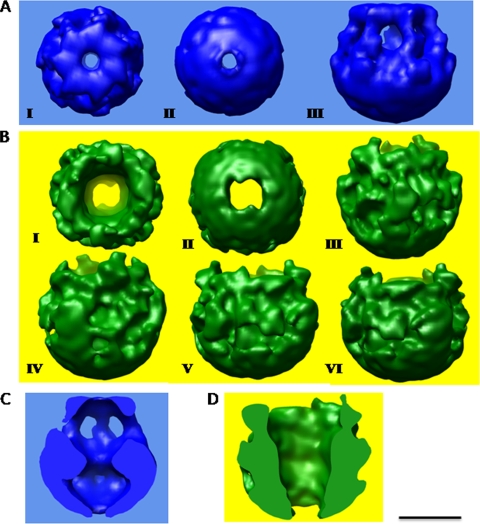
For three-dimensional reconstruction, a cryo-electron micrograph of Vibrio hemolysin was taken at a nominal defocus length of −1 μm. The high signal/noise ratios of multiple views of the hemolysin oligomer allowed us to apply Fourier common-line projection matching methods to determine the three-dimensional structure of Vibrio cholerae hemolysin. Three-dimensional structures of HlyA and HlyA50 were determined using EMAN software, which requires that a preliminary three-dimensional model be generated and then subjected to an interactive refinement procedure to generate the final structure. To generate this preliminary model, a set of reference free class averages needs to be generated from the particle data set. Figure 3A and B show the cryo-electron micrographs of HlyA and HlyA50 oligomers (arrows), respectively. The electron micrographs show that hemolysin oligomers were embedded in the thin ice layer at different orientation angles. Hemolysin particles were selected manually from each cryo-electron micrograph. The Refine2d.py program was used to determine heterogeneous particles. Only homogeneous particles were subjected to reference free class average determination, where particle images were allotted into different groups, followed by their different orientation angles. HlyA was classified into 92 class averages, whereas HlyA50 was classified into 132 class averages. Figure 3C and D show the class average and projection average images of boxed-out particles. Figure 3C shows the top view (by convention of EMAN software) of the 2D projection, class average, and raw particle images of HlyA oligomers. Figure 3D shows the side view (by convention of EMAN software) of 2D projection, class average, and raw particle images of HlyA oligomers. In each case, raw particles were approximately reassembled with class averages and 2D projection images. The top view of HlyA particles indicates that the HlyA particles were heptamers and that a central cavity was present. Figure 3E and F show the class average and projection average images of boxed-out particles. Figure 3E shows the top view of the 2D projection, class average, and raw particle images of HlyA50 oligomers. Figure 3F shows the side view of the 2D projection, class average, and raw particle images of HlyA50 oligomers. In both cases, raw particles were completely identical with the 2D projection images and 2D class averages. We performed 3D reconstruction of HlyA and HlyA50, using these class averages, raw particles, and 2D projection averages. Three-dimensional structures were calculated from the HlyA and HlyA50 single-particle data set with imposed C7 and no symmetry, respectively. Figure 4A and B show the 3D structures of HlyA and HlyA50 oligomers. Figure 4A (panels I to III) shows the top view, bottom view, and side view of HlyA. Figure 4B (panel I and II) shows the top and bottom views of the HlyA50 oligomer, whereas Fig. 4B, panels III to VI, show side views of HlyA50 at different (α = 90°) rotation angles with respect to the z axis. The molecular mass of the HlyA oligomer is about 455 kDa, corresponding to a 1.13 σ density threshold value. Like HlyA, with a 1.15 σ density threshold, the molecular mass of HlyA50 is about 350 kDa.
FIG. 3.
Cryo-electron microscopy and image analysis. (A) Cryo-electron micrograph of 65-kDa Vibrio cholerae hemolysin (HlyA) oligomer. Arrows show the HlyA oligomer. Bar = 100 nm. (B) Cryo-electron micrograph of 50-kDa Vibrio cholerae hemolysin (HlyA50) oligomer. Arrows show the HlyA50 oligomer. Bar = 100 nm. (C) Top view of different projection average, class average, and raw particle images of HlyA. The left column shows the projection averages, the middle column shows the class averages, and the right column shows the raw particle images. (D) Side view of different projection average, class average, and raw particle images of HlyA. The left column shows the projection averages, the middle column shows the class averages, and the right column shows the raw particle images. (E) Top view of different projection average, class average, and raw particle images of HlyA50. The left column shows the projection averages, the middle column shows the class average, and the right column shows the raw particle images. (F) Side view of different projection average, class average, and raw particle images of HlyA50. The left column shows the projection averages, the middle column shows the class averages, and the right column shows the raw particle images.
FIG. 4.
Three-dimensional structure of HlyA and HlyA50 oligomers. (A) Three-dimensional structure of HlyA after seven refinements. A top view of HlyA (I), bottom view of HlyA (II), and side view of HlyA (III) are shown. C7 symmetry was applied. The top view shows the ring-like structure, and the side view shows that seven holes are present beneath the ring structure. The top and bottom views of HlyA indicate that a central cavity is present in HlyA. (B) Three-dimensional structure of HlyA50 after seven refinements. Part I shows the top view of HlyA50, and part II is the bottom view of the HlyA50 oligomer. The top view shows that the structure of HlyA50 is completely irregular, and the top-bottom view indicates that a central cavity is present in the HlyA50 oligomer. The last four images (III to VI) are side views of HlyA50 at different rotational angles. The 3D structure was rotated along the z axis, and after a 90° rotation, one image was taken. The side views of HlyA50 show an irregular structure. (C) Internal structure of HlyA oligomer. A dumbbell-shaped internal channel is present in the HlyA oligomer. (D) Longitudinal slice of 3D structure of HlyA50. Bar, 50 Å.
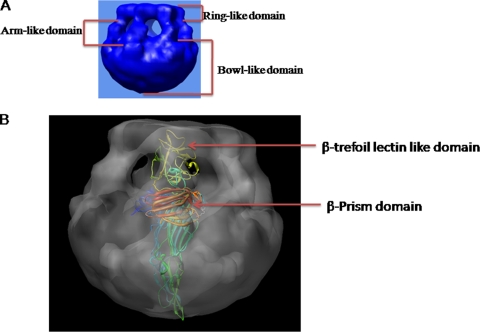
Details of the internal structure of the HlyA oligomer are revealed by a series of slices through the density map (Fig. 4C). Figure 4C shows the details of the internal structure of the side view of HlyA by a series of slices through the density map. An internal channel is present in all slices of the HlyA oligomer. The internal structure of HlyA clearly indicates that the internal channel goes from the top to the bottom of the 3D structure. The channel has two bulges instead of being cylindrical, and the internal channel of HlyA is dumbbell shaped. These internal structures clearly specify that HlyA has two distinct regions: a large bowl-like domain in the bottom region and a ring-like structure in the top region of the 3D structure (Fig. 4C; also see Fig. 9A). The section of HlyA clearly shows that the bowl-like domain is more compact (Fig. 4C) than the ring-like structure. A hollow space is present in the bowl-like domain (Fig. 4C) of HlyA. This bowl-like domain is connected with the ring-like domain through seven arm-like domains. Seven side openings are present in this arm-like domain of HlyA, which is present just underneath the ring-like domain (Fig. 4C; see Fig. 9A). Figure 4D shows the result of a series of longitudinal slices of the density of HlyA50. The internal structure of HlyA50 clearly shows that HlyA50 has a cylindrical jar-like structure (Fig. 4D). The internal structure of HlyA50 is more compact, and void space is absent. The internal structure also shows that HlyA50 has a central channel throughout the height of the 3D structure of the HlyA50 oligomer.
FIG. 9.
Model of pore-forming mechanism of 65-kDa hemolysin oligomer. (A) There are three main parts of the 3D structure of the 65-kDa HlyA oligomer. The top portion is the ring-like domain, the middle portion is the arm-like domain, and the bottom portion is the bowl-like domain. (B) X-ray crystallography structure fitted into the electron density map of the HlyA oligomer (side view). The β-trefoil lectin-like domain and the β-prism lectin are marked by arrows. The β-prism lectin domain is located in the junction of the arm-like and bowl-like domains in the 3D structure of the HlyA oligomer. The β-trefoil lectin-like domain is situated at the ring-like domain in the 3D structure of the HlyA oligomer.
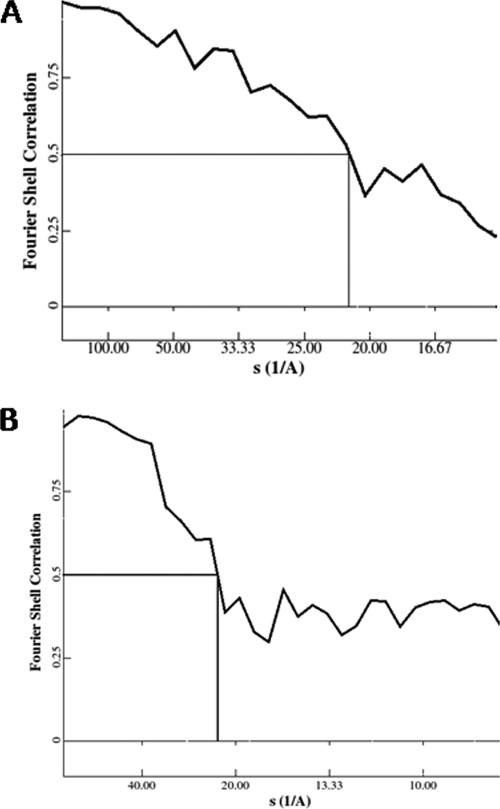
Figure 5 shows the FSC curve after iterative refinement of HlyA and HlyA50. After refinement, the resolution of the three-dimensional reconstruction was determined by the FSC curve. The 0.5 value for FSC indicates that the resolutions for HlyA and HlyA50 are 21.8 Å (Fig. 5A) and 22.2 Å (Fig. 5B), respectively. The interactive structure refinement converged after seven rounds of refinement in both cases.
FIG. 5.
Resolution determination of three-dimensional structure of hemolysin particle. (A) The thick line represents FSC after seven iterations of the 65-kDa hemolysin oligomer. The 0.5 FSC value indicates that the final resolution is 21.8 Å. (B) The thick line represents FSC after seven iterations of the 50-kDa hemolysin oligomer. The 0.5 FSC value indicates that the final resolution is 22.2 Å.
The top view of the 3D structure of HlyA indicates that a hole is present in the HlyA oligomer. The pore size in the 3D structure of HlyA was measured using Chimera software and was found to be 15 Å (Fig. 6B). Figure 6 shows that the diameter of the 3D structure of HlyA is 70 Å (Fig. 6A) and that the height of HlyA is 105 Å (Fig. 6C). The diameter of HlyA50 is 70 Å (Fig. 6E), which is the same as the diameter of HlyA (Fig. 6A). The internal diameter of the HlyA50 oligomer was also measured using Chimera software and was found to be 30 Å, which is two times as large as that of HlyA (Fig. 6F and G). The height of HlyA50 is 100 Å, which is 5 Å less than that of HlyA. The pore size at the bottom region of HlyA (Fig. 6D) is 12 Å, which is approximately two times smaller than the pore size (21 Å) at the bottom of the HlyA50 oligomer (Fig. 6H). This is due to the absence of the ring-like structure in the HlyA50 oligomer. The difference in height of HlyA and HlyA50 is apparently due to the absence of the ring-like structure in HlyA50 (Fig. 6E and F). Collectively, these data suggest significant differences in the configurations of the oligomers of HlyA and its truncated variant HlyA50.
FIG. 6.
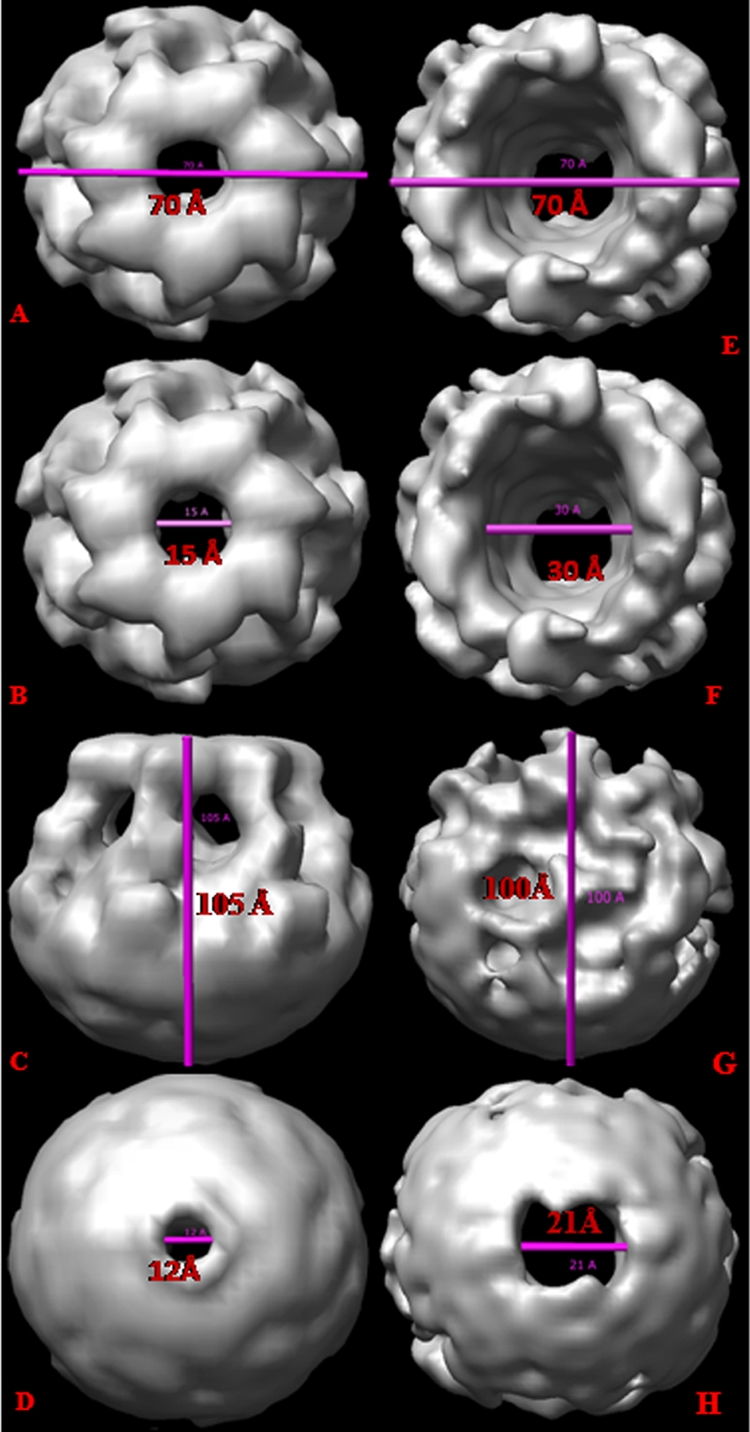
Determination of size of hemolysin. (A) The diameter of the ring-like structure of the HlyA oligomer is 70 Å. (B) The pore size of HlyA is 15 Å. (C) The height of HlyA is 105 Å. (D) The pore size of the bottom view of HlyA is 12 Å. (E) The diameter of the HlyA50 oligomer is 70 Å. (F) The pore size is 30 Å. (G) The height of HlyA50 is 100 Å. (H) The pore size of the bottom view of HlyA50 is 21 Å. The pore size of HlyA50 is two times larger than that of HlyA, and the height of HlyA50 is 5 Å less than that of HlyA.
Docking.
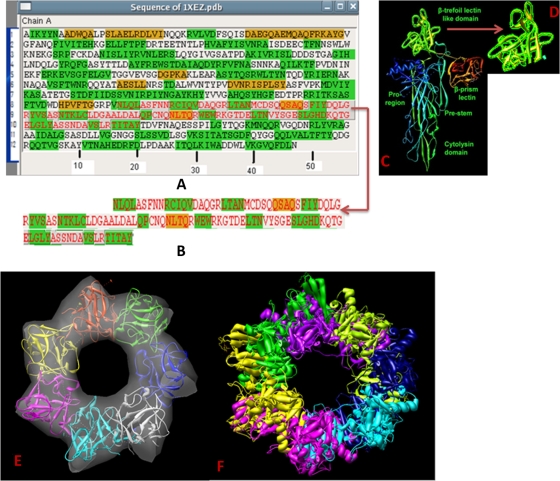
The atomic structure (PDB accession no. 1XEZ) (18) of HlyA was well fitted into the HlyA oligomer. A combination of automated and interactive docking was performed using the Chimera software package (20). Figure 7A shows the complete amino acid sequence of HlyA (PDB accession no. 1XEZ). Figure 7C shows the entire HlyA atomic structure, where the greenish-yellow part is the β-trefoil lectin-like domain (18). Figure 7D shows the only β-trefoil lectin-like domain of Vibrio cholerae hemolysin, which was cut from the whole atomic structure of HlyA. Figure 7B demonstrates the sequence of the β-trefoil lectin-like domain. The β-trefoil lectin-like domain was interactively fitted in the pinnacle segment of the electron density map of the HlyA oligomer. The average density value of the map is 0.932, and the correlation value is 0.823. Thus, the seven β-trefoil lectin-like domains of the atomic structure of HlyA are well fitted into the electron density map of the HlyA oligomer (Fig. 7E), which allowed us to build a reasonable model. Figure 7F shows how the atomic structure of HlyA interacts and forms an HlyA oligomer. One can infer the correctness of the 3D structure from the good fit of the atomic structure into the electron density map of the HlyA oligomer.
FIG. 7.
Fitting of the atomic structure into the electron microscopy density map of the HlyA oligomer. (A) Whole amino acid sequence of HlyA (1XEZ.pdb). (B) The β-trefoil lectin-like domain sequence was selected from the whole amino acid sequence of HlyA. The region of amino acids 408 to 524 is the β-trefoil lectin-like domain sequence. (C) Whole atomic structure of HlyA (1XEZ.pdb), with the β-trefoil lectin-like domain colored green. (D) Large view of β-trefoil lectin-like domain. (E) The β-trefoil lectin-like domain was fitted into the ring portion of the electron microscopy density map of HlyA. Seven differently colored β-trefoil lectin-like domains were fitted into the ring-like structure. (F) Seven X-ray crystallographic structures form the HlyA oligomer.
Difference between 65-kDa and 50-kDa hemolysin oligomers.
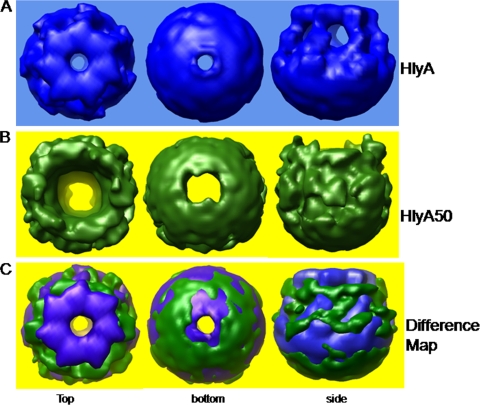
Figure 8A shows the top, bottom, and side views of the HlyA oligomer. Figure 8B shows the top, bottom, and side views of the HlyA50 oligomer. Figure 8C shows the difference map of HlyA and HlyA50 oligomers. The green part is the contribution of the 50-kDa hemolysin, whereas the blue part is the contribution of the 65-kDa hemolysin oligomer. The images in Fig. 8C clearly indicate that the HlyA oligomer is different from the HlyA50 oligomer. The first image in Fig. 8C demonstrates that HlyA has a ring-like structure in the upper segment but that HlyA50 has no ring-like structure in the top region. The side view of the HlyA oligomer is homogeneous and regular, whereas the side view of the HlyA50 oligomer is irregular and heterogeneous (third image in Fig. 8C). The pore size is also smaller in HlyA than in HlyA50.
FIG. 8.
Difference map between HlyA and HlyA50 oligomers. (A) Three-dimensional structure of the HlyA oligomer. (B) Three-dimensional structure of the HlyA50 oligomer. (C) Difference map between HlyA and HlyA50 oligomers. The left column is the top view, the middle column is the bottom view, and the right column is the side view. In this case, blue shows the contribution of the HlyA oligomer and green shows the contribution of the HlyA50 oligomer.
DISCUSSION
In the present study, we determined low-resolution three-dimensional structures by cryo-electron microscopy for the β-barrel heptamers of the two variants of HlyA, viz, the fully active 65-kDa mature toxin and the 1,000-fold less active 50-kDa toxin truncated at the C-terminal end by deletion of the β-prism lectin domain (18). The V. cholerae cytolysin is unique among PFTs in having lectin-like activity (21), though the mechanistic significance of interaction of the toxin with β1-galactosyl-terminated glycoconjugates in membrane binding and subsequent events leading to formation of a functional channel is not clear. Previously, we showed that HlyA is a surfactant-like molecule and binds nonspecifically to the target membrane or lipid vesicles by virtue of its surface amphipathicity (2). Truncation of the C-terminal domain drastically reduces the hemolytic activity, but intriguingly, neither the interaction of the toxin with target membranes nor its subsequent self-assembly to the β-barrel heptamer (31) is seriously impaired. So far, a high-resolution structure of the hemolytically inactive, 79-kDa prohemolysin and a low-resolution structure of the oligomer have been reported (18). In this background, the present study might be useful for identification of the structural parameters that might affect pore-forming activity of the V. cholerae toxin.
At a final resolution of 21.8 Å, the 65-kDa HlyA heptamer seemed to assume a bowl-like configuration with a sevenfold axis of symmetry (Fig. 4A and 9A). In striking contrast, the truncated HlyA50 variant, which bound avidly to synthetic and biomembrane vesicles and oligomerized quantitatively with a stoichiometry identical to that of the 65-kDa fully active toxin (31), generated a structure with distorted symmetry. Heptameric structures with sevenfold axes of symmetry have been observed by X-ray crystallography for several pore-forming toxins that form small β-barrel diffusion channels in the target membrane lipid bilayer, with diameters in the range of 1 to 2.5 nm, e.g., Staphylococcus aureus β-toxin (23, 24), anthrax toxin from Bacillus anthracis (19, 22, 24), the cell-vacuolating toxin from Helicobacter pylori (10), and aerolysin from Aeromonas hydrophila (25). Although V. cholerae HlyA does not share a high degree of amino acid sequence homology with these pore-forming toxins (18), it is striking that they have evolved a similar arrangement of monomers in the terminal, functionally active form of the molecule. Loss of the 15-kDa C-terminal β-prism lectin domain, which is not directly implicated in oligomerization or spanning the membrane bilayer in the high-resolution X-ray crystallographic structure of V. cholerae procytolysin (18), nevertheless induces a gross change in overall shape of the oligomer, with a concomitant loss of symmetry. Docking of the X-ray crystallographic structure (18) with the electron density map of HlyA indicates that the β-trefoil lectin domain is well accommodated in the ring-like domain of the oligomer (Fig. 7E). The β-prism lectin domain, on the other hand, seems to be located in the junction region of the arm-like and bowl-like domains of the oligomer (Fig. 9B). It is conceivable that the absence of this domain in the HlyA50 oligomer causes a change in the shape of the molecule.
Next, we address the question of whether the present study throws any light on the functional difference between HlyA and its truncated variant, HlyA50. The diameter of the diffusion channel in the 3D model of the HlyA oligomer was seen to be 1.5 nm (Fig. 6B), in agreement with data obtained from diffusion studies (6, 31); in comparison, the channel in the HlyA50 oligomer was significantly larger, with a diameter of 3.0 nm (Fig. 6F). Apparently, a wider channel should facilitate escape of cytosolic molecules and thereby increase the efficiency of causing lysis of the target cell by the truncated toxin. In other words, there is nothing in the overall shape of the two oligomers that would suggest a significantly reduced potential for pore formation by HlyA50 in comparison to HlyA.
It seems likely that the C-terminal β-prism lectin domain is the lone functional carbohydrate-binding domain of HlyA (18) that is involved in interaction of the toxin with a wide spectrum of carbohydrate ligands (21). As discussed above, interaction of HlyA with the target membrane is mediated predominantly by global amphipathicity of the toxin monomer (2), making it unlikely that deletion of the carbohydrate-binding domain causes a 1,000-fold decrease in specific hemolytic activity by a drastic decrease in affinity of the toxin for the membrane. The β-prism lectin domain lies close to the pre-stem-loop in the crystallographic model of the protoxin monomer (18) and at the junction of the arm-like and bowl-like domains in the 3D model of the HlyA oligomer (Fig. 9B). The location of the domain in the oligomer in a region close to the membrane-spanning domain might enable it to interact with the components of the bilayer core rather than with cell surface receptors. Although the molecular basis of this interaction remains obscure, it seems to be in a correct orientation to positively regulate insertion of the toxin into the bilayer core to generate a functional diffusion channel.
Acknowledgments
We gratefully acknowledge financial assistance from the CSIR, Government of India [grant 37 (1238)/05/EMR-II].
We thank Steven J. Ludtke for his kind help with EMAN software.
S.D. performed research, analyzed data, and wrote the paper. B.M. performed research. K.K.B. and A.N.G. designed research, performed research, analyzed data, and wrote the paper.
No author has any financial interest related to this work.
Footnotes
Published ahead of print on 23 October 2009.
REFERENCES
- 1.Bottcher, B., S. A. Wynne, and R. A. Crowther. 1997. Determination of the fold of the core proteins of hepatitis B virus by electron cryomicroscopy. Nature 386:88-91. [DOI] [PubMed] [Google Scholar]
- 2.Chattapadhyay, K., D. Bhattacharyya, and K. K. Banerjee. 2002. Vibrio cholerae hemolysin: implication of amphiphilicity and lipid-induced conformational change for its pore-forming activity. Eur. J. Biochem. 269:4351-4358. [DOI] [PubMed] [Google Scholar]
- 3.Finkelstein, R. A., and F. Dorner. 1985. Cholera enterotoxin (choleragen). Pharmacol. Ther. 27:37-47. [DOI] [PubMed] [Google Scholar]
- 4.Goddard, T. D., C. C. Huang, and T. E. Ferrin. 2005. Software extensions to UCSF Chimera for interactive visualization of large molecular assemblies. Structure 13:473-482. [DOI] [PubMed] [Google Scholar]
- 5.Goldberg, S. L., and J. R. Murphy. 1984. Molecular cloning of the hemolysin determinant from Vibrio cholerae El Tor. J. Bacteriol. 160:239-244. [DOI] [PMC free article] [PubMed] [Google Scholar]
- 6.Harris, J. R., S. Bhakdi, U. Meissner, D. Scheffler, R. Bittman, G. Li, A. Zitzer, and M. Palmer. 2002. Interaction of the Vibrio cholerae cytolysin (VCC) with cholesterol, some cholesterol esters, and cholesterol derivatives: a TEM study. J. Struct. Biol. 139:122-135. [DOI] [PubMed] [Google Scholar]
- 7.Heuck, A. P., R. K. Tweten, and A. E. Johnson. 2001. β-Barrel pore-forming toxins: intriguing dimorphic proteins. Biochemistry 40:9065-9073. [DOI] [PubMed] [Google Scholar]
- 8.Ikigai, H., T. Ono, T. Nakae, H. Otsuru, and T. Shimamura. 1999. Two forms of Vibrio cholerae O1 El Tor hemolysin derived from identical precursor protein. Biochim. Biophys. Acta 1415:297-305. [DOI] [PubMed] [Google Scholar]
- 9.Kaper, J. B., J. G. Morris, and M. M. Levine. 1995. Cholera. Clin. Microbiol. Rev. 8:48-86. [DOI] [PMC free article] [PubMed] [Google Scholar]
- 10.Lanzavecchia, S., P. L. Bellon, P. Lupetti, R. Dallai, R. Rappuoli, and J. L. Telford. 1998. Three-dimensional reconstruction of metal replicas of the Helicobacter pylori vacuolating cytotoxin. J. Struct. Biol. 121:9-18. [DOI] [PubMed] [Google Scholar]
- 11.Ludtke, S. J., D. H. Chen, J. L. Song, D. T. Chuang, and W. Chiu. 2004. Seeing GroEL at 6 Å resolution by single particle electron cryomicroscopy. Structure 12:1129-1136. [DOI] [PubMed] [Google Scholar]
- 12.Ludtke, S. J., J. Jacana, J. L. Song, D. T. Chuang, and W. Chiu. 2001. A 11.5 Å single particle reconstruction of GroEl using EMAN. J. Mol. Biol. 314:82-97. [DOI] [PubMed] [Google Scholar]
- 13.Ludtke, S. J., P. R. Baldwin, and W. Chiu. 1999. EMAN: semiautomated software for high-resolution single-particle reconstructions. J. Struct. Biol. 128:82-97. [DOI] [PubMed] [Google Scholar]
- 14.Montoya, M., and E. Gouaux. 2003. β-Barrel membrane protein folding and structure viewed through the lens of α-hemolysin. Biochim. Biophys. Acta 1609:19-27. [DOI] [PubMed] [Google Scholar]
- 15.Nagamune, K., K. Yamamoto, A. Naka, J. Matsuyama, T. Miwatani, and T. Honda. 1996. In vitro proteolytic processing and activation of the recombinant precursor of El Tor cytolysin/hemolysin (pro-HlyA) of Vibrio cholerae by soluble hemagglutinin/protease of V. cholerae, trypsin, and other proteases. Infect. Immun. 64:4655-4658. [DOI] [PMC free article] [PubMed] [Google Scholar]
- 16.Ojcius, D. M., and J. D. Young. 1991. Cytolytic pore-forming proteins and peptides: is there a common structural motif? Trends Biochem. Sci. 16:225-228. [DOI] [PubMed] [Google Scholar]
- 17.Olson, R., and E. Gouaux. 2003. Vibrio cholerae cytolysin is composed of an alpha-hemolysin-like core. Protein Sci. 12:379-383. [DOI] [PMC free article] [PubMed] [Google Scholar]
- 18.Olson, R., and E. Gouaux. 2005. Crystal structure of the Vibrio cholerae cytolysin (VCC) pro-toxin and its assembly into a heptameric transmembrane pore. J. Mol. Biol. 350:997-1016. [DOI] [PubMed] [Google Scholar]
- 19.Petosa, C., R. J. Collier, K. R. Klimpel, S. H. Leppla, and R. C. Liddington. 1997. Crystal structure of the anthrax toxin protective antigen. Nature 385:905-908. [DOI] [PubMed] [Google Scholar]
- 20.Pettersen, E. F., T. D. Goddard, C. C. Huang, G. S. Couch, D. M. Greenblatt, E. C. Meng, and T. E. Ferrin. 2004. UCSF Chimera—a visualization system for exploratory research and analysis. J. Comput. Chem. 25:1605-1612. [DOI] [PubMed] [Google Scholar]
- 21.Saha, N., and K. K. Banerjee. 1997. Carbohydrate-mediated regulation of interaction of Vibrio cholerae hemolysin with erythrocyte and phospholipid vesicle. J. Biol. Chem. 272:162-167. [DOI] [PubMed] [Google Scholar]
- 22.Santelli, E., L. A. Bankston, S. H. Leppla, and R. C. Liddington. 2004. Crystal structure of a complex between anthrax toxin and its host cell receptor. Nature 430:905-908. [DOI] [PubMed] [Google Scholar]
- 23.Song, L., M. R. Hobaugh, C. Shustak, C. Cheley, H. Bayley, and J. E. Gouaaux. 1996. Structure of staphylococcal alpha-hemolysin, a heptameric transmembrane pore. Science 274:1859-1866. [DOI] [PubMed] [Google Scholar]
- 24.Tilley, S. J., and H. R. Saibil. 2006. The mechanism of pore formation by bacterial toxins. Curr. Opin. Struct. Biol. 16:230-236. [DOI] [PubMed] [Google Scholar]
- 25.Wilmsen, H. U., K. R. Leonard, W. Tichelaar, J. T. Buckley, and F. Pattus. 1992. The aerolysin membrane channel is formed by heptamerization of the monomer. EMBO J. 11:2457-2463. [DOI] [PMC free article] [PubMed] [Google Scholar]
- 26.Wilson, M., R. McNab, and B. Henderson. 2002. Bacterial disease mechanisms: an introduction to cellular microbiology, p. 466-513. Cambridge University Press, Cambridge, United Kingdom.
- 27.Yamamoto, K., M. Al-Omani, T. Honda, Y. Takeda, and T. Miwatani. 1984. Non-O1 Vibrio cholerae hemolysin: purification, partial characterization, and immunological relatedness to El Tor hemolysin. Infect. Immun. 45:192-196. [DOI] [PMC free article] [PubMed] [Google Scholar]
- 28.Yamamoto, K., Y. Ichinose, H. Shinagawa, K. Makino, A. Nakata, M. Iwanaga, T. Honda, and T. Miwatani. 1990. Two-step processing for activation of the cytolysin/hemolysin of Vibrio cholerae O1 biotype El Tor: nucleotide sequence of the structural gene (hlyA) and characterization of the processed products. Infect. Immun. 58:4106-4116. [DOI] [PMC free article] [PubMed] [Google Scholar]
- 29.Zitzer, A., I. Walev, M. Palmer, and S. Bhakdi. 1995. Characterization of Vibrio cholerae El Tor cytolysin as an oligomerizing poreforming toxin. Med. Microbiol. Immunol. 184:37-44. [DOI] [PubMed] [Google Scholar]
- 30.Zitzer, A., J. R. Harris, S. E. Kemminer, O. Zitzer, S. Bhakdi, J. Muething, and M. Palmer. 2000. Vibrio cholerae cytolysin: assembly and membrane insertion of the oligomeric pore are tightly linked and are not detectably restricted by membrane fluidity. Biochim. Biophys. Acta 1509:264-274. [DOI] [PubMed] [Google Scholar]
- 31.Zitzer, A., O. Zitzer, S. Bhakdi, and M. Palmer. 1999. Oligomerization of Vibrio cholerae cytolysin yields a pentameric pore and has a dual specificity for cholesterol and sphingolipids in the target membrane. J. Biol. Chem. 274:1375-1380. [DOI] [PubMed] [Google Scholar]


