Abstract
Gap junction intercellular communication in osteocytes plays an important role in bone remodeling in response to mechanical loading; however, the responsible molecular mechanisms remain largely unknown. Here, we show that phosphoinositide-3 kinase (PI3K)/Akt signaling activated by fluid flow shear stress and prostaglandin E2 (PGE2) had a stimulatory effect on both connexin 43 (Cx43) mRNA and protein expression. PGE2 inactivated glycogen synthase kinase 3 (GSK-3) and promoted nuclear localization and accumulation of β-catenin. Knockdown of β-catenin expression resulted in a reduction in Cx43 protein. Furthermore, the chromatin immunoprecipitation (ChIP) assay demonstrated an association of β-catenin with the Cx43 promoter, suggesting that β-catenin could regulate Cx43 expression at the level of gene transcription. We have previously reported that PGE2 activates cyclic AMP (cAMP)-protein kinase A (PKA) signaling and increases Cx43 and gap junctions. Interestingly, the activation of PI3K/Akt appeared to be independent of the activation of PKA, whereas both PI3K/Akt and PKA signaling inactivated GSK-3 and increased β-catenin translocation. Together, these results suggest that shear stress, through PGE2 release, activates both PI3K/Akt and cAMP-PKA signaling, which converge through the inactivation of GSK-3, leading to the increase in nuclear accumulation of β-catenin. β-Catenin binds to the Cx43 promoter, stimulating Cx43 expression and functional gap junctions between osteocytes.
Gap junction-mediated intercellular communication has been proposed to play a role in determining the set point for the bone mechanostat (31). Osteocytes dispersed throughout the mineralized matrix connect to neighboring osteocytes via their extensive network of long, slender cell processes. The cell processes of osteocytes are connected to each other and to the cells at the bone surface through gap junctions (30). Gap junctions are transmembrane channels that connect the cytoplasm of two adjacent cells. These channels permit molecules with molecular masses of less than 1 kDa, such as small metabolites, ions, and intracellular signaling molecules (i.e., calcium, cyclic AMP [cAMP], and inositol triphosphate), to pass through (49). These channels have been demonstrated to be important in modulating cell and tissue functions in many organs (19). Gap junction channels are formed by members of a family of proteins known as connexins (21). Morphological proof of the existence of gap junction structures and the expression of connexins has been obtained for osteocytes (13, 27, 32, 38). Connexin 43 (Cx43) is localized on the membranes of both the cell body and dendritic processes of osteocytes (25).
Osteocytes are deeply embedded in the mineralized bone matrix and are not readily accessible for many experimental approaches. An osteocyte-like cell line, MLO-Y4, has been shown to have characteristics of primary osteocytes (27). We and others have shown that MLO-Y4 cells are functionally coupled by gap junction channels and that Cx43 is a major gap junction protein expressed in primary osteocytes and MLO-Y4 cells (8, 23, 27, 36, 45, 47). Mechanical forces applied to bone cause fluid to flow through the canaliculi surrounding the osteocyte, and that fluid flow shear stress releases prostaglandins and other bone modulators (40) required for bone modeling and remodeling.
Prostaglandins are generally regarded as skeletal anabolic agents, since administration of these agents can increase bone mass in various animal species (4, 11, 23, 28), stimulate bone formation in vitro (40), and increase bone nodule formation in rat calvarial osteoblast cultures (12, 17, 36). Prostaglandins also have catabolic effects on bone and have been shown to stimulate osteoclastic bone resorption and osteoclast formation and activation (11, 12, 26, 40, 41). Prostaglandin E2 (PGE2) has also been shown to stimulate gap junction function and Cx43 expression in osteoblast-like cells (10). We have previously reported that the increase of gap junction-mediated intercellular communication and Cx43 expression in MLO-Y4 cells in response to fluid flow shear stress was mediated through the released PGE2 (7, 8). In these studies, we have shown that either inhibition of PGE2 production or depletion of PGE2 from fluid flow conditioned medium significantly abolish the increase of Cx43 induced by fluid flow shear stress, suggesting that PGE2 released by fluid flow is a primary factor in promoting Cx43 expression. We have also shown that the expression of the PGE2 receptor subtype EP2 is increased in response to fluid flow and mediates the autocrine effects of PGE2. As a result, there is an increase in intracellular cAMP and activation of protein kinase A (PKA), which in turn promotes gap junction-mediated communication in osteocytes (9).
However, the molecular mechanism of how Cx43 and gap junctions are stimulated upon PGE2 action was unknown. In this report, we show that nuclear β-catenin activated through the inactivation of glycogen synthase kinase 3 (GSK-3) by PGE2-induced phosphoinositide-3 kinase (PI3K)/Akt and cAMP-PKA signaling stimulates Cx43 expression and gap junction communication between osteocytes. β-Catenin, for the first time, is demonstrated to act as a direct regulator in transcriptional regulation of Cx43 expression.
MATERIALS AND METHODS
Materials.
Tissue culture medium, protein and RNA standards, Superscript II reverse transcriptase, and Taq DNA polymerase were purchased from Invitrogen (Carlsbad, CA); fetal bovine serum (FBS) and calf serum (CS) were from HyClone Laboratories (Logan, UT); rat tail collagen type I, 99% pure, was from Becton Dickinson Laboratories (Bedford, MA); rhodamine dextran (RD) (Mr, 10,000) and Lucifer yellow (LY) (Mr, 457) were from Molecular Probes (Eugene, OR); Tri Reagent was from Molecular Research Center (Cincinnati, OH); paraformaldehyde (16% stock solution) was from Electron Microscopy Science (Fort Washington, PA); nitrocellulose membrane was from Schleicher & Schuell (Keene, NH); polyester sheets used for fluid flow assays were from Regal Plastics (San Antonio, TX); the bicinchoninic acid microprotein assay kit was from Pierce Chemical (Rockford IL); the enhanced chemiluminescence (ECL) kit was from Amersham Biosciences (Piscataway, NJ); PD98059 and protein kinase inhibitor (PKI) (protein kinase A inhibitor 14-22 amide, cell permeable, myristoylated) were from Calbiochem (Princeton, NJ); X-OMAT AR films were from Eastman Kodak (Rochester, NY); and PGE2 was from Cayman Chemicals (Ann Arbor MI). All other chemicals were from either Sigma (St. Louis, MO) or Fisher Scientific (Pittsburgh, PA).
Cell culture.
MLO-Y4 cells were cultured on collagen-coated (rat tail collagen type I; 0.15 mg/ml) surfaces. Cells were grown in alpha-modified essential medium (MEM) supplemented with 2.5% FBS and 2.5% CS and incubated in a 5% CO2 incubator at 37°C as described previously (27).
“Scrape-loading” dye transfer assay.
The “scrape-loading” dye transfer assay is an assay used to measure the biological activity/connectivity of gap junctions. MLO-Y4 cells were grown to approximately 75 to 85% confluence. The “scrape-loading” dye transfer assay was performed based on the modified procedure described by El-Fouly and coworkers (14). In this method, cells were scratched in the presence of two types of fluorescence dyes: LY (Mr, 457,000), which can penetrate through gap junction channels, and RD (Mr, 10,000), which is too large to pass through the channels, thus serving as a tracer dye for the cells originally receiving the dye. Cells were washed three times with Hanks balanced salt solution (HBSS) plus 1% bovine serum albumin (BSA); then 1% LY and 1% RD dissolved in phosphate-buffered saline (PBS) were applied to the cells, which subsequently were scraped lightly with a 26-gauge needle. After incubation for 10 min, cells were washed with HBSS three times and then with PBS twice and finally were fixed in fresh 2% paraformaldehyde for 20 min. The dye transfer results were examined using a fluorescence microscope (Zeiss Axioscope; Zeiss, Jena, Germany), in which LY could be detected using the filter set for fluorescein and RD using the filter set for rhodamine. To reach statistical significance, more than 500 cells receiving RD were counted for each assay.
Western blotting.
Immunoblotting analyses were conducted as previously described (9). Affinity-purified rabbit polyclonal anti-Cx43 antibody generated in our laboratory as previously described (1:300 dilution) (22), mouse monoclonal anti-β-actin (1:5,000 dilution) (Sigma), rabbit polyclonal anti-Akt antibody (1:1,000 dilution), mouse monoclonal anti-phospho-Akt (Ser473) antibody (1:1,000 dilution), rabbit polyclonal anti-phospho-Akt (Thr308) antibody (1:1,000 dilution), rabbit polyclonal anti-p44/42 mitogen-activated protein kinase (MAPK) antibody (1:1,000 dilution), mouse monoclonal anti-phospho-p44/42 MAPK antibody (1:1,000 dilution), rabbit polyclonal anti-phospho-GSK-3α/β antibody (1:1,000 dilution) (Cell Signaling, Danvers, MA), mouse monoclonal anti-GSK-3β antibody (1:1,000 dilution) (BD Biosciences), mouse monoclonal antibody raised against β-catenin (E5) amino acid residues 680 to 780 at the C terminus of β-catenin (1:200 dilution) (Santa Cruz Biotechnology, Santa Cruz, CA), rabbit polyclonal antibody against a synthetic peptide corresponding to the consensus GSK-3 phosphorylation site of β-catenin (amino acids 29 to 49) (1:1,000 dilution) (Upstate Biotechnology), and goat polyclonal anti-lamin B (C-20) antibody (1:200 dilution) (Santa Cruz) were used. Primary antibodies were detected using peroxidase-conjugated secondary anti-rabbit, anti-goat, or anti-mouse antibody followed by use of a chemiluminescence reagent kit (ECL) according to the manufacturer's instructions. The membranes were exposed to X-OMAT AR films and detected by fluorography.
RT-PCR.
Total RNA was isolated from the cultures of MLO-Y4 cells using Tri Reagent according to the manufacturer's instructions. For reverse transcription-PCR (RT-PCR) analyses, cDNA was synthesized from 5 μg of the total RNA in a 20-μl reaction mixture containing 1× first-strand buffer (20 mM Tris-HCl, 50 mM KCl, 25 mM MgCl2, pH 8.4), 500 μM deoxynucleoside triphosphates, 10 mM dithiothreitol, 50 ng random primers, and 280 units of Superscript II reverse transcriptase. cDNA (0.2%) was amplified by using PCR in a 50-μl reaction mixture containing 1× PCR buffer, 10 nM 5′ and 3′ primers, 200 μM deoxynucleoside triphosphates, 1 mM MgCl2, and 2.5 units of Taq DNA polymerase. Amplification of DNA was conducted in a DNA Thermal Cycler (Techne) for 20, 25, 30, 35, and 40 cycles following the reaction profile of 94°C for 30 s, 60°C for 30 s, and 72°C for 30 s. From preliminary experiments, we determined that the linear range of the PCR cycles versus products between 20 and 30 cycles is optimal (data not shown). The data presented in Fig. 1C and D were generated from 25 thermal cycles of PCRs. The primers for Cx43 were 5′-TACCACGCCACCACCGGCCCA-3′ (sense) and 5′-GGCATTTTGGCTGTCGTCAGGGAA-3′ (antisense), and those for β-actin were 5′-CGGGACCTGACAGACTACCTC-3′ (sense) and 5′-CACATCTGCTGGAAGGTGGACA-3′ (antisense).
FIG. 1.
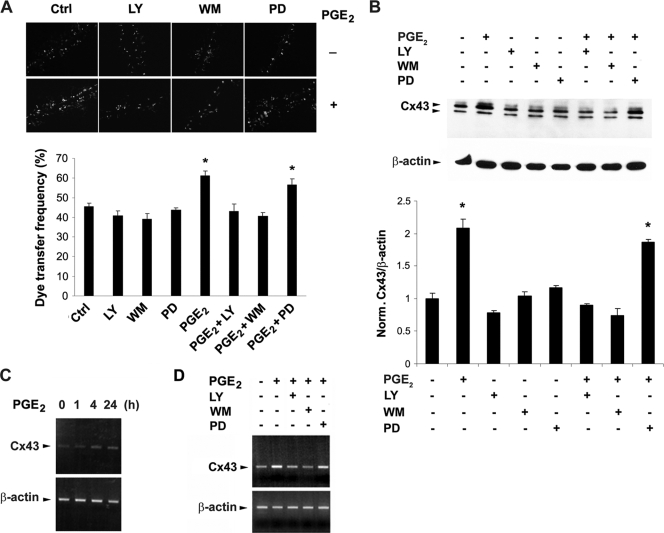
The increase of gap junctional coupling and Cx43 expression caused by PGE2 is mediated by PI3K/Akt but not MAPK signaling. (A) The PGE2-induced increase of intercellular coupling were inhibited by PI3K/Akt but not MAPK signaling inhibitors. MLO-Y4 cells were treated with vehicle or PGE2 (5 μM) in the presence or absence of LY294002 (LY) (5 μM), wortmannin (WM) (100 nM), or PD98059 (PD) (50 μM) for 16 h. Scrape-loading dye transfer experiments were performed to analyze the intercellular coupling of cells (upper panel). As described previously (8), the y axis represents the dye transfer frequency, which is defined as the percentage of RD-receiving cells that form gap junction channels (lower panel). The number was determined by counting the numbers of RD-receiving cells (>500), as monitored by rhodamine fluorescence, and dividing by the numbers of nondisrupted surrounding cell groups that can be coupled, as monitored by LY fluorescence. PGE2 and PGE2 plus PD versus controls and other treatment: *, P < 0.05. The data are presented as mean ± SEM (n = 3). (B) The increased expression of Cx43 protein in response to PGE2 is inhibited by PI3K/Akt but not MAPK signaling inhibitors. MLO-Y4 cells were treated with vehicle or PGE2 (5 μM) in the presence or absence of LY294002 (LY) (5 μM), wortmannin (WM) (100 nM), or PD98059 (PD) (50 μM) for 16 h. The cell lysates were immunoblotted with affinity-purified anti-Cx43 or anti-β-actin antibody. The normalized ratio of Cx43 to β-actin from densitometric measurements of three separate Western blots is presented in lower panel. PGE2 and PGE2 plus PD versus controls and other treatment: *, P < 0.05. The data are presented as mean ± SEM (n = 3). (C) Time-dependent increase of Cx43 mRNA caused by PGE2. MLO-Y4 cells were treated with PGE2 (5 μM) for 0, 1, 4, or 24 h. RT-PCR experiments were performed using DNA primers specific for Cx43 or β-actin. (D) The PGE2-induced increased level of Cx43 mRNA is inhibited by PI3K/Akt but not MAPK signaling inhibitors. MLO-Y4 cells were treated with PGE2 (5 μM) for 24 h in the presence of LY294002 (LY) (5 μM), wortmannin (WM) (100 nM), or PD98059 (PD) (50 μM). RT-PCR experiments were performed using DNA primers specific for Cx43 and β-actin.
Immunofluorescence labeling and fluorescence microscopy.
The cells cultured on the microscopic slides were washed three times for 5 min each with PBS. This was followed by fixation in 2% paraformaldehyde in PBS for 30 min at room temperature, after which the cells were washed three times with PBS for 5 min each, followed by incubation for 30 min in blocking solution containing 2% normal goat serum, 2% fish skin gelatin, and 1% bovine serum albumin in PBS. They were then incubated overnight at 4°C with rabbit polyclonal anti-active β-catenin or anti-total β-catenin antibody diluted in blocking solution (1:200 dilution). Cells were washed three times (5 min for each wash) with PBS and then incubated for 1 h with rhodamine-conjugated goat anti-mouse immunoglobulin G (IgG) (H+L) conjugate diluted in blocking solution (Zymed) (1:250 dilution). Fluorescence microscopy was performed using an Olympus B-MAX microscope (Olympus, Tokyo, Japan), and results were recorded on a “Spot II” digital camera (Diagnostic Instruments, Tokyo, Japan). For dye transfer results, LY was detected using the filter set for fluorescein and RD by using the filter set for rhodamine.
siRNA knockdown.
MLO-Y4 cells were transiently transfected with small interfering RNA (siRNA) oligonucleotides (20 nM) by using siPORT amine transfection agent (Ambion, Austin, TX). Silencer oligonucleotides against β-catenin and the negative control were purchased from Ambion. The reduction of protein levels was analyzed by Western blotting at 48 h after transfection.
Cell shear stress induced by fluid flow.
Fluid flow experiments were performed as described previously (8, 9). MLO-Y4 cells were cultured on collagen-coated surfaces. The wall shear stress experienced by cells in these chambers was directly related to the flow rate of the circulating medium through the channel and inversely related to the square of the channel height. Flow was gravity driven, and the rate was governed by the height of separation between the upper and lower medium reservoirs using a peristaltic pump (Cole-Parmer Instrument, Chicago, IL) to return medium to the upper reservoir. The flow rate was continuously monitored with an in-line flowmeter (Cole-Parmer Instrument, Vernon Hills, IL). Using this flow system, wall shear stress levels caused by a steady laminar flow of 16 dynes/cm2 were generated by adjusting the channel height (using spacers) and medium flow rate (1 to 1.8 ml/s). The circulating medium was identical to the culture medium. The entire flow system was housed within a large walk-in CO2 incubator to maintain the circulating medium and the cell environment at 37°C and pH 7.4.
ChIP.
Chromatin immunoprecipitation (ChIP) assay was performed using a chromatin immunoprecipitation assay kit (Upstate). Briefly, MLO-Y4 cells were treated with PGE2 (5 μM) for 4 h and fixed in 1% formaldehyde for 10 min at 37°C. Cells were washed twice using ice-cold PBS, collected into a conical tube, and centrifuged for 5 min at 2,000 rpm at 4°C. The cell pellet (∼1 × 10⁶ cells) was resuspend in 200 μl SDS lysis buffer (1% SDS, 10 mM EDTA, 50 mM Tris, pH 8.0), incubated for 10 min on ice, and sonicated to shear DNA between 200- and 1,000-bp fragments. The sheared samples were centrifuged for 10 min at 13,000 rpm at 4°C, and the supernatant was transferred to a new 2-ml microcentrifuge tube and resuspended with 1.8 ml dilution buffer (0.01% SDS, 1% Triton X-100, 1.2 mM EDTA, 16.7 mM Tris-HCl [pH 8.0], 167 mM NaCl). The 2-ml diluted cell supernatant was precleared with 75 μl of protein A-agarose-salmon sperm DNA (1.5 ml protein A agarose containing 600 μg sonicated salmon sperm DNA, 1.5 mg BSA, and 4.5 mg protein A) for 30 min at 4°C. Agarose was pelleted by brief centrifugation and the supernatant fraction was collected, to which anti-active β-catenin antibody (3 μg), IgG (3 μg), Pol II (3 μg) (Santa Cruz), TCF4 (3 μg) (Santa Cruz), or LEF1 (3 μg) (Santa Cruz) was added and incubated overnight at 4°C. Immune complexes were captured with 60 μl of protein A agarose-salmon sperm DNA for 1 h at 4°C. The beads were collected by centrifugation and washed as follows: once with low-salt wash buffer (0.1% SDS, 1% Triton X-100, 2 mM EDTA, 20 mM Tris-HCl [pH 8.0], 150 mM NaCl)), once with high-salt wash buffer (0.1% SDS, 1% Triton X-100, 2 mM EDTA, 20 mM Tris-HCl [pH 8.0], 500 mM NaCl), once with LiCl wash buffer (0.25 mM LiCl, 1% NP-40, 1% deoxycholic acid, 1 mM EDTA, 10 mM Tris-HCl [pH 8.0]), and twice with TE buffer (10 mM Tris-HCl [pH 8.0], 1 mM EDTA). DNA-β-catenin complexes were eluted from the beads by adding 250 μl freshly prepared elution buffer (0.1% SDS, 1 mM EDTA, pH 8.0), and the elution was repeated one more time. Eluates were pooled, supplemented with 20 μl 5 M NaCl, and heated at 65°C for 4 h to reverse cross-linking reactions, followed by addition of 10 μl of 0.5 M EDTA, 20 μl 1 M Tris-HCl (pH 6.5), and 2 μl of 10 mg/ml proteinase K and incubation for 1 h at 45°C. DNA was recovered by phenol-chloroform extraction and ethanol precipitation, and pellets were resuspended in H2O for PCR. Primers specific for the mouse Cx43 promoter were 5′-TTCAATTCCCAGCAACCACAT-3′ (sense) and 5′-GCCGAAGCACCCTCTCACTA-3′ (antisense), corresponding to nucleotide positions −1531 to −1510 and −1225 to −1205, respectively, with respect to the transcription start site of Cx43. Primers for the RNA Pol II binding region on the Cx43 promoter were 5′-CTCGCCAGCCTCCACTCCA-5′ (sense) and 5′-CACGCCTTTCCCCCAATGA-3′ (antisense), corresponding to nucleotide positions −98 to −80 and +56 to +74, respectively, with respect to the transcription start site of Cx43.
Luciferase assay.
Plasmids pGL2-Basic, pCx1686-Luc and pRSVβgal were kindly provided by Stephen J. Lye (University of Toronto). On day 1, MLO-Y4 cells were plated at 7,500 cells/cm2 in a 24-well plate. For the β-catenin siRNA experiment, on day 1 cells were transiently transfected with siRNA oligonucleotides (20 nM) by using siPORT amine transfection agent. On day 2, cells were transfected with 0.8 μg of luciferase construct and 0.2 μg of pRSVβgal vector using 5 μl SuperFect transfection reagent (Qiagen) according to the product protocol. On day 3, cells were treated with PGE2 at 5 μM for 0, 2, 4, 8, and 24 h. Cells were then washed with PBS and harvested in 100 μl of reporter lysis buffer (Promega). The luciferase activity of the cell lysates was determined using Luciferin reagent (Promega) according to the manufacturer's protocol. Luminescence was measured for 10 s using a luminometer (microtiter plate luminometer; Dynex Technologies). Transfection efficiency was determined by analyzing β-galactosidase (β-Gal) activity using a β-Gal assay kit (Invitrogen) and was used to normalize luciferase activity.
Statistical analysis.
Data were analyzed using one-way analysis of variance (ANOVA) and the Bonferroni comparison test with the Instat biostatistics program (GraphPad software). Data are presented as the means ± standard errors of the means (SEM) of three determinations. Asterisks indicate the degrees of significant differences compared with the controls (*, P < 0.05; **, P < 0.01; ***, P < 0.001).
RESULTS
PGE2 stimulates gap junction function and Cx43 expression via activation of the PI3K/Akt signaling pathway in osteocytes.
As we have observed previously (7), PGE2 promotes gap junction intercellular coupling and Cx43 phosphorylation and protein expression (Fig. 1). PGE2 has been reported to activate PI3K/Akt and MAPK signaling mechanisms in other cell systems (18, 24). To determine if these pathways are active in the osteocyte response to PGE2, the PI3K inhibitors LY294002 and wortmannin and the MAPK inhibitor PD98059 were tested. Whereas the MAPK inhibitor had no effect, both PI3K inhibitors significantly inhibited gap junction intercellular coupling as determined by the scrape-loading dye transfer assay (Fig. 1A). Analogously, the upregulation of Cx43 protein levels by PGE2 was significantly blocked by PI3K but not by MAPK inhibitors (Fig. 1B), suggesting that the increase of gap junction communication by PGE2 is a likely result of increased Cx43 protein levels. RT-PCR shows that PGE2 increased Cx43 mRNA gradually over 24 h (Fig. 1C), and this increase was also inhibited by PI3K inhibitors LY294002 and wortmannin but not by MAPK inhibitor PD98059 (Fig. 1D). These results suggest that PI3K/Akt signaling is responsible for the increased activity of gap junctions and Cx43 upon PGE2 application and that this increase is likely to be regulated at the level of Cx43 transcription.
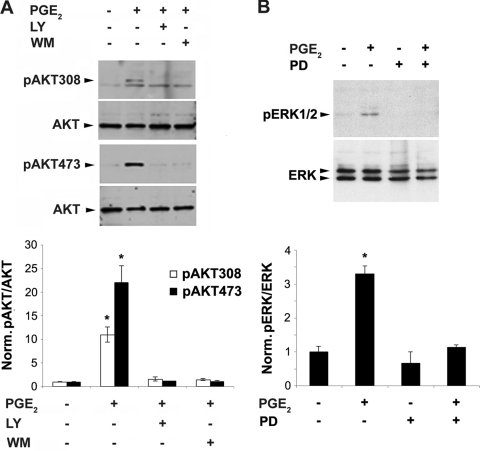
PGE2 induced the activation of the PI3K signaling downstream effector Akt, as indicated by the phosphorylation at both Thr308 and Ser473 sites (Fig. 2A). PGE2 also activated MAPK signaling as indicated by ERK1/2 phosphorylation (Fig. 2B). This activation was shown to be specific through the use of two PI3K inhibitors, LY294002 and wortmannin, and a MAPK inhibitor, PD98059, respectively. The activation was quantified, and significance is shown in the lower panels of Fig. 2. These results show that PGE2 activation of MAPK occurs but is not responsible for gap junction function, Cx43 expression, or modification.
FIG. 2.
MAPK signaling is activated through phosphorylation of pERK1/2 by PGE2, as is activation of PI3K signaling through Akt phosphorylation. (A) MLO-Y4 cells were pretreated with either vehicle, LY294002 (LY) (5 μM), or wortmannin (WM) (100 nM) for 15 min, followed by incubation of PGE2 (5 μM) for 1 h. Cell lysates were immunoblotted with anti-Akt antibodies specific for total Akt or Akt phosphorylated at position 308 (pAkt308) or 473 (pAkt473). Band intensities from three separate Western blots were quantified using densitometry (NIH Image J), and the normalized ratio of pAkt to Akt with various treatments is presented in the lower panel. pAkt308 or pAkt473 with PGE2 treatment versus nontreated controls and other treatments: *, P < 0.05. (B) MLO-Y4 cells were treated with vehicle or PGE2 (5 μM) for 1 h in the presence or absence of PD98059 (PD) (50 μM). Cell lysates were immunoblotted with anti-phospho-ERK1/2 (pERK1/2) or total ERK antibody. Densitometric measurements from three separate Western blots were performed, and the normalized ratio of pERK/ERK from various treatments is presented in the lower panel. PGE2-treated versus nontreated control or other treated samples: *, P < 0.05. All data are presented as mean ± SEM (n = 3).
PGE2-induced activation of PI3K/Akt is independent of its activation of cAMP-PKA signaling.
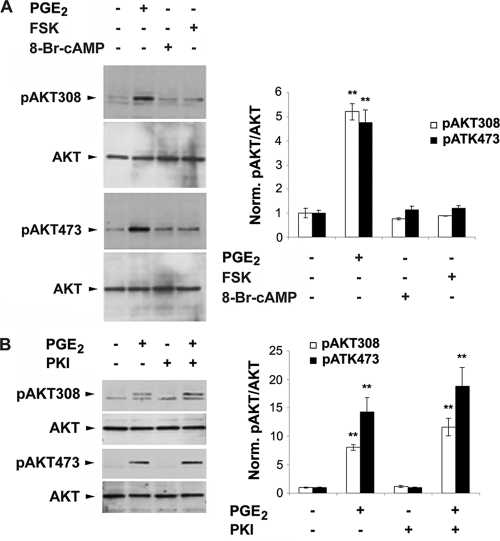
We have previously shown that PGE2 increases intracellular cAMP and activates PKA in MLO-Y4 cells (9). In contrast to the case for PGE2 the PKA activators forskolin (FSK) and 8-bromo-cAMP had no effect on the activation of Akt as detected by phosphorylation at Thr308 and Ser473 sites (Fig. 3A). Consistently, a PKA inhibitor, PKI, by itself had no effect on Akt and also failed to attenuate PGE2 activation (Fig. 3B). These data suggest that the activation of PI3K/Akt does not rely on the activation of cAMP-PKA signaling.
FIG. 3.
Akt activation by PGE2 is independent of the activation of PKA signaling. (A) MLO-Y4 cells were treated with vehicle, PGE2 (5 μM), FSK (10 μM), or 8-Br-cAMP (2 mM) for 1 h. Cell lysates were immunoblotted with anti-Akt antibody specific for total Akt or Akt phosphorylated at position 308 or 473. The normalized ratio of pAkt to Akt from densitometric measurements of three separate Western blots is presented in right panel. pAkt308 or pAkt473 under PGE2 treatment versus vesicle control or other treatments: **, P < 0.01. The data are presented as mean ± SEM (n = 3). (B) MLO-Y4 cells were pretreated with vehicle or PKI (0.4 μM) for 15 min, followed by treatment with PGE2 (5 μM) for 1 h. Cell lysates were immunoblotted with anti-Akt antibody specific for total Akt or Akt phosphorylated at position 308 or 473. The normalized ratio of pAkt to Akt from densitometric measurements of three separate Western blots is presented in right panel. pAkt308 or pAkt473 under PGE2 or PGE2 plus PKI treatment versus vesicle control or other treatments: **, P < 0.01. The data are presented as mean ± SEM (n = 3).
PGE2 inactivates GSK-3 and promotes accumulation and nuclear translocation of β-catenin.
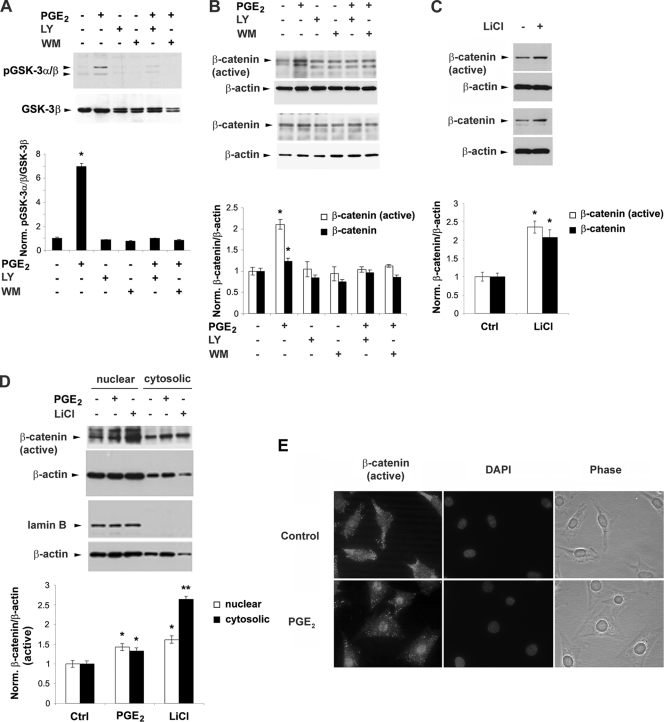
To explore the possible downstream effectors of PI3K/Akt-activated signaling involved in the regulation of Cx43 expression, the effect of PGE2 on GSK-3 and β-catenin signaling was examined (Fig. 4). The phosphorylation of GSK-3α/β was significantly enhanced by PGE2 and attenuated by the inhibitors of PI3K signaling inhibitors LY294002 and wortmannin (Fig. 4A). GSK-3 is known to phosphorylate β-catenin, which provides signals for ubiquitination and degradation of β-catenin (2). Two antibodies were used: the C-terminal pan-β-catenin antibody for detection of β-catenin and β-catenin antibody, which detects the activated, nonphosphorylated form of β-catenin at amino acid residues 29 to 49. The levels of both total and active β-catenin were significantly increased by PGE2, and this increase was attenuated by these two PI3K signaling inhibitors (Fig. 4B). These results suggest that the inactivation of GSK-3 kinase and the increase of β-catenin caused by PGE2 are mediated through the activation of PI3K signaling. To verify the relationship between GSK-3 and β-catenin, LiCl was used, which mimics Wnt signaling by the inhibition of GSK-3α/β activity and induces the accumulation of nonphosphorylated, nonubiquitinated active β-catenin (29, 43). LiCl induced an increase of both total and active β-catenin at significant levels (Fig. 4C), confirming that the increase of β-catenin results from the GSK-3 inactivation. A subcellular fractionation assay showed that PGE2 and LiCl induced accumulation of active β-catenin significantly in both cytosolic and nuclear fractions (Fig. 4D). Enrichment of the nuclear fraction was validated by an increase of lamin B, a nuclear marker. The increased accumulation of active β-catenin in the nucleus induced by PGE2 treatment was further confirmed by immunofluorescent nuclear staining and counterlabeling with DAPI (4′,6′-diamidino-2-phenylindole) (Fig. 4E).
FIG. 4.
PGE2-activated PI3K/Akt signaling leads to phosphorylation/inactivation of GSK-3 and nuclear translocation and accumulation of β-catenin. (A) PGE2 increases the pGSK-3α/β level, and this increase is blocked by PI3K inhibitors LY294002 and wortmannin. MLO-Y4 cells were pretreated with vehicle, LY (5 μM), or WM (100 nM) for 15 min, followed by PGE2 (5 μM) for 1 h. Cell lysates were immunoblotted with anti-phospho-GSK-3α/β (pGSK-3α/β) antibody or anti-total GSK-3β antibody. The normalized ratio of pGSK3α/β to GSK-3β from densitometric measurements of three separate Western blots is presented in the lower panel. PGE2 versus controls and other treatments: *, P < 0.05. The data are presented as mean ± SEM (n = 3). (B) PGE2 increases the levels of both active and total β-catenin, and this increase is inhibited by LY294002 or wortmannin. MLO-Y4 cells were pretreated with vehicle, LY294002 (LY) (5 μM), or wortmannin (WM) (100 nM) for 15 min, followed by PGE2 (5 μM) for 1 h. Cell lysates were immunoblotted with anti-active β-catenin, anti-total β-catenin, or anti-β-actin antibody. The normalized ratio of β-catenin to β-actin from densitometric measurements of three separate Western blots is presented in the lower panel. β-Catenin or active β-catenin under LiCl treatment versus vehicle-treated controls: *, P < 0.05. The data are presented as mean ± SEM (n = 3). (D) PGE2 and LiCl significantly increase the accumulation of active β-catenin in the cytoplasm and in the nucleus. MLO-Y4 cells were treated with vehicle, PGE2 (5 μM), or LiCl (10 mM) for 1 h. Subcellular fractionation was performed, and lysates rich in nuclear and cytosolic components were isolated and immunoblotted with anti-active β-catenin, anti-lamin B, or anti-β-actin antibody. The normalized ratio of active β-catenin to β-actin from densitometric measurements from three separate Western blots is presented in the lower panel. β-Catenin or active β-catenin under PGE2 or LiCl treatment versus vehicle-treated controls: *, P < 0.05; **, P < 0.01. The data are presented as mean ± SEM (n = 3). (E) Immunofluorescence shows Cx43 redistribution in the nucleus induced by PGE2. MLO-Y4 cells were treated with vehicle or PGE2 (5 μM) for 1 h. Fixed cells were immunolabeled with anti-active β-catenin antibody and counterstained with DAPI. Images were captured by fluorescence microscopy.
Inactivation of GSK-3 and accumulation of β-catenin are regulated by both PI3K/Akt and cAMP-PKA signaling.
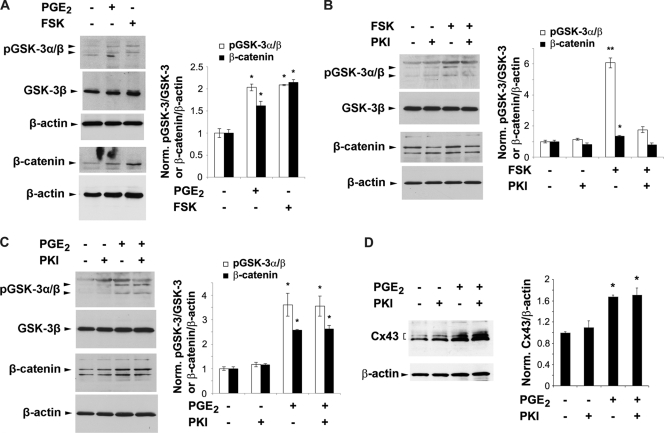
Similarly to PGE2, FSK significantly inactivated GSK-3 by phosphorylating GSK-3α/β at the same site as PGE2, and it significantly increased total levels of β-catenin (Fig. 5A). Interestingly, PKI did not prevent the phosphorylation of GSK-3α/β induced by FSK (Fig. 5B) but diminished the phosphorylation of GSK-3α/β induced by PGE2 (Fig. 5C). These results suggest that the PKA-specific inhibitor PKI blocks the inactivation of GSK-3 induced by FSK due to its specific effect on PKA. The ineffectiveness of PKI in blocking PGE2-induced GSK-3α/β phosphorylation and β-catenin accumulation is a likely result of the activation of the other pathway, PI3K/Akt-GSK-3 signaling, by PGE2.
FIG. 5.
PGE2 inactivation/phosphorylation of GSK-3 and total β-catenin does not solely rely on the activation of cAMP-PKA Signaling. (A) The cAMP-PKA activator forskolin (FSK) has a similar stimulatory effect as PGE2 on phosphorylation of GSK-3α/β and total β-catenin. MLO-Y4 cells were treated with vehicle, PGE2 (5 μM), or FSK (10 μM) for 1 h. Cell lysates were immunoblotted with anti-pGSK-3α/β, anti-total GSK-3β, anti-total β-catenin, or anti-β-actin antibody. The normalized ratio of pGSK-3α/β to GSK-3β or of total β-catenin to β-actin from densitometric measurements of three separate Western blots is presented in the right panel. pGSK-3α/β or β-catenin under PGE2 or FSK treatment versus vesicle control: *, P < 0.05. The data are presented as mean ± SEM (n = 3). (B) The stimulatory effect of forskolin (FSK) on pGSK-3α/β and β-catenin is attenuated by the PKA inhibitor PKI. MLO-Y4 cells were pretreated with vehicle or PKI (0.4 μM) for 15 min, followed by treatment with PGE2 (5 μM) for 1 h. Cell lysates were immunoblotted with anti-phospho-GSK-3α/β, anti-total GSK-3β, anti-total β-catenin or anti-β-actin antibody. The normalized ratio of pGSK-3α/β to pGSK-3β or of β-catenin to β-actin from densitometric measurements of three separate Western blots is presented in right panel. pGSK-3α/β or β-catenin under PGE2 or PGE2 plus PKI treatment versus vesicle control or PKI: *, P < 0.05. The data are presented as mean ± SEM (n = 3). (C) PKI has no effect on the PGE2-induced increase of pGSK-3α/β or β-catenin. MLO-Y4 cells were pretreated with vehicle or PKI (0.4 μM) for 15 min, followed by treatment with FSK (10 μM) for 1 h. Cell lysates were immunoblotted with anti-phospho-GSK-3α/β, anti-total GSK-3β, anti-total β-catenin, or anti-β-actin antibody. The normalized ratio of pGSK-3α/β to pGSK-3β or of β-catenin to β-actin from densitometric measurements of three separate Western blots is presented in the right panel. pGSK-3α/β or β-catenin under FSK or FSK plus PKI treatment versus vesicle control or PKI: *, P < 0.05; **, P < 0.01. The data are presented as mean ± SEM (n = 3). (D) PKI has no effect on the PGE2-induced increase of Cx43 protein. MLO-Y4 cells were pretreated with vehicle or PKI (0.4 μM) for 15 min, followed by treatment with PGE2 (5 μM) for 24 h. Cell lysates were immunoblotted with anti-Cx43 or anti-β-actin antibody. The normalized ratio of Cx43 to β-actin from densitometric measurements of three separate Western blots is presented in the right panel. Cx43 under PGE2 or PGE2 plus PKI treatment versus vesicle control or PKI: *, P < 0.05. The data are presented as mean ± SEM (n = 3).
Time-dependent activation of PI3K/Akt, inactivation of GSK-3, and increase of β-catenin and Cx43.
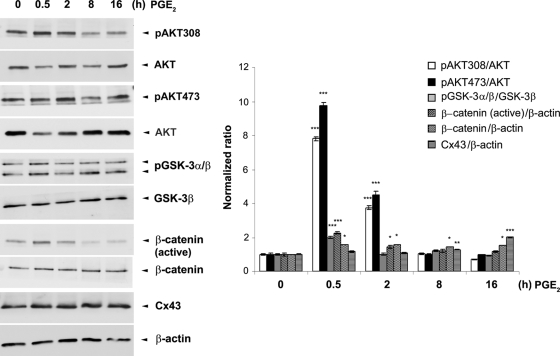
The activation/inactivation of these signaling pathways is responsive to times of PGE2 treatment. A significant increase of Akt activation indicated by phosphorylation at sites of 473 and 308 and inactivation of GSK-3 occurred mainly during the first 2 h of PGE2 treatment (Fig. 6). The increase of β-catenin, however, was sustained after 8 and 16 h of PGE2 treatment, when Cx43 expression was also increased.
FIG. 6.
Time-dependent activation of PI3K/Akt signaling, inactivation of GSK-3, and increase of β-catenin and Cx43 caused by PGE2. MLO-Y4 cells were treated with 5 μM PGE2 for 0, 0.5, 2, 8, and 16 h. Cell lysates were immunoblotted with anti-total Akt, anti-phospho-Akt specific for position 308 or 473, anti-phospho-GSK-3α/β, anti-total GSK-3β, anti-active or total β-catenin, anti-Cx43, or anti-β-actin antibody. The normalized ratio of pAkt308, pAkt473, pGSK-3α/β, β-catenin (active), β-catenin, or CX43 to Akt, pGSK-3β, or β-actin from densitometric measurements of three separate Western blots is presented in the right panel. pAkt308, pAkt473, pGSK-3α/β, β-catenin (active), β-catenin, and Cx43 under 0.5, 2, 8, and 16 h of PGE2 treatment versus vehicle-treated controls *, P < 0.05; **, P < 0.01; ***, P < 0.001. The data are presented as mean ± SEM (n = 3).
Shear stress, similarly to PGE2, activates Akt/GSK-3 signaling; inactivates GSK-3; increases β-catenin, Cx43, and gap junctional coupling; and promotes nuclear translocation and accumulation of β-catenin.
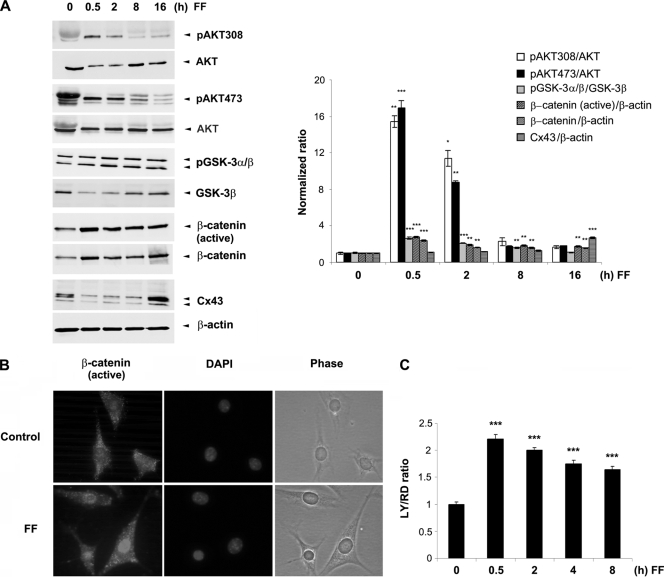
We have previously shown that PGE2 is released in response to fluid flow shear stress and that this released PGE2 functions in an autocrine fashion to activate downstream signaling events to stimulate gap junction coupling (7, 9). Here we observed that, similar to the effect of PGE2 shown in Fig. 6, shear stress significantly induced the phosphorylation of Akt at the sites of Ser473 and Thr308 within the first 2 h of shear stress (Fig. 7A). Fluid flow shear stress also inactivated GSK-3α/β and significantly increased the levels of both total and active β-catenin. Similar to the case for PGE2, this increase of β-catenin continued for 16 h of shear stress, along with a significant increase of Cx43 protein. Similar to the case for PGE2 (Fig. 4E), fluid flow shear stress induced the nuclear translocation of β-catenin (Fig. 7B), as has been previously reported for osteoblasts (37). Furthermore, shear stress induced a significant increase of gap junctional coupling; however, over time shear stress began to decrease coupling (Fig. 7C). These data suggest that fluid flow shear stress on osteocytes results in the release of PGE2 that leads to activation of PI3K/Akt and, consequently, GSK-3/β-catenin signaling pathways, followed by increased Cx43 expression and gap junction function.
FIG. 7.
Fluid flow shear stress has effects on signaling, Cx43 protein expression, and gap junctional coupling that are similar to those of PGE2. (A) Fluid flow shear stress (FF) activates PI3K/Akt signaling, inactivates GSK-3, and increases β-catenin and Cx43 protein expression. MLO-Y4 cells were subjected to fluid flow shear stress at 16 dynes/cm2 for 0, 0.5, 2, 8, or 16 h. Cell lysates were immunoblotted with anti-total Akt, anti-phospho-Akt specific for position 308 or 473, anti-phospho-GSK-3α/β, anti-total GSK-3β, anti-active or total β-catenin, anti-Cx43, or anti-β-actin antibody. The normalized ratio of pAkt308, pAkt473, pGSK-3α/β, β-catenin (active), β-catenin, or Cx43 to Akt, pGSK-3β, or β-actin from densitometric measurements of three separate Western blots is presented in the right panel. pAkt308, pAkt473, pGSK-3α/β, β-catenin, or Cx43 under 0.5, 2, 8, and 16 h of fluid flow versus non-fluid flow controls (0 h FF): *, P < 0.05; **, P < 0.01; ***, P < 0.001. The data are presented as mean ± SEM (n = 3). (B) Shear stress induces the nuclear translocation and accumulation of β-catenin. MLO-Y4 cells were subjected to fluid flow shear stress at 16 dynes/cm2 for 60 min or a corresponding nonstress control. Fixed cells were immunolabeled with anti-active β-catenin antibody and counterstained with DAPI. (C) Shear stress increases gap junctional coupling. MLO-Y4 cells were subjected to fluid flow shear stress at 16 dynes/cm2 for 0, 0.5, 2, 4, and 8 h, and scrape-loading dye transfer experiments were performed. LY/RD ratio under 0.5, 2, 4, and 8 of fluid flow versus non-fluid flow control (0 h FF): ***, P < 0.001.
Direct transcriptional regulation of Cx43 by β-catenin in response to PGE2.
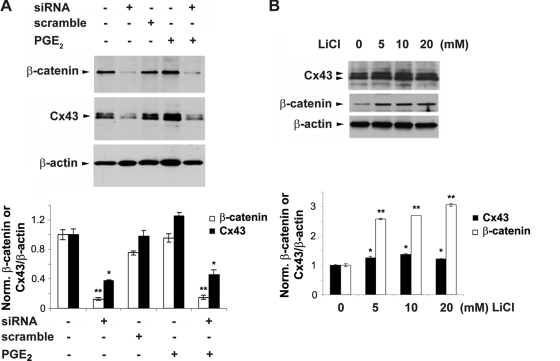
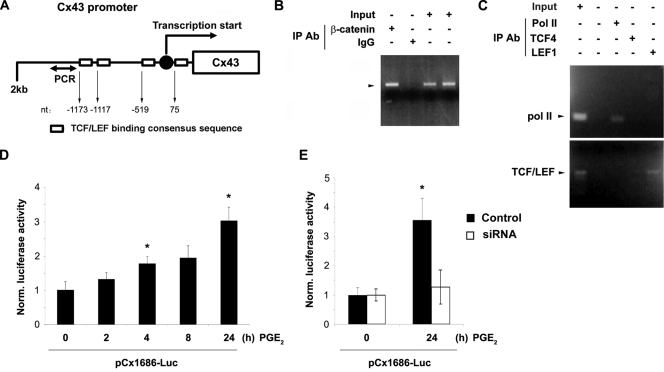
siRNA specific for β-catenin significantly decreased basal levels of β-catenin and Cx43 protein. The upregulation of Cx43 induced by PGE2 was reduced to a similar degree as for non-PGE2-treated samples, whereas the scrambled RNA control had no such effect (Fig. 8A). Moreover, LiCl significantly induced β-catenin accumulation along with the increased level of Cx43 expression in a dose-dependent manner (Fig. 8B). β-Catenin is reported to accumulate in the nucleus and bind transcription factors of the high-mobility-group (HMG) box Tcf/Lef family, which stimulates downstream gene expression (5, 44). By sequence comparison, we identified four TCF/LEF binding consensus sequences (A/TA/TCAAAG) in the 5′ promoter region (from position −1688 to +168 of mouse Cx43 [the transcription start site is indicated as +1]; −1173 [CTTTGTT], −1117 [TACAAAG], −519 [CTTTGTT], and +75 [CTTTGAA]) (Fig. 9A). To determine the direct transcriptional regulation of Cx43 by β-catenin, a chromatin immunoprecipitation (ChIP) experiment was performed using anti-β-catenin antibody or IgG, and the association of β-catenin with the Cx43 promoter was determined by performing a PCR assay with specific DNA primers. Results from the ChIP assay demonstrated the binding of β-catenin to the 5′ promoter region of mouse Cx43 in MLO-Y4 cells (Fig. 9C). To control for the specific association between the Cx43 promoter and transcriptional factors, a similar ChIP was conducted using anti-Pol II, anti-TCF4, or anti-LEF1 antibody. The association of the Cx43 promoter with Pol II and LEF1 was demonstrated (Fig. 9C), validating the workability of the ChIP assay. These data show the direct regulation of Cx43 expression by β-catenin. To further confirm the enhancement of transcriptional activity of the Cx43 promoter in response to PGE2, a luciferase assay was performed using a plasmid construct with the Cx43 promoter linked to a luciferase reporter gene (34, 35). We observed a time-dependent increase of luciferase activity, suggesting the increased transcriptional activity of the Cx43 promoter (Fig. 9D). The upregulation of Cx43 transcription after 24 h of PGE2 treatment was significantly inhibited by β-catenin siRNA (Fig. 9E). This result confirms that PGE2 promotes Cx43 expression through the upregulation of Cx43 promoter activity by β-catenin.
FIG. 8.
Regulation of Cx43 protein expression by β-catenin. (A) Reduction of Cx43 level caused by β-catenin siRNA. MLO-Y4 cells were transfected with scramble siRNA (scramble) or β-catenin siRNA (siRNA) (20 nM) for 24 h, followed by treatment with vehicle or PGE2 (5 μM) for another 24 h. Cell lysates were immunoblotted with anti-β-catenin, anti-Cx43, or anti-β-actin antibody. The normalized ratio of Cx43 to β-actin from densitometric measurements of three separate Western blots is presented in the lower panel. Cx43 or β-catenin under siRNA or PGE2 plus siRNA treatment versus vehicle-treated control or other treatments: *, P < 0.05; **, P < 0.01. The data are presented as mean ± SEM (n = 3). (B) Increase of Cx43 and β-catenin caused by LiCl in a dose-dependent manner. MLO-Y4 cells were treated in the absence and presence of 5, 10, or 20 mM LiCl for 24 h. Cell lysates were immunoblotted with anti-β-catenin, anti-Cx43, or anti-β-actin antibody. The normalized ratio of Cx43 to β-actin from densitometric measurements of three separate Western blots is presented in the lower panel. Cx43 or β-catenin after 5, 10, and 20 min of LiCl treatment versus nontreatment control: *, P < 0.05; **, P < 0.01. The data are presented as mean ± SEM (n = 3).
FIG. 9.
Direct transcriptional regulation of Cx43 by β-catenin. (A) Illustration of the Cx43 promoter region and TCF/LEF binding consensus sequences. (B) Direct association of the Cx43 promoter with β-catenin. The binding of β-catenin to the promoter region of the Cx43 gene was determined by ChIP assay. MLO-Y4 cells were treated with PGE2 (5 μM) for 4 h, and formaldehyde-fixed cells were harvested. Immunoprecipitation of sheared chromatin was performed with anti-active β-catenin antibody or normal rabbit IgG, and the precipitated DNA was analyzed by PCR using specific primers as indicated in Materials and Methods. (C) Direct association of the Cx43 promoter with Pol II and LEF1. MLO-Y4 cells were treated with PGE2 (5 μM) for 4 h, and the ChIP assay was conducted using anti-Pol II, anti-TCF4, or anti-LEF1 antibody. The precipitated DNA was analyzed by PCR using specific primers as indicted in Materials and Methods. (D) Increased transcriptional activity of the Cx43 promoter caused by PGE2. MLO-Y4 cells transfected with plasmids pGL2-Basic, pCx1686-Luc, and pRSVβgal were treated with PGE2 (5 μM) for 0, 2, 4, 8, and 24 h, and the luciferase activity of the cell lysates was determined using luciferin reagent (Promega). Luciferase activity after 4 or 24 h of PGE2 treatment versus nontreatment control (0 h): *, P < 0.05. (E) β-Catenin inhibits the increase of Cx43 transcriptional activity caused by PGE2. MLO-Y4 cells were transfected with siRNA oligonucleotides prior to transfection with plasmids pGL2-Basic, pCx1686-Luc, and pRSVβgal. These cells were treated with PGE2 (5 μM) for 0 and 24 h and assayed for luciferase activity. Luciferase activity after 24 h of PGE2 treatment without siRNA versus that under all other conditions: *, P < 0.05.
DISCUSSION
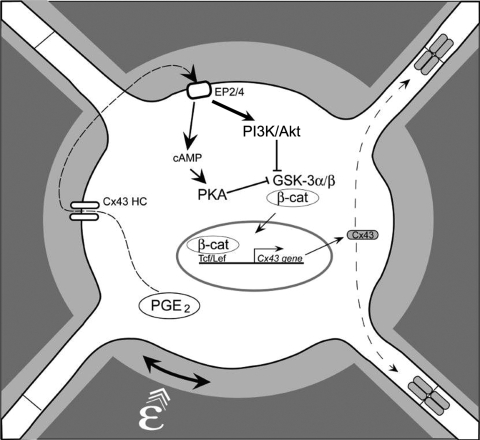
We have previously shown that PGE2 released by mechanically stimulated MLO-Y4 cells functions in an autocrine fashion through the EP2 receptor-coupled cAMP-PKA pathway in upregulation of gap junction function and Cx43 expression (7, 9). In this study, we report three major novel findings: (i) fluid flow shear stress and PGE2 activate PI3K/Akt signaling, which increases the levels of Cx43 expression and gap junction activity; (ii) the independent activation of PI3K/Akt and cAMP-PKA signaling by PGE2 converges through the downstream inactivation of GSK-3 and subsequent activation of β-catenin pathway; and (iii) PGE2-induced PI3K/Akt signaling leads to inactivation of GSK-3 followed by nuclear translocation and accumulation of β-catenin, which associates with the Cx43 promoter to transcriptionally regulate Cx43 expression. Based on our previous studies (7-9, 39) and current observations, a model is proposed, as illustrated in Fig. 10, for the functional involvement of PI3K/Akt and PKA and their downstream effectors, GSK-3 and β-catenin, in the regulation of gap junctions and Cx43 in response to mechanical stimulation in osteocytes. Application of mechanical strain to osteocytes results in the release of PGE2, which functions predominantly in an autocrine/paracrine fashion to independently activate both the cAMP-PKA and the PI3K/Akt pathways. Activation of both pathways results in the phosphorylation and inactivation of GSK-3 and, subsequently, in an increase of nuclear translocation of β-catenin. Inside the nucleus, β-catenin appears to play a crucial role in regulation of Cx43 by directly binding to the Cx43 promoter, which is most likely responsible for the increase of Cx43 mRNA and, subsequently, protein expression. The studies presented in this paper provide the molecular mechanism bridging the predominant effect of autocrine PGE2 released by mechanical strain and the enhancement of Cx43 expression and, consequently, functional gap junctions, to accommodate the passage of increased numbers of signaling molecules between osteocytes in response to mechanical stimulation.
FIG. 10.
A model for role of PGE2 released by mechanical loading in the activation of signaling, transcriptional regulation of Cx43, and stimulation of gap junction function. PGE2 released from osteocytes by mechanical stimulation exerts autocrine effects on osteocytes via the EP2 receptor, as shown previously (9). This leads to activation of both the PI3K/Akt and the cAMP-PKA signaling pathways. The activation of PI3K/Akt appears to be relatively stronger (bold line) than that of cAMP-PKA. The activation of both pathways results in phosphorylation and inactivation of GSK-3 and, consequently, in nuclear translocation and accumulation of β-catenin. This supports the model of prostaglandin activation of β-catenin in response to mechanosensation as proposed previously (6). Nuclear β-catenin binds to the promoter region of the Cx43 gene to promote gene transcription. Increased Cx43 protein assembly into a greater number of functional gap junctions occurs in response to anabolic mechanical loading.
We show that fluid flow shear stress and PGE2 have similar temporal effects on activation of Akt and GSK-3/β-catenin signaling, implying that PGE2 is a likely modulator in mediating this signaling cascade. Activated Akt is an upstream regulator of GSK-3/β-catenin signaling in response to fluid flow and PGE2. Interestingly, the magnitude of the effect on pGSK-3 and β-catenin is less than that of pAkt. This could be partially explained by the possibility that Akt activated by PGE2 not only regulates GSK-3/β-catenin but also possibly modulates other downstream signaling pathways.
The Wnt/β-catenin signaling pathway is recognized as an important regulator of bone mass and bone cell function and may cross talk with the prostaglandin pathway in response to loading in osteocytes (6). Wnt1 and LiCl have been shown to enhance Cx43 promoter activity in P19 EC cells, and Wnt-1 can regulate the expression of Cx43 in cardiac myocytes (1, 46). However, it is not clear if β-catenin directly regulates the transcription of Cx43. Here we show that LiCl mimics Wnt signaling by activating GSK-3/β-catenin signaling effects on Cx43, but to a lesser degree than PGE2. One of the possible reasons is that PGE2 also activates other signaling pathways such as cAMP-PKA, and the other signaling components may act in concert with β-catenin to increase or amplify Cx43 expression.
In this study, for the first time, we show the direct association of β-catenin with the promoter region of the Cx43 gene. β-Catenin is likely to bind to two conserved TCF sites close to the sites of the PCR primers that we used. Interestingly, the degree of Cx43 protein expression in PGE2-treated cells inhibited by β-catenin siRNA is similar to that in non-PGE2-treated cells. This can be explained by the direct transcriptional regulation of the Cx43 promoter by β-catenin even in the absence of PGE2, as shown in ChIP assays. Alternatively, since β-catenin siRNA results in the reduction of total β-catenin, it is probable that PGE2 treatment increases active β-catenin levels concomitantly with decreases of total β-catenin. PGE2 also increases transcriptional activity of Cx43 as demonstrated by luciferase assay analysis, and this increase is suppressed by β-catenin siRNA, supporting the notion that β-catenin mediates the effect of PGE2 on promoting transcriptional activity of Cx43 promoter. Increased expression of Cx43 is a likely mechanism leading to the enhancement of gap junctional coupling between osteocytes.
PKA activated by intracellular cAMP may also regulate gap junctions at the level of channel assembly by increasing the number of junctional plaques on the cell surface (3, 39). Increased levels of intracellular cAMP has been shown to enhance gap junction assembly and junctional permeability in osteoblastic cells (42). Other than the effect of PI3K signaling on connexin expression levels (48), there are no previous studies linking activation of this signaling pathway and increased function and permeability of gap junction channels.
We have previously shown that intracellular cAMP levels were increased upon application of PGE2. Elevation of the intracellular cAMP concentration has also been implicated in stimulatory effects on Akt activity (16, 33). Here we have shown that activators for cAMP-PKA signaling, i.e., FSK and 8-Br-cAMP, could not increase the phosphorylation of Akt at Ser473 and Thr308 in MLO-Y4 cells. Moreover, PKI, a highly specific inhibitor (Ki = 36 nM) of cAMP-dependent protein kinase PKA (20), failed to abolish the activation of Akt induced by PGE2. These results suggest that activation of PI3K/Akt by PGE2 in MLO-Y4 cells is likely to be independent of the cAMP-PKA pathway.
The activity of GSK-3α/β has been reported to be modulated either by growth factors that work through the PI3K-Akt cascade or by hormonal stimulation of G protein-coupled receptors that link to changes in intracellular cAMP levels, depending upon the context and source of the stimulation (15, 30). Similar to PI3K/Akt signaling, the cAMP-PKA activator FSK inactivated GSK-3α/β, thereby resulting in an increase of β-catenin. This observation implies that PGE2-induced independent and parallel activations of PI3K/Akt and cAMP-PKA signaling converge to act together to block GSK-3 activity and retain β-catenin in the nucleus. Moreover, a cAMP-PKA-specific inhibitor, PKI, failed to attenuate PGE2-induced activation of GSK-3/β-catenin signaling and Cx43 expression, suggesting that blocking the cAMP-PKA pathway is not sufficient to affect downstream GSK-3/β-catenin signaling. This can be explained by the concurrent activation of PI3K/Akt even though PI3K/Akt inhibitors significantly block downstream signaling. It is likely that the cAMP-PKA pathway may play a lesser role than PI3K/Akt signaling in regulating GSK-3/β-catenin signaling and regulation of Cx43 expression in response to PGE2. As the inhibitors used here may not completely block the pathways examined, we cannot eliminate the involvement of other minor signaling mechanisms. Therefore, these signaling pathways combined with other minor, uncharacterized pathways ultimately lead to the increased expression of Cx43 and the formation of a greater number of functional gap junction channels to accommodate the effects of mechanical stimulation.
Acknowledgments
We thank Stephen J. Lye (University of Toronto) for kindly providing plasmids pGL2-Basic, pCx1686-Luc, and pRSVβgal. We also thank Sumin Gu and Ashik Islam for technical assistance and Sirish Burra and Erin Kennedy for critical reading of the manuscript.
This study was supported by National Institutes of Health grant AR46798 to J.X.J., E.S., and L.F.B. and Welch Foundation grant AQ-1507 to J.X.J.
Footnotes
Published ahead of print on 19 October 2009.
REFERENCES
- 1.Ai, Z., A. Fischer, D. C. Spray, A. M. C. Brown, and G. I. Fishman. 2000. Wnt-1 regulation of connexin43 in cardiac myocytes. J. Clin. Invest. 105:161-171. [DOI] [PMC free article] [PubMed] [Google Scholar]
- 2.Alford, A. I., C. R. Jacobs, and H. J. Donahue. 2003. Osillating fluid flow regulates gap junction communication in osteocytic MLO-Y4 cells by an ERK1/2 MAP kinase-dependent mechanism. Bone 33:64-70. [DOI] [PubMed] [Google Scholar]
- 3.Atkinson, M. M., P. D. Lampe, H. H. Lin, R. Kollander, X.-R. Li, and D. T. Kiang. 1995. Cyclic AMP modifies the cellular distribution on connexin43 and induces a persistent increase in the junctional permeability of mouse mammary tumor cells. J. Cell Sci. 108:3079-3090. [DOI] [PubMed] [Google Scholar]
- 4.Baylink, T. M., S. Mohan, R. J. Fitzsimmons, and D. J. Baylink. 1996. Evaluation of signal transduction mechanisms for the mitogenic effects of prostaglandin E2 in normal human bone cells in vitro. J. Bone Miner. Res. 11:1413-1418. [DOI] [PubMed] [Google Scholar]
- 5.Behrens, J., J. P. von Kries, M. Kühl, L. Bruhn, D. Wedlich, R. Grosschedl, and W. Birchmeier. 1996. Functional interaction of beta-catenin with the transcription factor LEF-1. Nature 382:638-642. [DOI] [PubMed] [Google Scholar]
- 6.Bonewald, L. F., and M. L. Johnson. 2008. Osteocytes, mechanosensing and Wnt signaling. Bone 42:606-615. [DOI] [PMC free article] [PubMed] [Google Scholar]
- 7.Cheng, B., Y. Kato, S. Zhao, J. Luo, E. Sprague, L. F. Bonewald, and J. X. Jiang. 2001. Prostaglandin E2 is essential for gap junction-mediated intercellular communication between osteocyte-like MLO-Y4 cells in response to mechanical strain. Endocrinology 142:3464-3473. [DOI] [PubMed] [Google Scholar]
- 8.Cheng, B., S. Zhao, J. Luo, E. Sprague, L. F. Bonewald, and J. X. Jiang. 2001. Expression of functional gap junctions and regulation by fluid flow shear stress in osteocyte-like MLO-Y4 cells. J. Bone Miner. Res. 16:249-259. [DOI] [PubMed] [Google Scholar]
- 9.Cherian, P. P., B. Cheng, S. Gu, E. Sprague, L. F. Bonewald, and J. X. Jiang. 2003. Effects of mechanical strain on the function of gap junctions in osteocytes are mediated through the prostaglandin E2 receptor. J. Biol. Chem. 278:43146-43156. [DOI] [PubMed] [Google Scholar]
- 10.Civitelli, R., K. Ziambaras, P. M. Warlow, F. Lecanda, T. Nelson, J. Harley, N. Atal, E. C. Beyer, and T. H. Steinberg. 1998. Regulation of connexin43 expression and function by prostaglandin E2 (PGE2) and parathyroid hormone (PTH) in osteoblastic cells. J. Cell. Biochem. 68:8-21. [DOI] [PubMed] [Google Scholar]
- 11.Collins, D. A., and T. J. Chambers. 1991. Effect of prostaglandins E1, E2, and F2α on osteoclast formation in mouse bone marrow cultures. J. Bone Miner. Res. 6:157-164. [DOI] [PubMed] [Google Scholar]
- 12.Collins, D. A., and T. J. Chambers. 1992. Prostaglandin E2 promotes osteoclast formation in murine hematopietic cultures through an action on hematopoietic cells. J. Bone Miner. Res. 7:555-561. [DOI] [PubMed] [Google Scholar]
- 13.Doty, S. B. 1981. Morphological evidence of gap junctions between bone cells. Calcif. Tissue Int. 33:509-512. [DOI] [PubMed] [Google Scholar]
- 14.El-Fouly, M. H., J. E. Trosko, and C. C. Chang. 1987. Scrape-loading and dye transfer. A rapid and simple technique to study gap junctional intercellular communication. Exp. Cell Res. 168:422-430. [DOI] [PubMed] [Google Scholar]
- 15.Fang, X., S. X. Yu, Y. Lu, R. C. Bast, Jr., J. R. Woodgett, and G. B. Mills. 2000. Phosphorylation and inactivation of glycogen synthase kinase 3 by protein kinase A. Proc. Natl. Acad. Sci. U.S.A. 97:11960-11965. [DOI] [PMC free article] [PubMed] [Google Scholar]
- 16.Filippa, N., C. Sable, C. Filloux, B. Hemmings, and E. Van Obberghen. 1999. Mechanism of protein kinase B activation by cyclic AMP-dependent protein kinase. Mol. Cell. Biol. 19:4989-5000. [DOI] [PMC free article] [PubMed] [Google Scholar]
- 17.Flanagan, A. M., and T. J. Chambers. 1992. Stimulation of bone nudule formation in vitro by prostaglandin E1 and prostaglandin E2. Endocrinology 130:443-448. [DOI] [PubMed] [Google Scholar]
- 18.Fujino, H., K. A. West, and J. W. Regan. 2002. Phosphorylation of glycogen synthase kinase-3 and stimulation of T-cell factor signaling following activation of E2 and E4 prostanoid receptor by prostaglandin E2. J. Biol. Chem. 277:2614-2619. [DOI] [PubMed] [Google Scholar]
- 19.Gao, Q., M. Katakowski, X. Chen, Y. Li, and M. Chopp. 2005. Human marrow stromal cells enhance connexin43 gap junction intercellular communication in cultured astrocytes. Cell Transplant. 14:109-117. [DOI] [PubMed] [Google Scholar]
- 20.Glass, D. B., H. C. Cheng, L. Mende-Mueller, J. Reed, and D. A. Walsh. 1989. Primary structural determinants essential for potent inhibition of cAMP-dependent protein kinase by inhibitory peptides corresponding to the active portion of the heat-stable inhibitor protein. J. Biol. Chem. 264:8802-8810. [PubMed] [Google Scholar]
- 21.Goodenough, D. A., J. A. Goliger, and D. L. Paul. 1996. Connexins, connexons, and intercellular communication. Annu. Rev. Biochem. 65:475-502. [DOI] [PubMed] [Google Scholar]
- 22.He, D. S., J. X. Jiang, S. M. Taffet, and J. M. Burt. 1999. Formation of heteromeric gap junction channels by connexin 40 and 43 in vascular smooth muscle cells. Proc. Natl. Acad. Sci. U.S.A. 96:6495-6500. [DOI] [PMC free article] [PubMed] [Google Scholar]
- 23.Jee, W. S. S., K. Ueno, Y. P. Deng, and D. M. Woodbury. 1985. The effects of prostaglandin E2 in growing rats: increased metaphyseal hard tissue and corticoendosteal bone formation. Calcif. Tissue Int. 37:148-156. [DOI] [PubMed] [Google Scholar]
- 24.Jin, Y., Z. Wang, Y. Zhang, B. Yang, and W. H. Wang. 2007. PGE2 inhibits apical K channels in the CCD through activation of the MAPK pathway. Am. J. Physiol. Renal Physiol. 293:F1299-F1307. [DOI] [PubMed] [Google Scholar]
- 25.Jones, S. J., C. Gray, H. Sakamaki, M. Arora, A. Boyde, R. Gourdie, and C. Green. 1993. The incidence and size of gap junctions between the bone cells in rat calvaria. Anat. Embryol. 187:L343-L352. [DOI] [PubMed] [Google Scholar]
- 26.Kaji, H., T. Sugimoto, M. Kanatani, M. Fukase, M. Kumegawa, and K. Chichara. 1996. Prostaglandin E2 stimulates osteoclast-like cell formation and bone-resorbing activity via osteoclasts: role of cAMP-dependent protein kinase. J. Bone Miner. Res. 11:62-71. [DOI] [PubMed] [Google Scholar]
- 27.Kato, Y., J. J. Windle, B. A. Koop, G. R. Mundy, and L. F. Bonewald. 1997. Establishment of an osteocyte-like cell line, MLO-Y4. J. Bone Miner. Res. 12:2014-2023. [DOI] [PubMed] [Google Scholar]
- 28.Keller, J., A. Klamer, B. Bak, and P. Suder. 1993. Effects of local prostaglandin E2 on fracture callus in rabbit. Acta Orthop. Scand. 64:59-63. [DOI] [PubMed] [Google Scholar]
- 29.Klein, P. S., and D. A. Melton. 1996. A molecular mechanism for the effect of lithium on development. Proc. Natl. Acad. Sci. U.S.A. 93:8455-8459. [DOI] [PMC free article] [PubMed] [Google Scholar]
- 30.Li, M., X. Wang, M. K. meintzer, T. Laessig, M. J. Birnbaum, and K. A. Heidenreich. 2000. Cyclic AMP promotes neuronal survival by phosphorylation of glycogen synthase kinase 3beta. Mol. Cell. Biol. 20:9356-9363. [DOI] [PMC free article] [PubMed] [Google Scholar]
- 31.Liu, C., Y. Li, M. Semenov, C. Han, G. H. Baeg, Y. Tan, Z. Zhang, X. Lin, and X. He. 2002. Control of beta-catenin phosphorylation/degradation by a dual-kinase mechanism. Cell 108:837-847. [DOI] [PubMed] [Google Scholar]
- 32.Mason, D. J., R. Hillam, and T. M. Skerry. 1996. Constitutive in vivo mRNA expression by osteocytes of β-actin, osteocalcin, connexin-43, IGF-1, c-fos and c-jun, but not TNF-α nor tartrate-resistant acid phosphatase. J. Bone Miner. Res. 11:350-357. [DOI] [PubMed] [Google Scholar]
- 33.Mei, F. C., J. Qiao, O. M. Tsygankova, J. L. Meinkoth, L. A. Quilliam, and X. Cheng. 2002. Differential signaling of cyclic AMP: opposing effects of exchange protein directly activated by cyclic AMP and cAMP-dependent protein kinase on protein kinase B activation. J. Biol. Chem. 277:11497-11504. [DOI] [PubMed] [Google Scholar]
- 34.Mitchell, J. A., and S. J. Lye. 2005. Differential activation of the connexin 43 promoter by dimers of activator protein-1 transcription factors in myometrial cells. Endocrinology 146:2048-2054. [DOI] [PubMed] [Google Scholar]
- 35.Mitchell, J. A., C. Ou, Z. Chen, T. Nishimura, and S. J. Lye. 2001. Parathyroid hormone-induced up-regulation of connexin-43 mesenger ribonucleic acid (mRNA) is mediated by sequences within both the promoter and the 3′ untranslated region of the mRNA. Endocrinology 142:907-915. [DOI] [PubMed] [Google Scholar]
- 36.Nagata, T., K. Kaho, S. Nishikawa, H. Shinohara, Y. Wakano, and H. Ishida. 1994. Effect of prostaglandin E2 on mineralization of bone nudules formed by fetal rat calvarial cells. Calcif. Tissue Int. 55:451-457. [DOI] [PubMed] [Google Scholar]
- 37.Norvell, S. M., M. Alvarez, J. P. Bidwell, and F. M. Pavalko. 2004. Fluid flow stress induces β-catenin signaling in osteoblasts. Calcif. Tissue Int. 75:396-404. [DOI] [PubMed] [Google Scholar]
- 38.Palumbo, C., S. Palazzini, and G. Marotti. 1990. Morphological study of intercellular junctions during osteocyte differentiation. Bone 11:401-406. [DOI] [PubMed] [Google Scholar]
- 39.Paulson, A. F., P. D. Lampe, R. A. Meyer, E. Tenbroek, M. M. Atkinson, T. Walseth, and R. G. Johnson. 2000. Cyclic AMP and LDL trigger a rapid enhancement in gap junction assembly through a stimulation of connexin trafficking. J. Cell Sci. 113:3037-3049. [DOI] [PubMed] [Google Scholar]
- 40.Raisz, L. G., and P. M. Fall. 1990. Biphasic effects of prostaglandin E2 on bone formation in cultured fetal rat calvariae: interaction with cortisol. Endocrinology 126:1654-1659. [DOI] [PubMed] [Google Scholar]
- 41.Raisz, L. G., P. M. Fall, B. Y. Gabbitas, T. L. McCarthy, B. E. Kream, and E. Canalis. 1993. Effects of prostaglandin E2 on bone formation in cultured fetal calvariae: role of insulin-like growth factor-1. Endocrinology 133:1504-1510. [DOI] [PubMed] [Google Scholar]
- 42.Romanello, M., L. Moro, D. Pirulli, S. Crovella, and P. D'Andrea. 2001. Effects of cAMP on intercellular coupling and osteoblast differentiation. Biochem. Biophys. Res. Commun. 282:1138-1144. [DOI] [PubMed] [Google Scholar]
- 43.Stambolic, V., L. Ruel, and J. R. Woodgett. 1996. Lithium inhibits glycogen synthase kinase-3 activity and mimics wingless signaling in intact cells. Curr. Biol. 6:1664-1668. [DOI] [PubMed] [Google Scholar]
- 44.Tetsu, O., and F. McCormick. 1999. Beta-catenin regulates expression of cyclin D1 in colon carcinoma cells. Nature 398:422-426. [DOI] [PubMed] [Google Scholar]
- 45.Thi, M. M., T. Kojima, S. C. Cowin, S. Weinbaum, and D. C. Spray. 2003. Fluid flow stress remodels expression and function of junctional proteins in cultured bone cells. Am. J. Physiol. Cell Physiol. 284:C389-C403. [DOI] [PubMed] [Google Scholar]
- 46.van der Heyden, M. A. G., M. B. Rook, M. M. P. Hermans, G. Rijksen, J. Boonstra, L. H. K. Defize, and O. H. J. Destree. 1998. Identification of connexin43 as a functional target for Wnt signalling. J. Cell Sci. 111:1741-1749. [DOI] [PubMed] [Google Scholar]
- 47.Yellowley, C. E., Z. Li, Z. Zhou, C. R. Jacobs, and H. J. Donahue. 2000. Functional gap junctions between osteocytic and osteoblastic cells. J. Bone Miner. Res. 15:209-217. [DOI] [PubMed] [Google Scholar]
- 48.Zhang, F., J. Cheng, G. Lam, D. K. Jin, L. Vincent, N. R. Hackett, S. Wang, L. M. Young, B. Hempstead, R. G. Crystal, and S. Rafii. 2005. Adenovirus vector E4 gene regulates connexin 40 and 43 expression in endothelial cells via PKA nd PI3K pathways. Circ. Res. 96:950-957. [DOI] [PMC free article] [PubMed] [Google Scholar]
- 49.Zhao, Y., M. A. Rivieccio, S. Lutz, E. Scemes, and C. F. Brosnan. 2006. The TLR3 ligand polyl:C downregulates connexin43 expression and function in astrocytes by a mechanism involing the NF-kappaB and PI3 kinase pathways. Glia 54:775-785. [DOI] [PMC free article] [PubMed] [Google Scholar]


