Abstract
Investigation of the entry pathways of hepatitis B virus (HBV), a member of the family Hepadnaviridae, has been hampered by the lack of versatile in vitro infectivity models. Most concepts of hepadnaviral infection come from the more robust duck HBV system; however, whether the two viruses use the same mechanisms to invade target cells is still a matter of controversy. In this study, we investigate the role of an important plasma membrane component, caveolin-1 (Cav-1), in HBV infection. Caveolins are the main structural components of caveolae, plasma membrane microdomains enriched in cholesterol and sphingolipids, which are involved in the endocytosis of numerous ligands and complex signaling pathways within the cell. We used the HepaRG cell line permissive for HBV infection to stably express dominant-negative Cav-1 and dynamin-2, a GTPase involved in vesicle formation at the plasma membrane and other organelles. The endocytic properties of the newly established cell lines, designated HepaRGCav-1, HepaRGCav-1Δ1-81, HepaRGDyn-2, and HepaRGDyn-2K44A, were validated using specific markers for different entry routes. The cells maintained their properties during cell culture, supported differentiation, and were permissive for HBV infection. The levels of both HBV transcripts and antigens were significantly decreased in cells expressing the mutant proteins, while viral replication was not directly affected. Chemical inhibitors that specifically inhibit clathrin-mediated endocytosis had no effect on HBV infection. We concluded that HBV requires a Cav-1-mediated entry pathway to initiate productive infection in HepaRG cells.
Hepatitis B virus (HBV) is a small enveloped DNA virus and a member of the family Hepadnaviridae. The viral envelope surrounding the partially double-stranded DNA genome consists of multiple copies of the viral surface transmembrane proteins inserted into a lipid bilayer derived from the host cells (24).
The first steps of the virus life cycle involve receptor recognition and attachment to the cell surface, followed by internalization of the virion or its components in the cytoplasm through either the plasma membrane or the membrane of an endocytic vesicle. Therefore, for many viruses, the lipid compositions of both viral and cellular target membranes are important factors in the infection process (4, 26, 34).
For HBVs, there is evidence suggesting that receptor-mediated endocytosis is the mechanism of entry into the target cells; however, the molecular details of this process are largely unknown (14). Recent studies have brought insights into the role of cholesterol in hepadnaviral infection. Using chemical compounds that either extract or interfere with the biosynthesis of this lipid, it was shown that cholesterol depletion from host membranes does not affect the internalization of duck HBV (DHBV), the avian member of the hepadnaviruses. In contrast, cholesterol extraction from the envelopes of both DHBV and human HBV strongly reduces virus infectivity, possibly interfering with its release from endosomes (6, 13).
A variety of potential cellular binding partners involved in viral entry have also been reported in the last years for HBV and DHBV (14). Of the initial candidates, only carboxypeptidase D could be confirmed to be essential for DHBV infection, but intriguingly, not for HBV. This and other discrepancies observed between the two viral models, such as the different responses to bafilomycin A1 (Baf), an inhibitor of vacuolar proton ATPases often used to dissect intracellular trafficking, raise the important question as to whether HBV and DHBV use the same entry pathway to infect hepatocytes (7).
In this study, we addressed the role of another important plasma membrane component, caveolin-1 (Cav-1), in HBV entry. Caveolins are the major components of caveolae, highly structured membrane microdomains enriched in cholesterol and sphingolipids, with a flask-shaped morphology (22). Multiple binding partners have been reported for Cav-1, leading to the assumption that the protein acts as a scaffolding molecule, determining the cargo for caveola-dependent endocytosis. In addition to endocytosis, caveolins are involved in numerous other cellular processes, including transcytosis of macromolecules, cholesterol homeostasis, and signal transduction; however, their specific functions strictly depend on the host cells (10, 32).
To investigate the implication of caveolae in HBV internalization, we used the HepaRG cell line, which is permissive for HBV infection, to stably express mutant variants with dominant-negative functions of Cav-1 and dynamin-2 (Dyn-2) as controls. Dyn-2 is a mechanochemical GTPase involved in vesicle formation at the plasma membrane, the trans-Golgi network, and various other intracellular organelles (30). The GTPase activity is crucial in the final stage of vesicle scission in both caveola- and clathrin-mediated entry pathways and expression of mutant variants that have no enzymatic function, resulting in impaired cell endocytosis (16).
The newly established cell lines, designated HepaRGCav-1, HepaRGCav-1Δ1-81, HepaRGDyn-2, and HepaRGDyn-2K44A, were successfully maintained in cell culture and differentiated to allow infection with HBV. Since this process requires a long time in tissue culture, the endocytic properties of the cells were periodically confirmed using specific markers. The levels of HBV transcripts and antigens were significantly reduced in cells expressing the mutant proteins, while chemical inhibitors that specifically inhibit clathrin-mediated endocytosis had no effect on HBV infection. In addition, overexpression of the Cav-1 and Dyn-2 dominant-negative proteins in HepG2.2.2.15 cells, stably transfected with the whole HBV genome, had no effect on HBV replication. We therefore concluded that Cav-1 function is essential for HBV to initiate productive infection in HepaRG cells.
MATERIALS AND METHODS
DNA plasmids and cloning.
Plasmids pEGFP-N1Dyn-2 and pEGFP-N1Dyn-2K44A, expressing the wild-type Dyn-2 and a GTPase-defective mutant of Dyn-2 with lysine 44 changed to alanine, respectively, were a kind gift from Mark McNieven, Mayo Clinic. Both dynamins are expressed as fusion proteins with enhanced green fluorescent protein (EGFP), as described previously (9). The bicistronic plasmids pCINeo/IRES-GFP/Cav-1 and pCINeo/IRES-GFP/Cav-1Δ1-81, expressing the wild-type Cav-1 and a truncated form of Cav-1 with dominant-negative function, were kind gifts from Jan Eggermont, Catholic University of Leuven, Leuven, Belgium. Both plasmids also express GFP, as described previously (36).
Plasmids pEGFP-N1 Dyn-2 and pEGFP-N1 Dyn-2 K44A were cut with HindIII and NotI (Promega), and the DNA fragments were inserted into the pLNCX2 retroviral vector (Clontech), resulting in the plasmids pLNCX2-EGFP-Dyn-2 and pLNCX2-EGFP-Dyn-2K44A.
Plasmids pCINeo/IRES-GFP/Cav-1 and pCINeo/IRES-GFP/Cav-1Δ1-81 were used as PCR templates to amplify the sequences coding for internal ribosome entry site (IRES)-GFP/Cav-1 and IRES-GFP/Cav-1Δ1-81, using primers containing NotI and BglII sites. The amplified DNA fragments were inserted into pLNCX2, resulting in the plasmids pLNCX2/IRES-GFP/Cav-1 and pLNCX2/IRES-GFP/Cav-1Δ1-81.
Generation of HepaRG cell lines stably expressing the wild type and the dominant-negative mutants of Dyn-2 and Cav-1.
Plasmids pLNCX2-EGFP-Dyn-2, pLNCX2-EGFP-Dyn-2K44A, pLNCX2-Cav-1-IRES-GFP, and pLNCX2-Cav-1Δ1-81-IRES-GFP were independently used to transfect the RetroPack PT67 cell line using the Retroviral Gene Transfer and Expression System protocols (Clontech). Retrovirus-containing medium from PT67 cell lines stably expressing the wild-type and dominant-negative variants of Dyn-2 and Cav-1 were further used to infect the HepaRG cells. Briefly, the cells were seeded at 60 to 80% confluence in 25-cm2 flasks and grown in Dulbecco's modified Eagle's medium (Gibco) supplemented with 10% fetal bovine serum, 100 units/ml penicillin, 100 μg/ml streptomycin, and 4 mM Glutamax (Invitrogen). The cell medium was harvested 24 h later, cleared by centrifugation at 500 × g for 10 min, and passed through a 0.45-μm cellulose acetate filter. HepaRG cells were seeded in six-well plates and grown in William's E medium (Gibco) supplemented with 10% fetal bovine serum, 50 units/ml penicillin, 50 μg/ml streptomycin, 2 mM Glutamax, 5 μg/ml insulin, and 5 × 10⁵ M hydrocortisone hemisuccinate, as described previously (15). The next day, the cells were infected with 3 ml of virus-containing medium in the presence of 8 μg/ml Polybrene. The medium was changed 24 h later, and infection was repeated three times at 48-h intervals. HepaRG colonies stably expressing wild-type and mutant Dyn-2 (HepaRGDyn-2 and HepaRGDyn-2K44A) or wild-type and mutant Cav-1 (HepaRGCav-1 and HepaRGCav-1Δ1-81) were selected under G418 treatment (600 μg/ml). The colonies were further expanded, and recombinant-protein expression was confirmed by monitoring EGFP or GFP expression under the UV light microscope. Following stabilization, the new cell lines were maintained in William's medium containing 200 μg/ml G418.
SDS-PAGE and Western blotting.
All cell lines used in the study were lysed in a buffer containing 2% SDS, 5 mM dithiothreitol, 50 mM Tris-Cl (pH 7.5), 150 mM NaCl, 2 mM EDTA, and a mixture of protease inhibitors (Sigma) by boiling them for 15 min to extract both soluble and raft-associated membrane proteins. The cell lysates were clarified by centrifugation at 10,000 × g for 15 min. The proteins in the supernatant were quantified using the bicinchoninic acid method (Pierce), and equal amounts were loaded on sodium dodecyl sulfate-polyacrylamide gel electrophoresis (SDS-PAGE) gels. The proteins were transferred to nitrocellulose membranes using a semidry blotter (Millipore). The blots were incubated with either goat anti-Dyn-2 (Santa Cruz Biotechnology; dilution, 1/1,000) or rabbit anti-Cav-1 (Cell Signaling Technology; dilution, 1/1,000) antibodies (Ab), followed by donkey anti-goat (Santa Cruz Biotechnology; dilution, 1/2,000) or goat anti-rabbit-horseradish peroxidase (Pierce; dilution, 1/1,000) Ab. When actin or calnexin expression was used as a loading control, the blots were incubated with either mouse monoclonal Ab against β-actin (Abcam; dilution, 1/500) or rabbit anti-calnexin Ab (Santa Cruz Biotechnology; dilution, 1/4,000), followed by goat anti-mouse/rabbit-horseradish peroxidase Ab (Amersham; dilution, 1/1,000). The proteins were detected using an ECL detection system (Amersham) according to the manufacturer's instructions.
Fluorescence microscopy.
HepaRG, HepaRGDyn-2, HepaRGDyn-2K44A, HepaRGCav-1, and HepaRGCav-1Δ1-81cells were split every 3 days and maintained in culture for 6 weeks, the average time required to perform the HBV infectivity tests. For internalization experiments, cells were plated in four-well chamber slides (Nunc) at 25 to 30% confluence. The cells were washed the next day with ice-cold phosphate-buffered saline (PBS), followed by incubation with either human transferrin (hTfn)-Alexa Fluor 594 or cholera toxin subunit B (CTB)-Alexa Fluor 594 (at concentrations indicated in the figure legends) for 30 min at 4°C. When the effects of cholesterol-depleting agents on CTB internalization were tested, 10 mM methyl-β-cyclodextrin (MβCD) was added 30 min before CTB treatment and maintained throughout the experiment. The medium containing the fluorescent markers was removed, and the cells were washed three times with PBS, followed by 2 h of incubation at 37°C. The cells were then fixed with 4% paraformaldehyde, washed three times with PBS, and mounted with Vectashield mounting medium (Vector Laboratories) containing DAPI (4′,6′-diamidino-2-phenylindole) to visualize the nuclei. The cells were analyzed under a Nikon Eclipse E600 microscope, using a 40× objective.
Spectrofluorimetry.
Internalization of CTB and hTfn in HepaRGDyn-2, HepaRGDyn-2K44A, HepaRGCav-1, and HepaRGCav-1Δ1-81 cell lines was also analyzed in a quantitative manner in differentiated states. Cells were seeded in collagen 12-well plates and differentiated as described previously, with minor modifications (15). Briefly, the cells were maintained for 2 weeks in William's complete medium supplemented with 200 μg/ml G418, followed by 2 weeks in the same medium containing 1.8% dimethyl sulfoxide (DMSO). CTB and hTfn internalization assays were performed as described above, except that the cell monolayers were first disrupted and the cells were replated at 70 to 80% confluence before incubation with either of the two ligands. This step was required to increase the cell uptake of the ligands, a process that occurs with very low efficiency in confluent cells. In control experiments, cells were pretreated with either 10 mM MβCD or 10 mg/ml chlorpromazine (Cpz), and the inhibitors were maintained during ligand internalization for 30 min. After being washed with PBS, the cells were lysed in CHAPS-HSE buffer (2% CHAPS {3-[(3-chloramidopropyl)-dimethylammonio]-1-propanesulfonate} in 50 mM HEPES [pH 7.5]-200 mM NaCl-2 mM EDTA). The amounts of fluorescent markers released into the cell lysates were quantified by spectrofluorimetry (Jasco FP-6500; 590-nm excitation/617-nm emission wavelengths) and normalized to the total cell protein levels. Lysates of cells not incubated with the two fluorescent markers were used as blanks.
HBV preparation from cell supernatants.
HepG2.2.2.15 cells stably transfected with two copies of the HBV genome were grown in RPMI 1640 medium (Euroclone) containing 10% fetal bovine serum, 50 units/ml penicillin, 50 μg/ml streptomycin, 2 mM Glutamax, and 200 μg/ml of G418 (Gibco). The cell supernatants were collected every 3 days and clarified from cell debris by a brief centrifugation at 2,000 × g. Virus particles were pelleted by ultracentrifugation through a 20% sucrose cushion in a SW41 Ti Beckman rotor at 36,000 rpm for 4 h. The pellet was resuspended in PBS, and the virus concentration was determined by real-time PCR, using serial dilutions of known amounts of a pTriExHBV1.1 vector as a standard curve.
Infection of HepaRG cell lines and inhibitor treatment.
The HepaRG, HepaRGDyn-2, HepaRGDyn-2K44A, HepaRGCav-1, and HepaRGCav-1Δ1-81 cell lines were seeded in collagen six-well plates at 80% confluence and differentiated as described previously (15, 16). The differentiated cells were infected with 50 μl of concentrated HBV containing 1 × 10⁸ genome equivalents. When the effects of chemical inhibitors on HBV endocytosis were investigated, cells were incubated with medium containing 25 μg/ml nystatin (Ny), 10 mM MβCD, 50 mM NH4Cl, 200 nM Baf, 10 mg/ml Cpz, or 50 μg/ml genistein (Gen) for 2 h prior to HBV infection. The drugs were either removed when the viral inoculum was added to the cells (Ny and MβCD) or maintained throughout infection (NH4Cl, Baf, Cpz, and Gen). Sixteen hours postinfection (p.i.), the cells were extensively washed with PBS and further incubated with medium supplemented with 1.8% DMSO for the times indicated in the figure legends. Infected cells were harvested, and HBV-specific RNA and antigens were quantified by real-time reverse transcription (RT)-PCR and enzyme-linked immunosorbent assay (ELISA).
RT-PCR.
Total RNA was isolated from the HepaRG, HepaRGDyn-2, HepaRGDyn-2K44A, HepaRGCav-1, and HepaRGCav-1Δ1-81 cell lines using the RNeasy minikit (Qiagen) and serially diluted. To discriminate between endogenous and either wild-type or dominant-negative overexpressed Cav-1, different sets of primers were used: (i) a Cav-1FL pair to amplify the full lengths of both endogenous and overexpressed Cav-1 (534 bp), (ii) a Cav-1WT pair to amplify the full length of the overexpressed Cav-1 only (554 bp), and (iii) a Cav-1DN pair to amplify the full length of Cav-1Δ1-81 and 220 bp of the overexpressed Cav-1 (data not shown). The specificities of Cav-1 primers were first confirmed in a standard RT-PCR using the One step RT-PCR system (Qiagen). The serially diluted RNA samples were further analyzed using the same procedure. The amplified samples were visualized in 1% agarose gels using ethidium bromide staining. The DNA bands corresponding to each serial dilution were quantified using Quality One software (Bio-Rad). The values obtained were standardized against an internal β-actin control (data not shown) and expressed as percentages of Cav-1 expression from parental HepaRG cells.
Real-time RT-PCR.
Total RNA from control or HBV-infected cells was isolated using an RNeasy minikit (Qiagen) for viral replication. The RNA was quantified using a Corbett Rotor Gene 6000 real-time PCR system and the SensiMix One-Step Kit (Quantance). Primers were designed to amplify a 279-bp HBV-specific fragment (data not shown). For viral quantification, a calibration curve containing known amounts of HBV was used. The values obtained were standardized against an internal β-actin control (data not shown). Endogenous Cav-1 expression during differentiation of the HepaRG cells was also monitored using the Cav-1FL primers.
Quantification of intracellular HBV antigen expression by ELISA.
HBV-infected HepaRG cells were lysed in 50 mM Tris-Cl (pH 7.5), 150 mM NaCl, 2 mM EDTA buffer containing 0.5% Triton X-100 for 1 h on ice. The lysates were clarified by centrifugation at 10,000 × g for 15 min. The protein content in the supernatant was determined using the bicinchoninic acid method. The sample volumes were adjusted to equal amounts of total protein, and the level of HBsAg expression was determined using the Monolisa HBsAg Ultra kit (Bio-Rad) according to the manufacturer's instructions. The results were obtained as ratios of signal to cutoff and were converted to percentages of HBsAg expression.
Cell transfection and quantification of HBV replication and secretion.
Plasmids pLNCX2-EGFP-Dyn-2, pLNCX2-EGFP-Dyn-2K44A, pLNCX2-Cav-1-IRES-GFP, and pLNCX2-Cav-1Δ1-81-IRES-GFP were used to transfect the HepG2.2.2.15 cell monolayers twice, at 24-h intervals, using the Fugene 6 transfection reagent (Roche), following the manufacturer's protocols. The transfection rate was estimated to be about 40%, based on the number of GFP/EGFP-expressing cells counted under the microscope. Both cells and supernatants were collected at 24 h after the second transfection. Encapsidated viral DNA was purified by phenol-chloroform extraction from transfected cells as described previously (17), and real-time PCR was performed using the SensiMix Plus Kit (Quantance) and the same primers as for the real-time RT-PCR described above. Secretion of HBsAg was determined in cell supernatants following centrifugation for 5 min at 2,000 × g by using the Monolisa HBsAg Ultra kit, as described above.
In a parallel experiment, proliferating HepaRGDyn-2, HepaRGDyn-2K44A, HepaRGCav-1, and HepaRGCav-1Δ1-81 cells were transfected with pTriExHBV 1.1. The plasmid contains 1.1 units of the whole HBV genome cloned into NotI and SphI sites and is able to support viral replication, assembly, and secretion of fully infectious virions (our unpublished data). The transfected cells were maintained in culture for 7 days to allow accumulation of mature virions. The amount of virus produced in each cell line was further quantified as described for the HepG2.2.2.15 cells.
RESULTS
Biochemical characterization of HepaRG cell lines overexpressing wild-type and dominant-negative Cav-1 and Dyn-2.
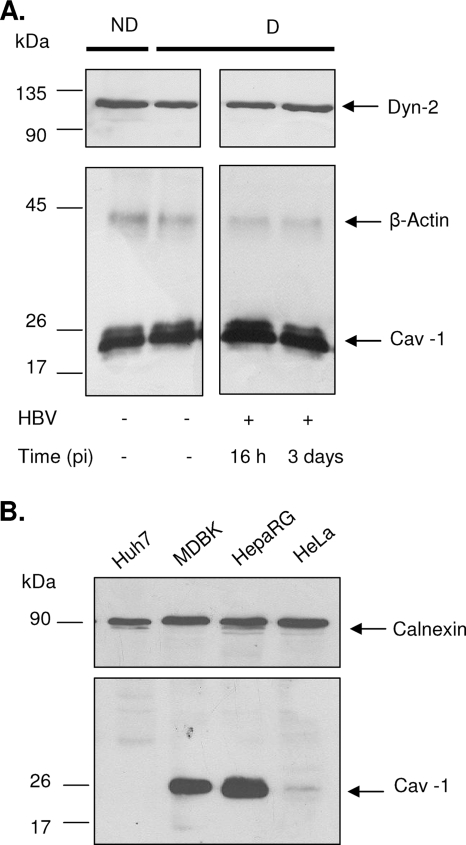
Caveola-dependent endocytosis is characterized by its dependence on functional caveolin and sensitivity to dynamin inhibition and cholesterol depletion. To investigate the role of caveolae in the HBV entry pathway, HepaRG cell lines stably expressing wild-type Cav-1 (HepaRGCav-1), N-terminally truncated Cav-1 (HepaRGCav-1Δ1-81), wild-type Dyn-2 (HepaRGDyn-2), and mutant Dyn-2 with no GTPase activity (HepaRGDyn-2K44A) were established. Since few or no caveolae are present in cell lines in which Cav-1 expression is reduced or absent (12), the levels of endogenous Cav-1 and Dyn-2 were first determined by Western blotting in the parental HepaRG cells in both nondifferentiated and differentiated states. As shown in Fig. 1A, Cav-1 and Dyn-2 were synthesized in detectable amounts in HepaRG cells, and their expression levels were not significantly altered during the 4 weeks of differentiation. Interestingly, a transient increase in Cav-1 expression was observed in HepaRG cells during HBV infection, while Dyn-2 expression did not change. This could be due to better susceptibility of Cav-1 to detergent extraction, as a result of virus binding to the plasma membrane and further internalization. A direct comparison of Cav-1 expression in HepaRG and epithelial cells, such as HeLa and MDBK cells, which are well known for their ability to form caveolae, showed that the highest level was synthesized in HepaRG cells (Fig. 1B), while another hepatoma-derived cell line, Huh7, completely lacked Cav-1 expression (35). Although not a direct proof that Cav-1 is expressed in caveolae in HepaRG cells, the important amount of the protein available in these cells and its transient increase during HBV infection are indications of a role in this process.
FIG. 1.
Cav-1 and Dyn-2 expression in HepaRG and control cell lines. (A) Lysates of nondifferentiated (ND), differentiated (D), and HBV-infected HepaRG cells at 16 h and 3 days p.i. (+HBV) were quantified for the total protein content, and equal amounts of protein were loaded on SDS-PAGE. Endogenous Cav-1 and Dyn-2 were determined by Western blotting, using anti-Cav-1 and anti-Dyn-2 Ab. Expression of β-actin was used as a loading control. (B) The level of endogenous Cav-1 expression was determined in lysates of Huh7, MDBK, HepaRG, and HeLa cells, as for panel A, using calnexin as a loading control.
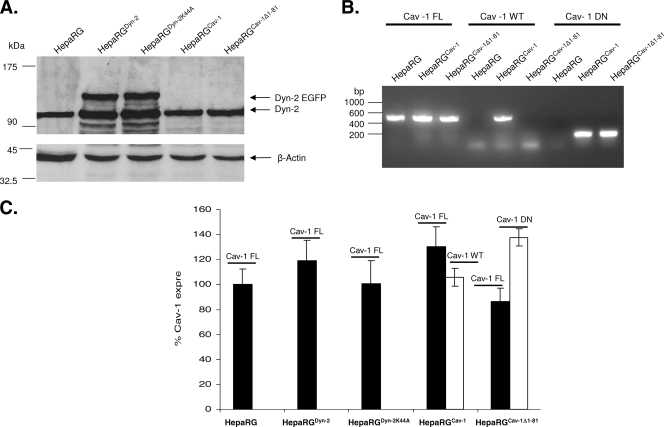
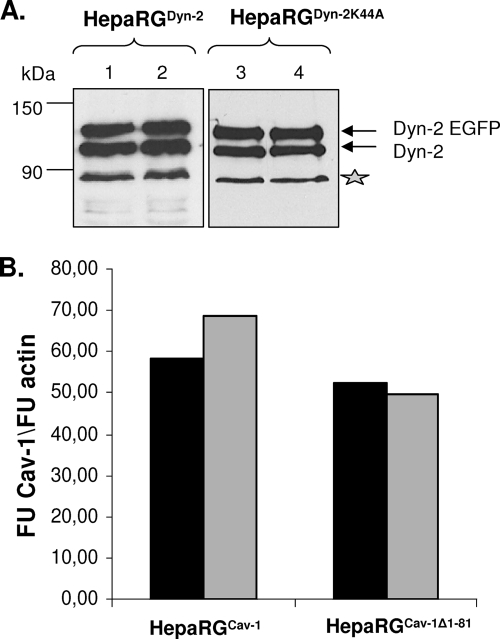
A similar Western blotting experiment was performed to analyze the endogenous and overexpressed Dyn-2 in HepaRGDyn-2, HepaRGDyn-2K44A, HepaRGCav-1, and HepaRGCav-1Δ1-81 lines compared to parental HepaRG cells (Fig. 2A). As expected, in addition to the endogenous Dyn-2, an upper band with the apparent electrophoretic mobility of EGFP-fused Dyn-2 was identified in both HepaRGDyn-2 (Dyn-2-EGFP) and HepaRGDyn-2K44A (Dyn-2K44A-EGFP) cells. The expression level of the fused protein was comparable to that of the endogenous Dyn-2 in the parental HepaRG, as well as HepaRGCav-1 and HepaRGCav-1Δ1-81, cell line, suggesting similar turnover rates. A slight increase in the intensity of the band corresponding to the endogenous Dyn-2 was observed in HepaRG cells overexpressing both wild-type and dominant-negative Dyn-2. This could be the result of a partial cleavage of EGFP from the recombinant protein rather than of compensatory mechanisms activated in cells expressing GTPase-deficient Dyn-2 (Fig. 2A). The ratio between endogenous and recombinant wild-type and mutant Dyn-2 was maintained throughout differentiation of HepaRG cells, demonstrating the stability of the cell lines (Fig. 3A).
FIG. 2.
Analysis of wild-type and dominant-negative Cav-1 and Dyn-2 expression in HepaRG cells. (A) HepaRG, HepaRGDyn-2, HepaRGDyn-2K44A, HepaRGCav-1, and HepaRGCav-1Δ1-81 cells were maintained in culture for 2 weeks and lysed, and the total protein content was quantified. Equal amounts of protein were analyzed by SDS-PAGE, followed by Western blotting of endogenous and overexpressed Dyn-2 (marked as Dyn-2 and Dyn-2 EGFP, respectively) using anti-Dyn-2 Ab. The amount of β-actin in each sample was used as a loading control. (B and C) HepaRG, HepaRGDyn-2, HepaRGDyn-2K44A, HepaRGCav-1, and HepaRGCav-1Δ1-81 cells were grown in duplicate samples for 2 weeks and lysed. Total RNA was purified and subjected to standard (B) or semiquantitative (C) RT-PCR analysis using three different pairs of primers: Cav-1-FL, Cav-1-WT, and Cav-1-DN, to discriminate between endogenous (black bars), and overexpressed (open bars) wild-type and dominant-negative Cav-1. (C) The results are shown as percentage of Cav-1 expression in parental HepaRG cells. The error bars represent the standard deviations between two independent experiments.
FIG. 3.
Dyn-2 and Cav-1 expression in HepaRG cell lines is stable during differentiation. HepaRGDyn-2, HepaRGDyn-2K44A, HepaRGCav-1, and HepaRGCav-1Δ1-81 cells were differentiated in the presence of 1.8% DMSO or maintained undifferentiated by splitting them at 2-day intervals in normal growing medium as controls. (A) Undifferentiated (lanes 1 and 3) and differentiated (lanes 2 and 4) HepaRGDyn-2 and HepaRGDyn-2K44A cells were lysed, and equal amounts of protein were subjected to SDS-PAGE, followed by Western blotting analysis of endogenous and overexpressed Dyn-2 (marked as Dyn-2 and Dyn-2 EGFP, respectively) using anti-Dyn-2 Ab. The contaminating band, marked with an asterisk and usually present in retrovirus-infected HepaRG cells, was used as a loading control. (B) Undifferentiated (black bars) and differentiated (open bars) HepaRGCav-1 and HepaRGCav-1Δ1-81 cells were lysed, and total RNA was purified. Cav-1 expression was quantified by real-time RT-PCR using the Cav-1-FL primers. Amplification of β-actin in the same samples was used as a loading control. The results were expressed as Cav-1 fluorescence units (FU) divided by β-actin FU.
Cav-1 Ab, used in this study, recognizes the endogenous, as well as the overexpressed, wild-type Cav-1, but not the mutant variant lacking the 81-amino-acid fragment of the N-terminal part (Fig. 1A and data not shown). Therefore, a PCR approach was taken to investigate Cav-1 expression. Specific oligonucleotides were designed to discriminate between endogenous and overexpressed wild-type Cav-1 on one hand and Cav-1Δ1-81 on the other hand. The specificity of the primers was confirmed by standard RT-PCR (Fig. 2B), and the presence of Cav-1 and β-actin transcripts was further analyzed by semiquantitative RT-PCR in all HepaRG cell lines (Fig. 2C). The endogenous Cav-1 transcripts were expressed at comparable levels in all cell lines, regardless of whether they also expressed wild-type or dominant-negative Dyn-2/Cav-1. Similar to Dyn-2, Cav-1 expression did not change significantly throughout the differentiation of HepaRG cells, as demonstrated by real-time RT-PCR using the Cav-1-FL primers in an independent experiment (Fig. 3B). Altogether, the results show that the HepaRGDyn-2, HepaRGDyn-2K44A, HepaRGCav-1, and HepaRGCav-1Δ1-81 cells can support differentiation and can be further used as models to investigate HBV entry.
Endocytic properties of HepaRG cell lines overexpressing wild-type and dominant-negative Cav-1.
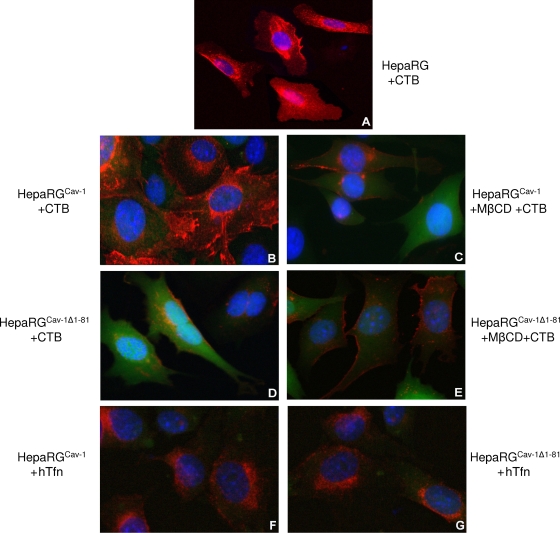
To validate the effect of dominant-negative Cav-1 expression on the internalization properties of the HepaRG cells, CTB uptake was monitored by fluorescence microscopy. Owing to its targeting to caveolae through the ganglioside GM1 receptor, CTB has been largely used as a marker for caveolin-dependent endocytosis in many cells (20). In both HepaRG and HepaRGCav-1 cell lines, fluorescently labeled CTB was readily internalized and concentrated around the cell nucleus, a pattern described for other cell lines (Fig. 4A and B) (29). In contrast, CTB was poorly endocytosed in HepaRGCav-1Δ1-81 cells, as fluorescence appeared mainly diffuse in the cytoplasm and also decorating the cell plasma membrane (Fig. 4D). The green, diffuse fluorescence present in both HepaRGCav-1 and HepaRGCav-1Δ1-81 cells is due to the cytoplasmic localization of GFP, expressed along with Cav-1 from the bicistronic retroviral plasmid. Despite the large amount of internalized CTB, no colocalization with GFP was observed, confirming the specific uptake of the toxin through vesicles of the endocytic pathway.
FIG. 4.
Endocytic properties of HepaRG, HepaRGCav-1, and HepaRGCav-1Δ1-81 cells. Six-week-old cells were grown on chamber slides for 24 h and then treated with either 4 μg/ml CTB-Alexa Fluor 594 (A to E) or 50 μg/ml hTfn-Alexa Fluor 594 (F and G) for 30 min at 4°C. Before CTB addition, cells were treated with 10 mM MβCD for 30 min (C and E) or left untreated as controls (A, B, and D). The cells were washed with PBS and further incubated for 2 h at 37°C. Internalization of the fluorescently labeled CTB and hTfn (both red) was observed using a Nikon Eclipse E600 microscope, following mounting with Vectashield Mounting Medium containing DAPI, to visualize the nuclei (blue). The green, diffuse fluorescence within cells (B to G) is due to the cytoplasmic localization of GFP, expressed along with Cav-1, from the bicistronic retroviral plasmid.
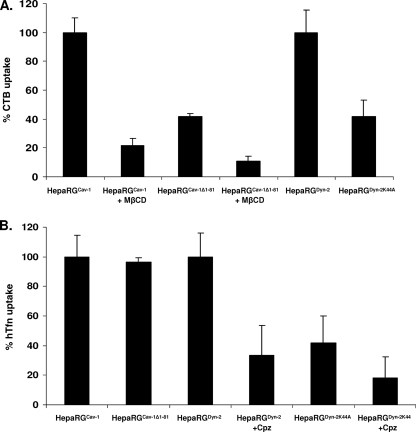
It has been shown that caveola-mediated uptake of CTB is strongly affected by sterol-binding compounds (19). Thus, to further characterize the endocytic properties of HepaRGCav-1 and HepaRGCav-1Δ1-81 cells and their responses to altered levels of plasma membrane cholesterol, CTB internalization was also studied in the presence of 10 mM MβCD. As shown in Fig. 4C, CTB entry into MβCD-treated HepaRGCav-1 cells was similar to that observed in untreated HepaRGCav-1Δ1-81 cells. CTB fluorescence was barely visible at the plasma membrane in MβCD-treated HepaRGCav-1Δ1-81 cells, demonstrating a strong inhibition of entry when both cholesterol level and Cav-1 function are perturbed (Fig. 4E). Inhibition of CTB entry in HepaRGCav-1Δ1-81 cells also showed that expression of dominant-negative Cav-1 was not compensated for by upregulating other, non-caveola-mediated pathways that CTB could use as alternatives to enter the cells. To rule out a potential general inhibitory effect on cell endocytosis when expressing mutant Cav-1, internalization of hTfn—a well-characterized marker for clathrin-dependent receptor-mediated entry—was investigated in addition to that of CTB (27). As shown in Fig. 4F and G, hTfn was taken up at similar levels by both HepaRGCav-1 and HepaRGCav-1Δ1-81, confirming the specificity of the dominant-negative Cav-1 in perturbing the caveola-dependent entry. Using a spectrofluorimetric approach, the uptake of both endocytic markers was further investigated in these cell lines in a quantitative manner. The results (see Fig. 6A) confirmed the efficiency of Cav-1Δ1-81 expression to alter the caveola-mediated pathway (60% inhibition of CTB internalization), while hTfn entry was not affected (see Fig. 6B).
FIG. 6.
Quantitative determination of CTB and hTfn uptake by spectrofluorimetry. HepaRGCav-1, HepaRGCav-1Δ1-81, HepaRGDyn-2, and HepaRGDyn-2K44A cells were differentiated before treatment with either 4 μg/ml CTB-Alexa Fluor 594 (A) or 25 μg/ml hTfn-Alexa Fluor 594 (B) for 30 min at 4°C. The cells were washed with PBS and incubated for 30 min at 37°C. Where indicated, the cells were pretreated with either 10 mM MβCD (+ MβCD) or 10 mg/ml Cpz (+Cpz), and the inhibitors were maintained during ligand internalization. The cells were washed with PBS and lysed in CHAPS-HSE buffer, and the amounts of fluorescent markers were quantified using a Jasco FP-6500 spectrofluorimeter (590-nm excitation/617-nm emission wavelengths). Fluorescence was normalized to the total cell protein content. The results were expressed as percentages of fluorescence, taking the wild-type-expressing Cav-1 or Dyn-2 HepaRG cells as controls for cells expressing their dominant-negative counterpart. The error bars represent the standard deviations between two independent experiments, each run in triplicate.
Endocytic properties of HepaRG cell lines overexpressing wild-type and dominant-negative Dyn-2.
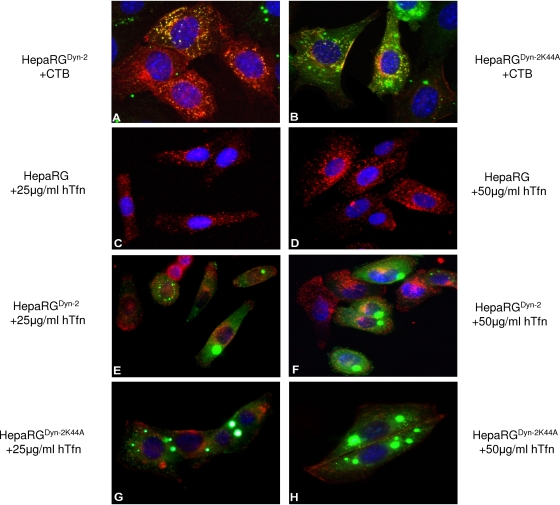
Dynamins are important regulators of both caveola- and clathrin-mediated endocytosis, as well as other non-caveola-, non-clathrin-dependent entry pathways (8, 16). The GTPase-deficient Dyn-2 (Dyn-2K44A) has been the mutant of choice to study the roles of these pathways in many different membrane traffic events, including virus entry into target cells (31). To define the effects of wild-type and mutant Dyn-2 expression on cell endocytosis, the internalization of hTfn and CTB was investigated, as described above. The green, punctate fluorescence in HepaRGDyn-2 and HepaRGDyn-2K44A cells was the result of EGFP expression as a fusion protein with either Dyn-2 or Dyn-2K44A. The dominant-negative Dyn-2 efficiently reduced CTB entry into HepaRGDyn-2K44A cells (Fig. 5B) and almost completely inhibited uptake of hTfn, which mostly remained attached to the plasma membrane (Fig. 5G and H). This indicated that in this cell line, non-clathrin-, non-caveola-mediated pathways were either not upregulated in compensation for the perturbed entry routes or not used by the two endocytic markers. In contrast, overexpression of wild-type Dyn-2 did not have any effect on entry of either CTB (Fig. 5A) or hTfn (Fig. 5E and F). The fluorescence levels of both endocytic markers in HepaRGDyn-2 cells were similar to that found in parental HepaRG cells (Fig. 4A and 5C and D). Similar to Cav-1-expressing cell lines, the amounts of CTB and hTfn taken up by these cells were measured by spectrofluorimetry in the absence or the presence of a clathrin coat assembly inhibitor, Cpz. Interestingly, a similar inhibitory effect, of about 58%, was observed for both CTB and hTfn entry in HepaRGDyn-2K44A cells compared to the wild-type Dyn-2-expressing cells (Fig. 6A and B). This inhibition is close to that obtained for hTfn in the presence of Cpz (67%), confirming the ability of Dyn-2K44A to disrupt the clathrin-mediated endocytosis in these cells.
FIG. 5.
Endocytic properties of HepaRGDyn-2 and HepaRGDyn-2K44A cells. Six-week-old cells were grown on chamber slides for 24 h and then treated with either 4 μg/ml CTB-Alexa Fluor 594 (A and B) or hTfn-Alexa Fluor 594 at 25 (C, E, and G) and 50 (D, F, and H) μg/ml for 30 min at 4°C. The cells were washed with PBS and incubated for 2 h at 37°C. Internalization of the fluorescently labeled CTB or hTfn (both red) was observed using a Nikon Eclipse E600 microscope, following mounting with Vectashield Mounting Medium containing DAPI, to visualize the nuclei (blue). The green, punctate fluorescence within cells (A, B, E, F, G, and H) is the result of EGFP expression as a fusion protein with either Dyn-2 or Dyn-2K44A.
HBV infection in HepaRGCav-1, HepaRGCav-1Δ1-81, HepaRGDyn-2, and HepaRGDyn-2K44A cell lines.
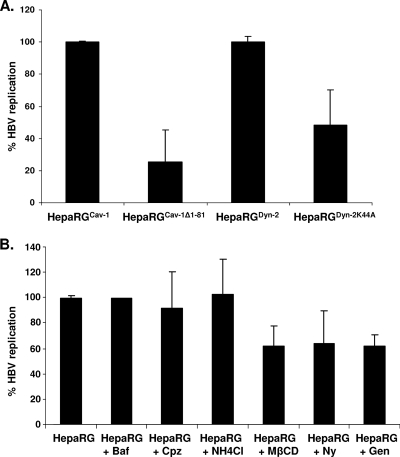
Having characterized the endocytic properties of the newly established HepaRG cells, we next assayed the ability of HBV to initiate productive infection in these cells. Prior to virus infection, all cell lines were differentiated in six-well collagen-coated plates, as described previously (17). The cells were successfully maintained in culture during differentiation, regardless of whether they overexpressed wild-type or dominant-negative Cav-1 or Dyn-2, and their morphology was similar to that of the parental HepaRG cells (data not shown). The virus purified from the HepG2.2.2.15 cell supernatants was quantified, and equal amounts were used for infection of the cell lines. Chemical inhibitors of both clathrin- and caveola-mediated endocytosis (31) were also included in independent experiments as controls. The synthesis of HBV-specific transcripts and proteins was quantified by real-time RT-PCR and ELISA, respectively, at 11 days p.i. To rule out any potential interference with HBV replication of either GFP/EGFP expression or other factors resulting from the retroviral infection of the parental HepaRG cells, the wild-type-expressing Cav-1 or Dyn-2 cells were used as controls for cells expressing their dominant-negative counterparts. The real-time RT-PCR results showed strong inhibition (75%) of HBV infection in HepaRGCav-1Δ1-81 compared to HepaRGCav-1 cells, while a more moderate effect (about 52%) was obtained in HepaRGDyn-2K44A compared to HepaRGDyn-2 cells (Fig. 7A).
FIG. 7.
HBV infection of HepaRG, HepaRGCav-1, HepaRGCav-1Δ1-81, HepaRGDyn-2, and HepaRGDyn-2K44A cell lines. (A) Cells were differentiated for 4 weeks as described in Materials and Methods and infected with 50 μl of HBV inoculum containing 2 × 10¹⁰ genome equivalents/ml. A negative control sample was included for each cell line, consisting of mock-infected cells. The viral inoculum was removed the following day, and the cells were washed with PBS before further incubation for 11 days. The level of HBV specific transcripts within infected cells was quantified by real-time RT-PCR and normalized to a β-actin internal control following substraction of the NC values. The results were expressed as percentages of HBV replication, taking the wild-type-expressing Cav-1 or Dyn-2 HepaRG cells as controls for cells expressing their dominant-negative counterpart. (B) As for panel A, except that HepaRG cells were treated with either 25 μg/ml Ny, 10 mM MβCD, 50 mM NH4Cl, 200 nM Baf, 10 mg/ml Cpz, or 50 μg/ml Gen for 2 h prior to HBV infection or left untreated (control). The drugs were either removed when the viral inoculum was added to the cells (Ny and MβCD) or maintained during infection (NH4Cl, Baf, Cpz, and Gen). The results were expressed as percentage of HBV replication from untreated controls. The error bars represent the standard deviation between two independent experiments, each run in triplicate samples (A and B).
HBV infection was only slightly affected (35% inhibition) when Ny and MβCD were used to decrease the cholesterol level in the parental HepaRG cells (Fig. 5B). For these drugs, the treatment was discontinued prior to HBV infection to avoid alteration of the viral envelope, which is sensitive to cholesterol-depleting reagents (6). Thus, the short time of cell exposure to the drugs, accompanied by the complete reversibility of their effects upon removal, may explain the attenuated consequences for viral infection compared to the strong effect observed in HepaRGCav-1Δ1-81 cells (25). A similar effect on HBV infection was obtained in the presence of Gen, an inhibitor of tyrosine kinases involved in caveola-mediated endocytosis (21). In this case, the cells were treated with the drug throughout infection; however, a moderate concentration (50 μg/ml) was used to avoid cellular toxicity due to prolonged incubation (18). Of the clathrin-mediated pathway inhibitors, neither the endosomal pH modulators NH4Cl and Baf nor the coat assembly inhibitor Cpz was toxic or had any effect on HBV infection, in spite of the treatment being maintained during virus inoculation of the cells (Fig. 7B).
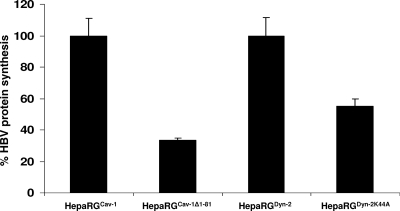
The consequences of altered Cav-1 and Dyn-2 functions for HBV protein synthesis were also investigated, using a standard ELISA kit. The amount of HBsAg in HepaRGCav-1Δ1-81- and HepaRGDyn-2K44A-infected cells was reduced by about 70 and 45%, respectively, compared to that from the control cell lines expressing the wild-type counterparts (Fig. 8), thus confirming the inhibitory effect observed at the transcriptional level. These results are in agreement with the effects of the mutant Cav-1 and Dyn-2 on CTB internalization in HepaRG cells, suggesting a clear dependence of HBV infection on functional Cav-1 and sensitivity to Dyn-2 inhibition.
FIG. 8.
HBsAg biosynthesis in HepaRGCav-1, HepaRGCav-1Δ1-81, HepaRGDyn-2, and HepaRGDyn-2K44A cell lines. Cells were differentiated, infected with HBV as described in Materials and Methods, and harvested at 11 days p.i. The cells were lysed, and the level of HBsAg expression was determined by ELISA. The values of optical density units were divided by the total protein content in each sample. The results were expressed as percentage of HBsAg expression, taking the wild-type-expressing Cav-1 or Dyn-2 HepaRG cells as controls for cells expressing their dominant-negative counterpart. The error bars represent the standard deviations between three independent experiments, each run in triplicate samples. The cutoff values varied between 0.085 to 0.095.
HBV replication is not affected by overexpression of dominant-negative Cav-1 and Dyn-2.
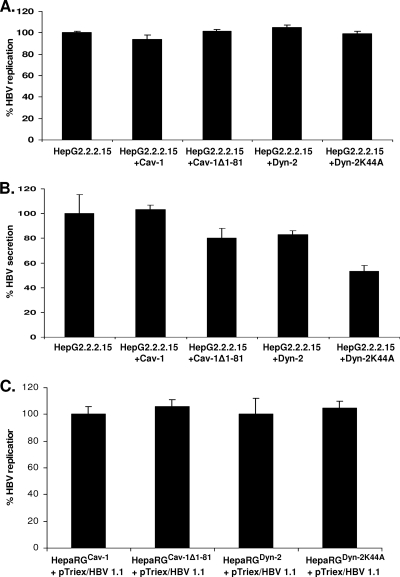
To investigate potential direct interference with HBV replication in cells expressing mutant Cav-1 and Dyn-2, two control experiments were performed. In a first approach, the proteins were transiently expressed in HepG2.2.2.15 cells, which are not permissive for HBV infection, thus allowing a clear distinction between viral entry and later steps of the life cycle. In the second approach, the plasma membrane events were bypassed by transfecting the replication- and assembly-competent pTriExHBV1.1 plasmid into proliferating HepaRGCav-1, HepaRGCav-1Δ1-81, HepaRGDyn-2, and HepaRGDyn-2K44A cell lines. The amounts of virus produced in both transfected HepG2.2.2.15 and HepaRG cells were quantified by real-time PCR, and secretion of HBsAg was quantified by ELISA. As shown in Fig. 9, HBV was replicated at similar levels in these cells, regardless of whether they expressed the wild-type or dominant-negative variants of Cav-1 and Dyn-2, stably or transiently. Interestingly, a significant inhibitory effect of Dyn-2K44A was clearly observed when secretion of HBsAg was monitored in the cell media of HepG2.2.2.15 cells. This is in agreement with previously published data showing a role for Dyn-2 in a postreplication/assembly step necessary for HBV secretion from HepG2.2.2.15 cells (1). The result also confirms that the transfection rate in these cells was sufficiently high to ensure an inhibitory level of expression of the investigated structural proteins.
FIG. 9.
HBV replication in cells overexpressing Cav-1 and Dyn-2 wild-type and dominant-negative proteins. (A and B) HepG2.2.2.15 cell monolayers were transfected twice with the pLNCX2 plasmids coding for the wild-type and mutant Cav-1 and Dyn-2. The transfection rate was estimated to be about 40%, based on the number of GFP/EGFP-expressing cells counted under the microscope. Both cells (A) and supernatants (B) were collected at 24 h after the second transfection. (C) Proliferating HepaRGDyn-2, HepaRGDyn-2K44A, HepaRGCav-1, and HepaRGCav-1Δ1-81 cells were transfected with pTriExHBV 1.1 and maintained in culture for 7 days without splitting. The amount of encapsidated viral DNA was determined by real-time PCR (A and C), and secretion of HBsAg was determined in cell supernatants by ELISA (B). The cutoff value was 0.085. The error bars represent the standard deviations between two independent experiments, each run in triplicate samples.
DISCUSSION
While an important amount of data on HBV replication and assembly is now available, the early steps of the life cycle remain obscure for reasons related to the poor in vitro infectivity systems available, which until recently were based on primary human and chimpanzee hepatocytes (14). Thus, most of the findings on hepadnaviral entry came from the more robust DHBV infectivity model and were assumed to apply to HBV. The development of the proliferating HepaRG cell line opened up new possibilities to explore HBV infection in a more specific and accurate manner. One option to investigate the routes of virus infection in target cells is the use of chemical inhibitors that target intracellular structural proteins, enzymes, or signal transduction molecules with established functions in entry pathways (31). However, this approach should be treated with caution, as these drugs often have pleiotropic effects on cell function and become toxic with prolonged treatment. The use of chemical compounds is particularly difficult in studying HBV entry, which requires long incubation time of the cells with the viral inoculum for efficient infection (16 to 20 h) (6, 15). Also, the postentry processes seem to proceed very slowly, as viral replication markers are not detectable before 6 days p.i., making the inhibition effects more difficult to interpret.
The development of nonchemical inhibitors in the form of dominant-negative molecules provided a more specific way to analyze the functions of defined cellular pathways, minimizing the side effects associated with the use of chemical inhibitors. When expressed at high levels, dominant-negative mutant versions of cellular proteins act by overwhelming the wild-type protein, perturbing its function. Overexpression of Dyn-2K44A or Cav-1 deletion mutants, usually over a short time, has been successfully used to dissect the entry pathways of a plethora of viruses (3, 11, 28). However, this too is problematic to achieve in the HBV infectivity systems currently available, since primary hepatocytes are notoriously difficult to transfect and the HepaRG cells proved refractory to transient transfections or viral infection/transduction once differentiated (data not shown). To overcome these difficulties, we took a different approach and first infected the HepaRG cells with retroviral vectors encoding wild-type/mutant Cav-1 and Dyn-2 at the nondifferentiated stage and cloned them under G418 treatment. The resulting cell lines, designated HepaRGCav-1, HepaRGCav-1Δ1-81, HepaRGDyn-2, and HepaRGDyn-2K44A, were then subjected to differentiation and HBV infection.
Cells expressing dominant-negative proteins may tend to upregulate mechanisms in compensation for the lost function, especially when inhibition is maintained over a longer time frame. To investigate such potential interference in our system, the endocytosis characteristics of the established cell lines were monitored at 2-week intervals, using specific markers for caveola- and clathrin-mediated entry. The expression of the endogenous proteins, whose functions were interfered with, was also examined in cells overexpressing their mutant counterparts. Together, the results of these experiments demonstrated that the cell lines were stable, maintained their properties during differentiation, and were susceptible to HBV infection.
Of the two dominant-negative proteins used in our study, the Cav-1 deletion mutant effectively prevented internalization of the caveolar ligand CTB and inhibited HBV infection, while Dyn-2K44A had a more moderate effect. Overexpression of the dominant-negative proteins did not interfere with HBV replication, which shows that an earlier event in the viral life cycle must be affected. Since Cav-1 is the key player in caveola structure and function, these results strongly point at HBV using a caveola-mediated endocytosis pathway to enter the cells. Ligand internalization through caveolae, although very efficient, is a slow process and occurs in the neutral pH range, bypassing the acidic endosomal route characteristic of the clathrin-dependent entry pathway. Both acidification inhibitors used in our study, NH4Cl and Baf, which specifically block the vacuolar H+ ATPase pumps, have no effect on HBV infection in HepaRG cells. In addition, treatment with the clathrin assembly inhibitor Cpz had no consequences for the rate of infection, despite prolonged incubation with the cells. These results support the notion that HBV is not using a clathrin-mediated, pH-dependent entry route. Interestingly, the virus is also able to translocate trophoblastic cells, a process known to be mediated by caveolae (5).
Recently published data demonstrated that DHBV preferentially binds to detergent-soluble domains of the duck hepatocyte plasma membrane (13). Combined with the failure of MβCD treatment to inhibit DHBV infection, the observation suggests that caveolae may not be involved in DHBV entry. However, following internalization in primary duck hepatocytes, the virus was found in Cav-1-positive endosomes, as well as the cytosol. Thus, the hypothesis that DHBV may use both Cav-1-dependent and -independent endocytic pathways to gain access into cells cannot be entirely ruled out. The discrepancy between HBV and DHBV may be a consequence of different uptake strategies adopted within the family Hepadnaviridae by the two prototypes of the genera Orthohepadnavirus and Avihepadnavirus. Similar behavior has been documented for other families of viruses; for example, extensive work performed on polyomaviruses showed that despite the high similarity between the members of this family, they use different endocytic routes to invade the host (2, 23).
In conclusion, the data presented in this work are consistent with a mechanism implicating caveolae in the cellular uptake of HBV. The caveola-mediated entry seems to avoid the degradative endosomal-lysosomal route and can be stimulated by virus binding on the cell surface. This process has been well documented for simian virus 40, which was shown to enhance the pool of trafficking-competent, mobile caveolae and possibly to induce the formation of new ones (33). It is tempting to hypothesize that the transient increase in the amount of detergent-extractable Cav-1 observed during early HBV infection in HepaRG cells may be a consequence of signaling activation upon virus binding to its receptor(s). The molecular details of the internalization events, as well as the intracellular trafficking and the delivery of the HBV genome to the nucleus of the host cell, are yet to be determined.
Acknowledgments
This work was supported by the Idei Grant of the Romanian National Council for Research and Higher Education (CNCSIS), ID_84, and a Collaborative Research International Grant awarded by the Wellcome Trust to N.N.
Footnotes
Published ahead of print on 21 October 2009.
REFERENCES
- 1.Abdulkarim, A. S., H. Cao, B. Huang, and M. A. McNiven. 2003. The large GTPase dynamin is required for hepatitis B virus protein secretion from hepatocytes. J. Hepatol. 38:76-83. [DOI] [PubMed] [Google Scholar]
- 2.Anderson, H. A., Y. Chen, and L. C. Norkin. 1996. Bound simian virus 40 translocates to caveolin enriched membrane domains, and its entry is inhibited by drugs that selectively disrupt caveolae. Mol. Biol. Cell 7:1825-1834. [DOI] [PMC free article] [PubMed] [Google Scholar]
- 3.Bartlett, J. S., R. Wilcher, and R. J. Samulski. 2000. Infectious entry pathway of adeno-associated virus and adeno-associated virus vectors. J. Virol. 74:2777-2785. [DOI] [PMC free article] [PubMed] [Google Scholar]
- 4.Bender, F. C., J. C. Whitbeck, M. Ponce de Leon, H. Lou, R. J. Eisenberg, and G. H. Cohen. 2003. Specific association of glycoprotein B with lipid rafts during herpes simplex virus entry. J. Virol. 77:9542-9552. [DOI] [PMC free article] [PubMed] [Google Scholar]
- 5.Bhat, P., and D. A. Anderson. 2007. Hepatitis B virus translocates across a trophoblastic barrier. J. Virol. 81:7200-7207. [DOI] [PMC free article] [PubMed] [Google Scholar]
- 6.Bremer, C. M., C. Bung, N. Kott, M. Hardt, and D. Glebe. 2009. Hepatitis B virus infection is dependent on cholesterol in the viral envelope. Cell Microbiol. 11:249-260. [DOI] [PubMed] [Google Scholar]
- 7.Chojnacki, J., D. A. Anderson, and E. V. Grgacic. 2005. A hydrophobic domain in the large envelope protein is essential for fusion of duck hepatitis B virus at the late endosomes. J. Virol. 79:14945-14955. [DOI] [PMC free article] [PubMed] [Google Scholar]
- 8.Conner, S. D., and S. L. Schmid. 2003. Regulated portals of entry into the cell. Nature 422:37-44. [DOI] [PubMed] [Google Scholar]
- 9.Cook, T. A., R. Urrutia, and M. A. McNiven. 1994. Identification of dynamin 2, an isoform ubiquitously expressed in rat tissues. Proc. Natl. Acad. Sci. U. S. A. 91:644-648. [DOI] [PMC free article] [PubMed] [Google Scholar]
- 10.Deurs, B. V., K. Roepstorff, A. M. Hommelgaard, and K. Sandvig. 2003. Caveolae: anchored, multifunctional platforms in the lipid ocean. Trends Cell Biol. 13:92-100. [DOI] [PubMed] [Google Scholar]
- 11.Eash, S., W. Querbes, and W. J. Atwood. 2004. Infection of Vero cells by BK virus is dependent on caveolae. J. Virol. 78:11583-11590. [DOI] [PMC free article] [PubMed] [Google Scholar]
- 12.Fra, A. M., E. Williamson, K. Simons, and R. G. Parton. 1995. De novo formation of caveolae in lymphocytes by expression of VIP21-caveolin. Proc. Natl. Acad. Sci. U. S. A. 92:8655-8659. [DOI] [PMC free article] [PubMed] [Google Scholar]
- 13.Funk, A., M. Mhamdi, H. Hohenberg, J. Heeren, R. Reimer, C. Lambert, R. Prange, and H. Sirma. 2008. Duck hepatitis B virus requires cholesterol for endosomal escape during virus entry. J. Virol. 82:10532-10542. [DOI] [PMC free article] [PubMed] [Google Scholar]
- 14.Glebe, D., and S. Urban. 2007. Viral and cellular determinants involved in hepadnaviral entry. World J. Gastroenterol. 13:22-38. [DOI] [PMC free article] [PubMed] [Google Scholar]
- 15.Gripon, P., S. Rumin, S. Urban, J. Le Seyec, D. Glaise, I. Cannie, C. Guyomard, J. Lucas, C. Trepo, and C. Guguen-Guillouzo. 2002. Infection of a hepatoma cell line by hepatitis B virus. Proc. Natl. Acad. Sci. U. S. A. 99:15655-15660. [DOI] [PMC free article] [PubMed] [Google Scholar]
- 16.Henley, J. R., E. W. Krueger, B. J. Oswald, and M. A. McNiven. 1998. Dynamin-mediated internalization of caveolae. J. Cell Biol. 141:85-99. [DOI] [PMC free article] [PubMed] [Google Scholar]
- 17.Lazar, C., D. Durantel, A. Macovei, N. Zitzmann, F. Zoulim, R. A. Dwek, and N. Branza-Nichita. 2007. Treatment of hepatitis B virus-infected cells with alpha-glucosidase inhibitors results in production of virions with altered molecular composition and infectivity. Antiviral Res. 76:30-37. [DOI] [PubMed] [Google Scholar]
- 18.Linford, N. J., Y. Yang, D. G. Cook, and D. M. Dorsa. 2001. Neuronal apoptosis resulting from high doses of the isoflavone genistein: role for calcium and P42/44 mitogen-activated protein kinase. J. Pharmacol. Exp. Ther. 299:67-75. [PubMed] [Google Scholar]
- 19.Orlandi, P. A., and P. H. Fishman. 1998. Filipin-dependent inhibition of cholera-toxin: evidence for toxin internalization and activation through caveolae-like domains. J. Cell Biol. 141:905-915. [DOI] [PMC free article] [PubMed] [Google Scholar]
- 20.Pelkmans, L., T. Burli, M. Zerial, and A. Helenius. 2004. Caveolin-stabilized membrane domains as multifunctional transport and sorting devices in endocytic membrane traffic. Cell 118:767-780. [DOI] [PubMed] [Google Scholar]
- 21.Parton, R. G., B. Joggerst, and K. Simons. 1994. Regulated internalization of caveolae. J. Cell Biol. 127:1199-1215. [DOI] [PMC free article] [PubMed] [Google Scholar]
- 22.Parton, R. G. 1996. Caveolae and caveolins. Curr. Opin. Cell Biol. 8:542-548. [DOI] [PubMed] [Google Scholar]
- 23.Pho, M. T., A. Ashok, and W. J. Atwood. 2000. JC virus enters human glial cells by clathrin-dependent receptor-mediated endocytosis. J. Virol. 74:2288-2292. [DOI] [PMC free article] [PubMed] [Google Scholar]
- 24.Robinson, W. S., D. A. Clayton, and R. L. Greenman. 1974. DNA of a human hepatitis B virus candidate. J. Virol. 14:384-391. [DOI] [PMC free article] [PubMed] [Google Scholar]
- 25.Rodal, S. K., G. Skretting, O. Garred, F. Vilhardt, B. van Deurs, and K. Sandvig. 1999. Extraction of cholesterol with methyl-β-cyclodextrin perturbs formation of clathrin-coated endocytic vesicles. Mol. Biol. Cell 10:961-974. [DOI] [PMC free article] [PubMed] [Google Scholar]
- 26.Rojek, J. M., M. Perez, and S. Kunz. 2008. Cellular entry of lymphocytic choriomeningitis virus. J. Virol. 82:1505-1517. [DOI] [PMC free article] [PubMed] [Google Scholar]
- 27.Rothenberger, S., B. J. Iacopetta, and L. C. Kuhn. 1998. Endocytosis of the transferrin receptor requires the cytoplasmic domain but not its phosphorylation site. Cell 49:423-431. [DOI] [PubMed] [Google Scholar]
- 28.Roy, A. M., J. S. Parker, C. R. Parrish, and G. R. Whittaker. 2000. Early stages of influenza virus entry into Mv-1 lung cells: involvement of dynamin. Virology 267:17-28. [DOI] [PubMed] [Google Scholar]
- 29.Sanchez-San Martin, C., T. Lopez, C. F. Arias, and S. Lopez. 2004. Characterization of rotavirus cell entry. J. Virol. 78:2310-2318. [DOI] [PMC free article] [PubMed] [Google Scholar]
- 30.Schmid, S. L., M. A. McNiven, and P. De Camilli. 1998. Dynamin and its partners: a progress report. Curr. Opin. Cell Biol. 10:504-512. [DOI] [PubMed] [Google Scholar]
- 31.Sieczkarski, S. B., and G. R. Whittaker. 2002. Disecting virus entry via endocytosis. J. Gen. Virol. 83:1535-1545. [DOI] [PubMed] [Google Scholar]
- 32.Smart, E. J., G. A. Graf, M. A. McNiven, W. C. Sessa, J. A. Engelman, P. E. Scherer, T. Okamoto, and M. P. Lisanti. 1999. Caveolins, liquid-ordered domains, and signal transduction. Mol. Cell. Biol. 19:7289-7304. [DOI] [PMC free article] [PubMed] [Google Scholar]
- 33.Tagawa, A., A. Mezzacasa, A. Hayer, A. Longatti, L. Pelkmans, and A. Helenius. 2005. Assembly and trafficking of caveolae domains in the cell: caveolae as stable, cargo-triggered, vesicular transporters. J. Cell Biol. 170:769-779. [DOI] [PMC free article] [PubMed] [Google Scholar]
- 34.Teissier, E., and E. I. Pécheur. 2007. Lipids as modulators of membrane fusion mediated by viral fusion proteins. Eur. Biophys. J. 36:887-899. [DOI] [PMC free article] [PubMed] [Google Scholar]
- 35.Thomsen, T., K. Roepstorff, M. Stahlhut, and B. van Deurs. 2002. Caveolae are highly immobile plasma membrane microdomains, which are not involved in constitutive endocytic trafficking. Mol. Biol. Cell 13:238-250. [DOI] [PMC free article] [PubMed] [Google Scholar]
- 36.Trouet, D., D. Hermans, G. Droogmans, B. Nilius, and J. Eggermont. 2001. Inhibition of volume-regulated anion channels by dominant-negative Cav-1. Biochem. Biophys. Res. Commun. 284:461-465. [DOI] [PubMed] [Google Scholar]


