Abstract
An agar-plate assay was adapted to examine aspects of quinolone structure that restrict the emergence of quinolone-mediated quinolone resistance. When Escherichia coli was applied to agar containing nalidixic acid, the number of quinolone-resistant mutants arising during incubation was decreased by raising the drug concentration and by mutations expected to block the induction of the SOS response (recA, lexA); the mutant number was increased by a mutator mutation (ung). The examination of four related fluoroquinolones then revealed that a C-8 methoxy group and an N-ethyl piperazine substituent at C-7 reduced mutant acquisition more effectively than C-8 H and C-7 C-ethyl piperazine groups. The fluoroquinolone that was most effective at restricting mutant acquisition was the most active when lethal activity was measured on agar plates or in liquid medium (as minimal bactericidal concentration). It also exhibited the lowest ratio of mutant MIC to wild-type MIC when it was tested with a set of isogenic gyrase mutants, and it had a low mutant prevention concentration (MPC) relative to MIC. However, a low MPC was less likely to be important in restricting the induced mutant accumulation because a fluoroquinolone N-ethyl piperazine substituent was more effective than a C-ethyl piperazine substituent at reducing mutant accumulation but was less effective at lowering the MPC. An 8-methoxy-quinazoline-2,4-dione was also effective at restricting the accumulation of resistant mutants on agar. Collectively, these data characterize a simple assay for detection of drug-mediated resistance that is sensitive to the structures of GyrA inhibitors. The assay provides a new method for screening quinolones and quinolone-like molecules that complements MPC-based tests for restricting the emergence of resistance.
Members of the quinolone class of antibacterial agents are becoming increasingly popular as resistance to other compounds grows. Unfortunately, quinolone-containing therapies are also threatened by the emergence of bacterial resistance, which is likely to occur in two ways. One is through the spontaneous presence of resistant mutants prior to therapy, followed by enrichment and amplification of the mutants during therapy. The second is through the generation of resistant mutants during treatment via error-prone repair processes, such as those known to be part of the SOS response (17). In previous work we developed strategies for identifying compounds that would restrict the selective amplification of resistant mutant subpopulations present prior to therapy (6, 10). An approach for identifying agents that restrict the acquisition of resistant mutants generated (induced) by the compounds during drug exposure has not been reported.
Accumulation of quinolone-induced quinolone-resistant mutants can be observed by applying large numbers of bacteria to quinolone-containing agar and then scoring the number of colonies arising during incubation (2, 3). An important feature of this assay is that the generation of individual mutants is not obscured by mutant outgrowth. Spontaneous mutants present prior to drug exposure constitute a baseline that is estimated as the number of colonies scored after a 1-day incubation. Accumulation of resistant mutants, which with Escherichia coli is readily seen over the course of 2 weeks, is reduced by mutations in genes that block induction of the SOS response and is increased by mutator mutations (2, 3). In principle, this assay could be used to compare quinolone-like compounds for the ability to restrict the recovery of resistant mutants expected to be created by inhibitor treatment. To minimize differences in drug uptake and efflux, drug concentration can be normalized to MIC.
The present work began by using nalidixic acid to characterize the generation (induction) of resistant mutants during drug exposure. Examination of a set of closely related fluoroquinolones then showed that drug structure influences recovery of induced mutants. To extend the assay to a new type of GyrA inhibitor, we compared an 8-methoxy-quinazoline-2,4-dione with a cognate fluoroquinolone for the recovery of induced mutants: the 2,4-dione showed superior activity, as it had with preexisting mutants (10). These examples indicate that agar-plate mutant accumulation can be used to compare the propensities of compounds to generate new mutants during inhibitor exposure, thereby complementing mutant prevention concentration (MPC)-based measures that reflect the selective amplification of mutant subpopulations existing prior to treatment (6). These two measures together should provide an effective way to identify new antibacterial agents likely to restrict the emergence of resistance.
MATERIALS AND METHODS
Bacterial strains and culture conditions.
E. coli K-12 strains, listed in Table 1, were grown at 37°C in LB broth or on LB agar plates (16). Bacterial strains were constructed by bacteriophage P1-mediated transduction (22).
TABLE 1.
Bacterial strains
| Bacterial strain | Relevant genotype | Source or reference |
|---|---|---|
| BD2314 | ung-152::Tn10 | 7 |
| DM4100 | Wild type | 21 |
| KD66 | DM4100 gyrA (Nalr S83L) | 14 |
| KD79 | DM4100 recA56 srl::Tn10 | 8 |
| KD1397 | DM4100 tolC::Tn10gyrA+ | 10 |
| KD1437 | DM4100 lexA3 | 1 |
| KD1500 | DM4100 gyrB (Nalr K447E) | 14 |
| KD1502 | DM4100 gyrB (Nalr D426N) | 14 |
| KD1721 | DM4100 gyrA (Nalr A51V) | 14 |
| KD1909 | DM4100 gyrA (Nalr S83W) | 14 |
| KD1911 | DM4100 gyrA (Nalr A67S) | 14 |
| KD1913 | DM4100 gyrA (Nalr D87N) | 14 |
| KD1915 | DM4100 gyrA (Nalr G81C) | 14 |
| KD1917 | DM4100 gyrA (Nalr Q106H) | 14 |
| KD1973 | DM4100 gyrA (Nalr D82A) | 14 |
| KD1975 | DM4100 gyrA (Nalr A84P) | 14 |
| KD1977 | DM4100 gyrA (Nalr D87Y) | 14 |
| KD2928 | DM4100 ung152::Tn10 | This worka |
Strain KD2928 was created by P1 transduction from BD2314 into DM4100.
Antimicrobials.
Nalidixic acid was obtained from Sigma-Aldrich (St. Louis, MO); fluoroquinolones designated with PD numbers were provided by John Domagala, Pfizer Pharmaceutical Co. (Ann Arbor, MI) or were prepared as outlined previously (10). The 8-methoxy-quinazoline-2,4-dione UING5-207 and its cognate fluoroquinolone, UING5-249, were prepared as described previously (10). Ciprofloxacin was obtained from Bayer Healthcare (West Haven CT). Nalidixic acid and the quinolones were dissolved in 0.1 ml of 1 N NaOH (1/10 of the final volume), and then sterile water was added to obtain a final concentration of 10 mg/ml; the 2,4-dione, UING5-207, was dissolved in dimethyl sulfoxide. Dilutions were prepared with sterile distilled water, and the solutions were kept at −20°C for several weeks during testing.
Measurement of antimicrobial susceptibility.
The level of inhibition of growth (MIC) was measured by agar or broth dilution. Between 104 and 105 CFU was applied to a series of agar plates or broth cultures containing a test compound at various concentrations. The colonies were counted after incubation for 2 days or turbid growth was detected after 1 day. MIC99 was taken as the minimal concentration that blocked colony formation by 99%, determined from the interpolation of log-log plots.
Lethal activity was measured in two ways. With liquid cultures, aliquots of 5 × 10⁶ CFU/ml were incubated for 20 h in the presence of various concentrations of a quinolone or the 2,4-dione. The number of surviving cells was determined by dilution and plating on drug-free agar, followed by incubation overnight at 37°C. The concentration that lowered the rate of survival by 99.9% was taken as the minimal bactericidal concentration (MBC). Lethal activity on agar plates was measured by the recovery of viable cells from fluoroquinolone-containing agar. For these measurements, 104 to 108 CFU was applied to quinolone-containing agar plates (diameter, 100 mm) that were divided into quarters with a sterile knife. After incubation for various times, a quarter of the agar from each plate was excised and washed with 10 ml LB broth to remove the bacterial cells from the agar. The cells were concentrated by centrifugation (5,000 × g for 5 min), resuspended in 0.5 ml LB broth, diluted, applied to drug-free agar, and incubated at 37°C. Colonies were counted after 24 and 48 h; percent survival was determined relative to an untreated control for which the numbers of CFU were measured immediately before cells were applied to the quinolone-containing agar. Colony numbers were corrected for the presence of resistant mutants determined in parallel by colony formation on agar containing 0.02 μg/ml ciprofloxacin for compounds D, F, I, and K and either UING5-207 or UING5-249 at three times the MIC99 for UING5-207 and UING5-249, respectively.
Measurement of quinolone-resistant mutants arising during drug exposure.
The agar-plate method of Cirz et al. (2) was used with a slight modification. Briefly, concentrated solutions of the test compounds were added to molten agar. E. coli cells (104 to 1010) were applied to the agar, followed by incubation at 37°C. The cumulative number of colonies was determined at daily intervals.
Population analysis profiles.
Population analysis profiles were obtained as described previously (20, 24). Briefly, a series of agar plates in which the concentration of quinolone varied over a broad range were prepared. Wild-type E. coli (strain DM4100), grown to stationary phase in LB liquid medium, was applied to each plate in amounts that allowed a small number of colonies to form. These putative mutants were counted to obtain a preliminary score. They were then transferred to drug-free agar for a second round of growth, followed by transfer to agar containing drug at the same concentration initially used for selection. Strains that showed growth of separated, individual colonies on drug-containing plates after the transfer were scored as resistant mutants (almost all colonies scored positive by this test).
Nucleotide sequence analysis.
DNA was isolated from mutant cultures, and PCR was performed with primers that allow amplification of the gyrA quinolone resistance-determining region, as described previously (9). The nucleotide sequences of the amplicons were determined as described previously (9).
RESULTS
Agar-plate assay for detection of quinolone-resistant mutants arising during drug exposure.
When wild-type E. coli (strain DM4100) was applied to agar plates containing nalidixic acid, colonies appeared over the course of 2 weeks, with the rapid accumulation of mutants lasting for 6 to 10 days (Fig. 1A). Increases in the drug concentration decreased the number of colonies recovered (Fig. 1A). The initial rate for mutant induction was approximated by determining the number of colonies scored at 6 days minus the number of colonies scored at day 1, with the latter estimating the number of mutants present in the culture prior to drug treatment. The rate of mutant recovery decreased logarithmically as the nalidixic acid concentration increased (Fig. 1A, inset). Increases in the size of the bacterial inoculum increased the rate of recovery of mutants (Fig. 1B); when the number of mutants present at day 6 minus the number present at day 1 was expressed as a fraction of the number of input CFU, a moderate decrease was observed as the inoculum size increased (Fig. 1C).
FIG. 1.
Induction of quinolone-resistant mutants by nalidixic acid. (A) Effect of incubation time on the accumulation of mutants. Wild-type E. coli (strain DM4100; 2.5 × 10⁷ CFU) was applied to agar containing nalidixic acid at 5 μg/ml (filled circles; 1.5 times the MIC99), 6.6 μg/ml (open circles; 2 times the MIC99), 8.25 μg/ml (filled squares; 2.5 times the MIC99), and 9.9 μg/ml (open squares; 3 times the MIC99). At the indicated times, the numbers of colonies present on the agar plates were recorded. (Inset) Relationship between the rate of mutant recovery and the nalidixic acid (Nal) concentration. The rate of colony appearance was estimated as the number of colonies at day 6 minus the number at day 1 from the data in panel A. (B) Effect of inoculum size on the accumulation of resistant mutants. Strain DM4100 was applied to agar containing 8.25 μg/ml nalidixic acid at inocula of 2.5 × 10⁷ CFU (filled circles), 1.3 × 10⁷ CFU (open circles), 6.3 × 10⁶ CFU (filled squares), and 3.1 × 10⁶ CFU (open squares); the numbers of colonies appearing by the indicated times were recorded. (C) Effect of inoculum size on the fraction of input cells recovered in the presence of various concentrations of nalidixic acid. The symbols are as described for panel A. Error bars represent the standard deviations of the means; similar results were obtained in at least three replicate experiments.
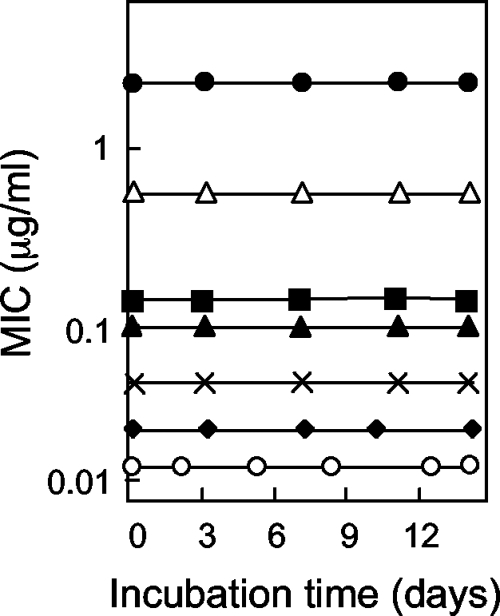
Several control experiments indicated that mutant colonies arose during nalidixic acid exposure rather than from mutants present prior to drug exposure. First, colonies appearing after 4 days regrew within a day when they were resuspended and applied as single cells to agar containing the same nalidixic acid concentration present in the selection plates (data not shown). Thus, it is unlikely that the colonies arising after incubation for several days were slowly growing mutants present prior to the application of the cells to the agar. Second, colonies recovered at day 6 regrew on agar containing nalidixic acid at the same concentration present in the selection plates (100 colonies were tested; data not shown). These data indicate that the colonies contained resistance mutations. Third, nalidixic acid was equally active in fresh plates and in plates preincubated for 14 days at 37°C (Fig. 2). These data show that the mutants appearing after a long incubation were not due to preexisting mutants that grew only after the potency of the drug had decayed.
FIG. 2.
Antimicrobial stability. Quinolone-class compounds were added to molten agar at various concentrations, plates were prepared, and the plates were preincubated at 37°C. At the indicated times, the drug-containing plates were used to determine the MIC99 by applying strain DM4100 (104 CFU), followed by an additional overnight incubation (strain KD1397 was used for the dione UING5-207). Symbols: filled circles, nalidixic acid; filled squares, compound D (PD161144); filled triangles, compound F (PD161148); filled diamonds, compound K (PD160788), multiplication signs, compound I (PD160793); open triangles, UING5-207; and open circles, UING5-249. Similar results were obtained in two replicate experiments.
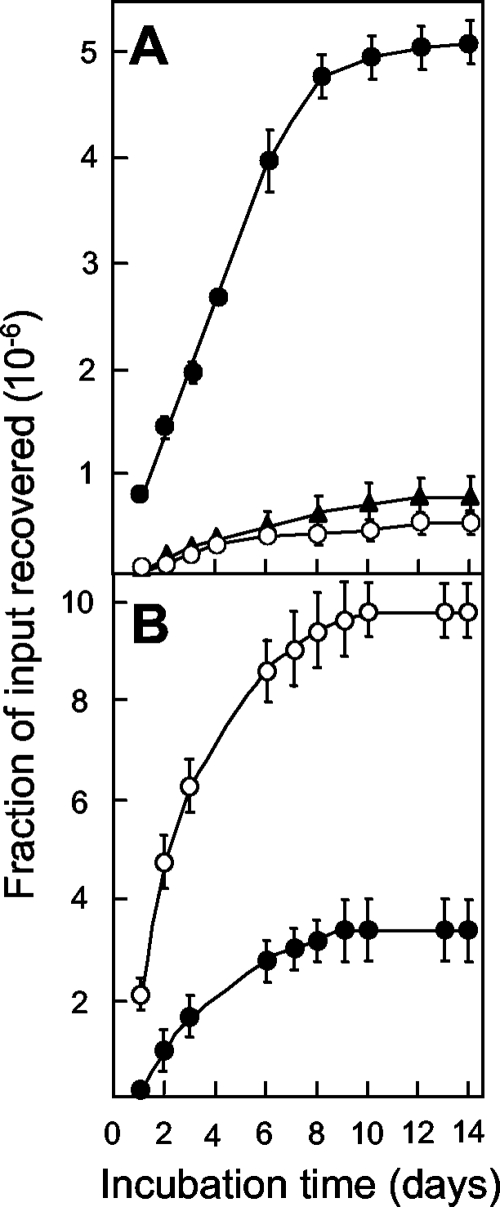
Some of the mutants that gradually accumulated on drug-containing agar were expected to result from induction of the SOS response (2). As a test, we applied cells containing a recA56 mutation (strain KD79) or a noninducible lexA3 mutation (strain KD1437) to agar containing various concentrations of nalidixic acid. Comparison of the results with those for the wild-type strain showed that fewer mutants were obtained with the mutant strains (Fig. 3A). Conversely, the number of colonies was greater when a mutS mutator mutant was examined (data not shown) (3). Since mutS is part of the SOS regulon (18), we also examined ung, a mutator gene that is not part of the SOS response (7). The ung152 mutation caused a higher frequency of preexisting mutants (scored at day 1) and increased the level of mutant accumulation during incubation (Fig. 3B, strain KD2928). Collectively, these data indicate that the agar-plate assay behaves as expected for a system in which quinolone-generated mutants can be recovered.
FIG. 3.
Effect of defects in DNA metabolism on the induction of quinolone-resistant mutants by nalidixic acid. (A) Genes controlling the SOS response. E. coli strains containing noninducible lexA3 (strain KD1437; 2.5 × 10⁷ CFU; filled triangles), inactive recA56 (strain KD79; 2.5 × 10⁷ CFU; open circles), or neither mutation (strain DM4100; 2.5 × 10⁷ CFU; filled circles) were applied to agar containing nalidixic acid at three times the MIC99. At the indicated times, the cumulative number of colonies was recorded and is expressed as a fraction of the number of input cells. (B) Effect of ung mutator. E. coli strains containing a deficiency of ung (strain KD2928; 1.2 × 10⁸ CFU; open circles) or the wild-type ung allele (strain DM4100; 1.1 × 10⁸ CFU filled circles) were applied to agar containing 6 μg/ml nalidixic acid (two times the MIC), and the colonies were counted at the indicated times. Replicate experiments with a variety of nalidixic acid concentrations (1.5 to 3 times the MIC99) gave similar results for both panels.
Effect of quinolone structure on recovery of resistant mutants.
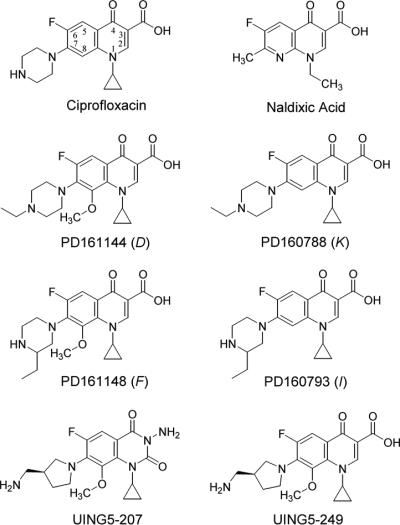
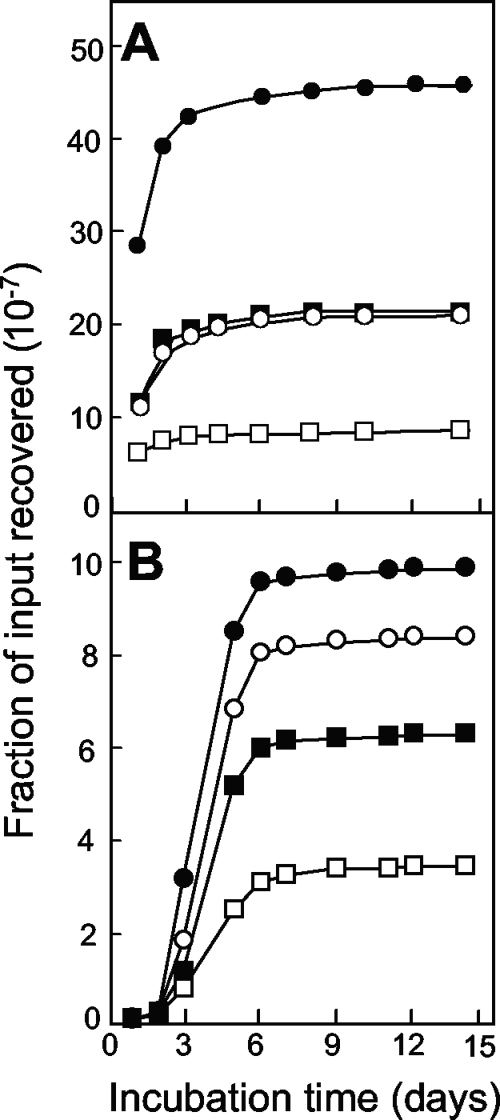
We examined four related fluoroquinolones for the ability to restrict mutant recovery (the compound names are abbreviated D, F, I, and K; and their structures are shown in Fig. 4). Two compounds, compounds D and F, had a methoxy group at position C-8; compounds K and I had a hydrogen atom at that position. The compounds also differed in the ring structure at C-7: compounds D and K had an N-ethyl piperazine, while compounds F and I had a C-ethyl piperazine. When the compounds were tested with the wild-type E. coli strain at a concentration twice the MIC, a hierarchy was observed in which the ability to restrict mutant induction was compound D > compound F = compound K > compound I (Fig. 5A). At a concentration of five times the MIC, compound F was more active than compound K (compound D > compound F > compound K > compound I; Fig. 5B). Similar results were obtained with various inoculum sizes (data not shown). When drug-containing agar plates were preincubated for up to 14 days and then used to determine the MIC as a measure of fluoroquinolone stability, no effect of preincubation was observed (Fig. 2). Thus, the results in Fig. 5 were not due to differences in drug stability. We also found for each compound that the colonies arising after several days of incubation were composed of cells that grew rapidly (data not shown) and that the colonies recovered were resistant to the test compound upon regrowth (data not shown). Moreover, analysis of the nucleotide sequence of the mutants obtained in the presence of each compound at five times the MIC revealed that gyrA mutants were selected (data not shown). Together these results indicate that both the C-8 methoxy substituent (compound D versus compound K, and compound F versus compound I) and the N-ethyl piperazine ring at C-7 (compound D versus compound F, and compound K versus compound I) increase the ability of fluoroquinolones to restrict the recovery of resistant mutants.
FIG. 4.
Structures of the compounds used in the study.
FIG. 5.
Effect of fluoroquinolone structure on the induction of quinolone-resistant mutants. Wild-type strain DM4100 was applied to agar plates containing compound D (open squares), compound F (filled squares), compound K (open circles), or compound I (filled circles) at concentrations two times the MIC99 (3.2 × 10⁷ CFU) (A) or five times the MIC99 (109 CFU) (B); the MIC99s are listed in Table 2. The numbers of colonies were determined at the indicated times. Similar results were obtained with several inoculum sizes (8 × 10⁶ to 1010 CFU) and in two replicate experiments.
Effect of fluoroquinolone structure on lethality.
Differences in lethal activity among the fluoroquinolones could contribute to differences in the recovery of mutants: if susceptible cells are killed before mutations are fixed, few mutants will be recovered. Previous work that measured cell death at high drug concentrations, after an hour of exposure, failed to reveal differences among the three compounds tested (compounds D, K, and F) (15). However, when lethal activity was measured over a longer time, as in the measurement of MBC, a difference among the four compounds was observed (Table 2). When MBC was normalized to MIC99 to correct for drug uptake and efflux, the rank order of lethality was compound D > compound F > compound K > compound I, the same as that for the restriction of mutant recovery (Fig. 5B).
TABLE 2.
Activities of fluoroquinolones and 2,4-dione
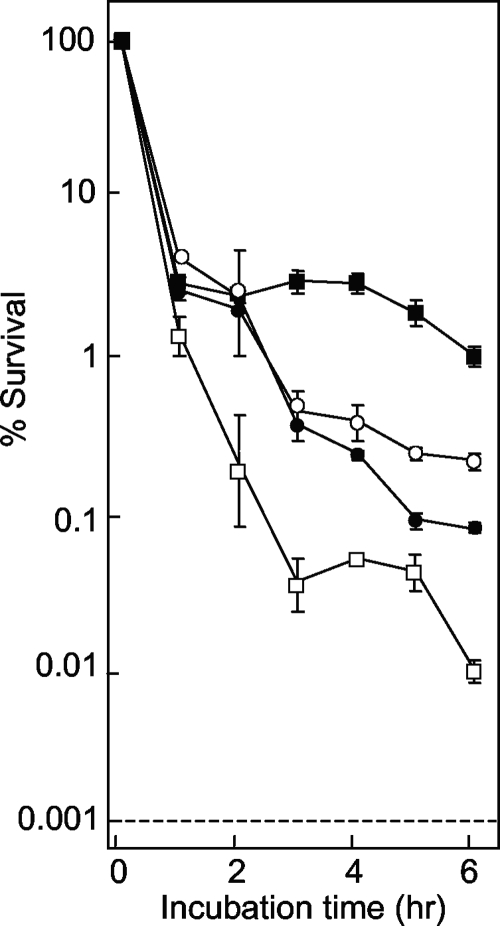
We also measured the lethal action on the surfaces of agar plates, since that is where mutants originate. Strain DM4100 was applied to quinolone-containing agar, and survival was measured at various times. Under these conditions, all fluoroquinolones rapidly killed the cells during the first hour on the agar surface (Fig. 6). With longer incubation times, compound D continued to kill cells, while the action of compound F slowed. Compounds I and K were intermediate in this second phase of lethality, with compound I being slightly more lethal. Thus, the rank order of lethality on the surface of agar was compound D > compound I > compound K > compound F, which differed from the rank order of mutant accumulation seen in Fig. 5. This difference in ranking suggests that factors other than lethality on the agar surface are involved in restricting mutant accumulation.
FIG. 6.
Effect of fluoroquinolone incubation time on survival of E. coli on agar plates. Wild-type E. coli (strain DM4100) was applied to agar plates containing compound D (open squares), F (filled squares), I (filled circles), or K (open circles) at a concentration three times the MIC. At the indicated times, samples were removed from the plates, diluted, and plated on drug-free agar to determine the number of viable cells. Similar results were obtained in two replicate experiments.
Effect of fluoroquinolone structure on antimutant activity.
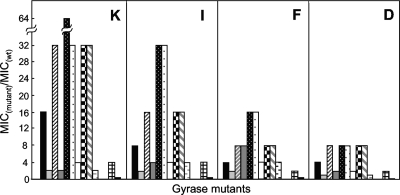
Another factor that may contribute to restricting of the recovery of mutants is the ability to limit mutant growth: compounds with a lower MIC for resistant mutants should allow fewer mutants to grow. The MICs for a battery of gyrase mutants were determined (10) and are expressed as a function of the MIC determined with wild-type cells. As shown in Fig. 7, compound D exhibited the lowest ratio of MIC with the mutant to MIC with the wild type for the mutant collection. The rank order for the four compounds with respect to their ability to block mutant growth, was compound D > compound F > compound I > compound K.
FIG. 7.
Bacteriostatic activity of fluoroquinolones with wild-type (wt) and quinolone-resistant gyrA mutants of E. coli. Isogenic strains of E. coli containing alleles of gyrA or gyrB were incubated overnight in LB broth containing the indicated fluoroquinolone to determine the MIC99. The ratio of the mutant to the wild-type MIC99 was determined for each mutant. The GyrA amino acid substitutions, arranged from left to right, were A51V, A67S, G81C, D82A, S83L, S83W, A84P, D87N, D87Y, and A106H; to the right are GyrB variants K447E and D426N (the strain numbers are listed in Table 1). The MICs of compounds D, K, F, and I for wild-type cells were 0.1, 0.02, 0.1, and 0.05 μg/ml, respectively. Similar results were obtained in a replicate experiment.
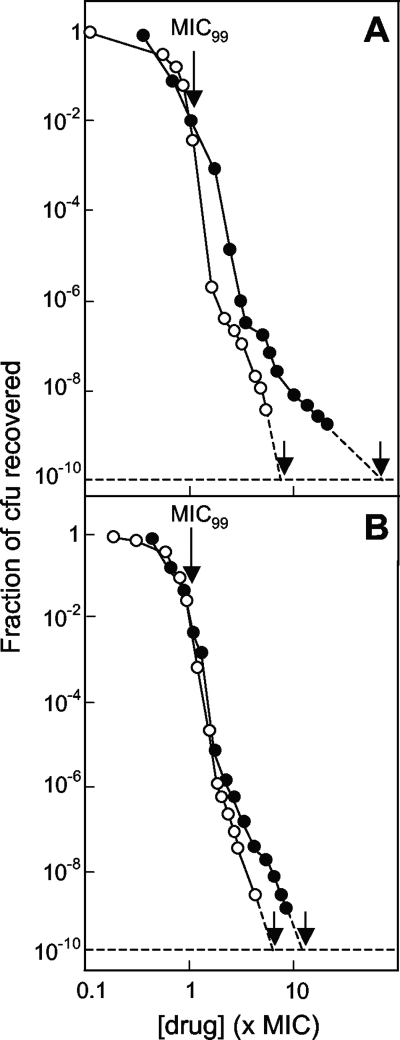
Since the gyrase mutations examined as described above may not represent all mutant types, we also carried out a population analysis in which wild-type cells were applied to quinolone-containing agar and the fraction that formed colonies was determined. As shown in Fig. 8, the rate of mutant recovery dropped sharply for all four fluoroquinolones. In this type of analysis, the drug concentration required to block colony formation when 1010 CFU was applied to the agar is defined as the MPC, which estimates the MIC of the least susceptible first-step mutant (5). Comparison of compounds D and K and of compounds F and I revealed that the C-8 methoxy group contributes to restricting the amplification of resistant mutant subpopulations (Fig. 8; Table 2). Comparison of the two 8-methoxy quinolones (compounds F and D) and the two 8-H quinolones (compounds I and K) indicated that the C-ethyl piperazinyl moiety increased the ability of the compounds to restrict mutant subpopulation growth (Fig. 8; Table 2). For the accumulation of induced mutants, the N-ethyl piperazinyl group was more restrictive.
FIG. 8.
Effect of fluoroquinolone structure on mutant subpopulations. E. coli strain DM4100 (gyr+) was applied to agar plates containing the indicated concentrations of fluoroquinolones expressed as a function of the MIC99 (Table 2). After incubation, the fraction of input CFU recovered as colonies that regrew on the plate with the selecting drug concentration was determined (the unlabeled arrows indicate the MPCs). (A) Compound D (open circles) and compound K (filled circles); (B) compound F (open circles) and compound I (filled circles). Similar results were obtained in a replicate experiment.
Comparison of 2,4-dione with fluoroquinolones for recovery of resistant mutants.
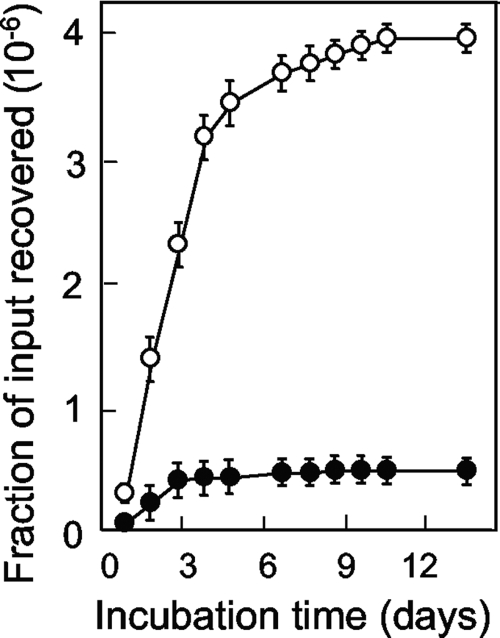
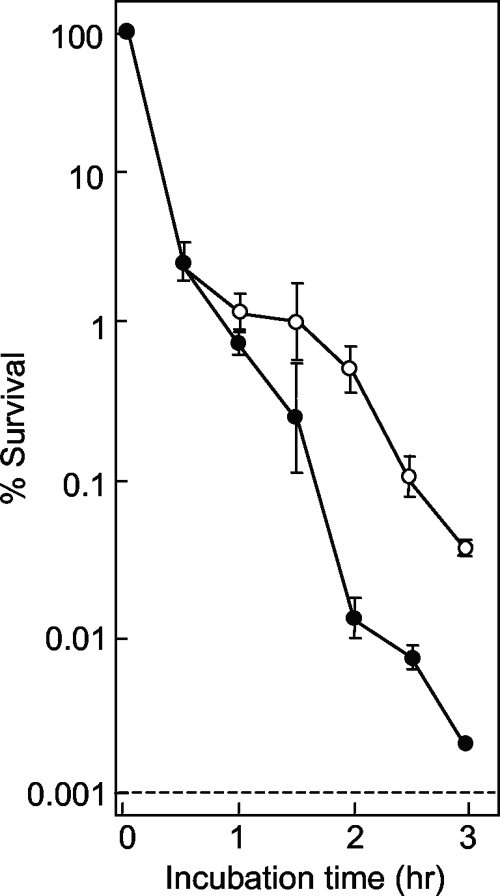
In previous work (10), we showed that the 8-methoxy-quinazoline-2,4-dione UING5-207 has exceptional activity against gyrA mutants that exist prior to drug treatment (for the compound structure, see Fig. 4). To assess the ability of the 2,4-dione to restrict the emergence of new mutants, we measured the accumulation of mutants on 2,4-dione-containing agar. The 2,4-dione allowed fewer resistant mutants to be recovered than its cognate fluoroquinolone, UING5-249 (Fig. 9). To determine whether the lethality caused by the 2,4-dione might contribute to the mutant-restricting activity seen in Fig. 9, we measured MBC/MIC. The dione was 25% more active than the cognate fluoroquinolone, UING5-249 (Table 2). The 2,4-dione was about 10-fold more active when lethality on the agar surface was measured (Fig. 10). We also tested the stability of 2,4-dione by placing the compound in agar for various times, followed by measurement of the E. coli MIC using preincubated plates. As shown in Fig. 2, the 2,4-dione and its cognate fluoroquinolone were stable for the duration of the experiment.
FIG. 9.
Induction of resistant mutants by 2,4-dione and its cognate fluoroquinolone. E. coli strain KD1397 (tolC::Tn10 gyr+; 3.1 × 10⁷ CFU) was applied to agar containing two times the MIC99 of the 2,4-dione UING5-207 (filled circles) or the fluoroquinolone UING5-249 (open circles). At the indicated times, the numbers of colonies appearing on the agar plate were recorded and are expressed as a fraction of the inoculum size. The MICs for the compounds are presented in Table 2; similar results were obtained in replicate experiments.
FIG. 10.
Effects of 2,4-dione and fluoroquinolone incubation time on the survival of E. coli on agar plates. An E. coli strain deficient in efflux (strain KD1397) was applied to agar plates containing UING5-249 (open circles) and the 2,4-dione UING5-207 (filled circles) at concentrations of three times their MIC99s. The broken line indicates the limit of detection. Similar results were obtained in two replicate experiments.
DISCUSSION
Fluoroquinolone resistance develops in two general ways: (i) by the creation and amplification of new mutants and (ii) by the dissemination of existing mutants to new hosts. New mutants arise spontaneously (independent of drug treatment), through the induction of mutagenic processes during treatment and through the transfer of resistance alleles from one bacterium to another, generally via plasmids (19). We recently presented a general strategy for screening novel quinolone-like compounds to find ones that restrict the amplification of preexisting mutants (10). The present work characterized an agar-plate assay that may be used to screen for compounds that restrict the recovery of new mutants generated during drug exposure. By this assay, the rate of mutant accumulation for nalidixic acid was 10 to 20 times the spontaneous background level; thus, induced mutants potentially play an important role in the emergence of resistance.
Mutant accumulation was sensitive to drug concentration (Fig. 1A), presumably because death of the susceptible population eliminated the source of new mutants (eradication of the susceptible population is not expected to eliminate resistance arising from preexisting mutants [12, 13]). Thus, keeping drug concentrations elevated during therapy is important to kill susceptible cells and, as previously argued, to restrict the growth of resistant mutant subpopulations (4, 6). As expected, the assay was also sensitive to inoculum size (Fig. 1B). However, inoculum size had only a modest effect when it was expressed as a fraction of the number of input cells (Fig. 1C); consequently, small variations in inoculum size are unlikely to affect the test results significantly. No correction for compound stability was required because all quinolone-class agents used in this work were stable in agar (Fig. 2). Prior work by Cirz et al. (2, 3) used this agar-plate assay to characterize mutations expected to interfere with or add to the induction of quinolone resistance. Since some of those mutations also restrict the emergence of resistance in an animal model of infection (2), the assay is likely to have clinical relevance.
Four related fluoroquinolones were compared to determine whether the agar-plate assay could distinguish among structurally similar compounds (Fig. 5). The most active compound, compound D, contained a C-8 methoxy group. Compound K, which was identical to compound D except that it lacked the C-8 methoxy moiety, allowed more mutants to be recovered. Likewise, another C-8 methoxy compound, compound F, was more active than its C-8 H derivative, compound I. Thus, the C-8 methoxy group contributes to restriction of the emergence of resistance during drug exposure, as was the case for the amplification of preexisting mutants (5, 23). C-7 ring structure also contributed to restricting the emergence of resistance. Compound D had an N-ethyl piperazine ring attached at C-7, while compound F, which was less active than compound D, contained a C-ethyl-substituted piperazine ring at C-7. These observations, which have yet to be explained by structural models, indicate that the agar-plate mutant accumulation assay detects significant differences in activity arising from small structural modifications.
Lethality was expected to be important for three aspects of mutant selection. First, lowering the susceptible population size diminishes the probability that a mutation will arise. Second, fluoroquinolone resistance is recessive when gyrase is the primary target (11); consequently, a time window exists between the formation of a resistance mutation and the replacement of enough sensitive GyrA protein to render the bacterial cell resistant. Highly lethal agents will kill mutant cells as long as sensitive gyrase is bound to the chromosome. Third, compounds that are lethal enough to kill resistant mutants will limit the recovery of induced mutants. Compound D was the most lethal and the most active at restricting the accumulation of mutants during drug exposure (Table 3). Indeed, the rank order for all four fluoroquinolones with respect to mutant accumulation was the same as that for the MBC/MIC99 (Table 3). However, the differences among the compounds were modest (Table 2), and when survival on agar plates was measured, the ranking differed from that seen for mutant accumulation (Table 3). Thus, one or more additional factors were probably involved in restricting induced resistance.
TABLE 3.
Relative activities of fluoroquinolones
| Assay result | Rank order of activitya |
|||
|---|---|---|---|---|
| D (8-OMe; 7-N Et) | F (8-OMe; 7-C Et) | K (8-H; 7-N Et) | I (8-H; 7-C Et) | |
| Restricts recovery of mutants on agar (Fig. 5) | 1 | 2 | 3 | 4 |
| Lethality in liquid (MBC; Table 2) | 1 | 2 | 3 | 4 |
| Lethality on agar surface (Fig. 6) | 1 | 4 | 3 | 2 |
| Restricts gyrase mutant growth (Fig. 7) | 1 | 2 | 4 | 3 |
| Restricts mutant subpopulation growth (Fig. 8) | 2 | 1 | 4 | 3 |
OME, methoxy; Et, ethyl.
The ability to block mutant growth is also expected to be important for restricting the recovery of new mutants. Compound D was the most active when it was tested with mutant cultures (Fig. 7). However, with large susceptible cultures that contained small subpopulations of resistant mutants, the MPC for compound D was higher than that for compound F (Table 2), which had a C-ethyl piperazine ring rather than an N-ethyl piperazine ring. The MPC for compound K was also higher than that for compound I (Table 2), which reinforced the conclusion that the MPC may not correlate well with the emergence of induced resistance during drug exposure on agar plates. These differences are not surprising, since the assays differed in the sizes of the bacterial populations that they tested. The MPC measurement used very large populations to detect the least-susceptible, single-step mutant subpopulation, while the induced mutant assay used smaller populations and focused on the dominant mutant type. Both assays are likely to be useful for evaluating new compounds.
The results of the agar-plate assay add to the earlier conclusion (10) that the 3-amino-8-methoxy-quinazoline-2,4-dione UING5-207 has an exceptional ability to restrict the emergence of resistance (Fig. 9). We were able to observe the emergence of mutants with fluoroquinolone UING5-249 resistance even with a lexA3 mutant, and under these conditions, the 2,4-dione still restricted the recovery of mutants (data not shown). Thus, the activity of the dione is not limited to resistant mutants induced via the SOS regulon. The next challenge is to find ways to lower the absolute MIC for compounds that have an exceptional ability to restrict the amplification of mutants created before or during drug treatment. In the present study, we normalized all compound concentrations to MIC to simplify the interpretation of the results. However, the MIC data in Table 2 show that with E. coli, a C-8 methoxy group increases the MIC, as does the change from the use of a fluoroquinolone to the use of the 2,4-dione. We are now modifying C-7 and other substituent groups to raise intracellular drug concentrations while retaining the ability to kill susceptible cells and restrict the emergence of resistant mutants.
The agar-plate mutant accumulation assay has two immediate applications. First, it can be used to screen novel gyrase inhibitors for their ability to restrict the emergence of resistance likely to occur during drug exposure, as was illustrated with the 2,4-dione. Second, clinical isolates can be tested for their propensity to acquire fluoroquinolone resistance, as illustrated by the high level of mutant accumulation seen with mutator strains (Fig. 3B). Such an assay could be used to determine whether multidrug-resistant isolates of Mycobacterium tuberculosis are more likely than pansusceptible isolates to acquire fluoroquinolone resistance during treatment.
Acknowledgments
We thank the following for critical comments on the work: Marila Gennaro, Richard Pine, Lynn Ripley, and Xilin Zhao.
The work was supported by NIH grant AI073491.
Footnotes
Published ahead of print on 5 October 2009.
REFERENCES
- 1.Chen, C.-R., M. Malik, M. Snyder, and K. Drlica. 1996. DNA gyrase and topoisomerase IV on the bacterial chromosome: quinolone-induced DNA cleavage. J. Mol. Biol. 258:627-637. [DOI] [PubMed] [Google Scholar]
- 2.Cirz, R., J. Chin, D. Andes, V. Crecy-Lagard, W. Craig, and F. E. Romesberg. 2005. Inhibition of mutation and combating the evolution of antibiotic resistance. PLoS Biol. 3:1024-1033. [DOI] [PMC free article] [PubMed] [Google Scholar]
- 3.Cirz, R., and F. Romesberg. 2006. Induction and inhibition of ciprofloxacin resistance-conferring mutations in hypermutator bacteria. Antimicrob. Agents Chemother. 50:220-225. [DOI] [PMC free article] [PubMed] [Google Scholar]
- 4.Cui, J., Y. Liu, R. Wang, W. Tong, K. Drlica, and X. Zhao. 2006. The mutant selection window demonstrated in rabbits infected with Staphylococcus aureus. J. Infect. Dis. 194:1601-1608. [DOI] [PubMed] [Google Scholar]
- 5.Dong, Y., X. Zhao, J. Domagala, and K. Drlica. 1999. Effect of fluoroquinolone concentration on selection of resistant mutants of Mycobacterium bovis BCG and Staphylococcus aureus. Antimicrob. Agents Chemother. 43:1756-1758. [DOI] [PMC free article] [PubMed] [Google Scholar]
- 6.Drlica, K., and X. Zhao. 2007. Mutant selection window hypothesis updated. Clin. Infect. Dis. 44:681-688. [DOI] [PubMed] [Google Scholar]
- 7.Duncan, B. K. 1985. Isolation of insertion, deletion, and nonsense mutations of the uracil-DNA glycosylase (ung) gene of Escherichia coli K-12. J. Bacteriol. 164:689-695. [DOI] [PMC free article] [PubMed] [Google Scholar]
- 8.Engle, E. C., S. H. Manes, and K. Drlica. 1982. Differential effects of antibiotics inhibiting gyrase. J. Bacteriol. 149:92-98. [DOI] [PMC free article] [PubMed] [Google Scholar]
- 9.Friedman, S. M., T. Lu, and K. Drlica. 2001. A mutation in the DNA gyrase A gene of Escherichia coli that expands the quinolone-resistance-determining region. Antimicrob. Agents Chemother. 45:2378-2380. [DOI] [PMC free article] [PubMed] [Google Scholar]
- 10.German, N., M. Malik, J. Rosen, K. Drlica, and R. Kerns. 2008. Use of gyrase resistance mutants to guide selection of 8-methoxy-quinazoline-2,4-diones. Antimicrob. Agents Chemother. 52:3915-3921. [DOI] [PMC free article] [PubMed] [Google Scholar]
- 11.Hane, M. W., and T. H. Wood. 1969. Escherichia coli K-12 mutants resistant to nalidixic acid: genetic mapping and dominance studies. J. Bacteriol. 99:238-241. [DOI] [PMC free article] [PubMed] [Google Scholar]
- 12.Lipsitch, M., and B. Levin. 1997. The population dynamics of antimicrobial chemotherapy. Antimicrob. Agents Chemother. 41:363-373. [DOI] [PMC free article] [PubMed] [Google Scholar]
- 13.Liu, Y., J. Cui, R. Wang, X. Wang, K. Drlica, and X. Zhao. 2005. Selection of rifampicin-resistant Staphylococcus aureus during tuberculosis therapy: concurrent bacterial eradication and acquisition of resistance. J. Antimicrob. Chemother. 56:1172-1175. [DOI] [PubMed] [Google Scholar]
- 14.Lu, T., X. Zhao, and K. Drlica. 1999. Gatifloxacin activity against quinolone-resistant gyrase: allele-specific enhancement of bacteriostatic and bactericidal activity by the C-8-methoxy group. Antimicrob. Agents Chemother. 43:2969-2974. [DOI] [PMC free article] [PubMed] [Google Scholar]
- 15.Malik, M., X. Zhao, and K. Drlica. 2006. Lethal fragmentation of bacterial chromosomes mediated by DNA gyrase and quinolones. Mol. Microbiol. 61:810-825. [DOI] [PubMed] [Google Scholar]
- 16.Miller, J. 1972. Experiments in molecular genetics. Cold Spring Harbor Laboratory Press, Cold Spring Harbor, NY.
- 17.Piddock, L. J., R. N. Walters, and J. M. Diver. 1990. Correlation of quinolone MIC and inhibition of DNA, RNA, and protein synthesis and induction of the SOS response in Escherichia coli. Antimicrob. Agents Chemother. 34:2331-2336. [DOI] [PMC free article] [PubMed] [Google Scholar]
- 18.Robbins-Manke, J., Z. Zdraveski, M. Marinus, and J. Essigmann. 2005. Analysis of global gene expression and double-strand-break formation in DNA adenine methyltransferase- and mismatch repair-deficient Escherichia coli. J. Bacteriol. 187:7027-7037. [DOI] [PMC free article] [PubMed] [Google Scholar]
- 19.Robicsek, A., G. Jacoby, and D. Hooper. 2006. The worldwide emergence of plasmid-mediated quinolone resistance. Lancet Infect. Dis. 6:629-640. [DOI] [PubMed] [Google Scholar]
- 20.Sieradzki, K., R. Roberts, S. Haber, and A. Tomasz. 1999. The development of vancomycin resistance in a patient with methicillin-resistant Staphylococcus aureus infection. N. Engl. J. Med. 340:517-523. [DOI] [PubMed] [Google Scholar]
- 21.Sternglanz, R., S. DiNardo, K. A. Voelkel, Y. Nishimura, Y. Hirota, A. K. Becherer, L. Zumstein, and J. C. Wang. 1981. Mutations in the gene coding for Escherichia coli DNA topoisomerase I affecting transcription and transposition. Proc. Natl. Acad. Sci. U. S. A. 78:2747-2751. [DOI] [PMC free article] [PubMed] [Google Scholar]
- 22.Wall, J. D., and P. D. Harriman. 1974. Phage P1 mutants with altered transducing abilities for Escherichia coli. Virology 59:532-544. [DOI] [PubMed] [Google Scholar]
- 23.Zhao, X., C. Xu, J. Domagala, and K. Drlica. 1997. DNA topoisomerase targets of the fluoroquinolones: a strategy for avoiding bacterial resistance. Proc. Natl. Acad. Sci. U. S. A. 94:13991-13996. [DOI] [PMC free article] [PubMed] [Google Scholar]
- 24.Zhou, J., Y. Dong, X. Zhao, S. Lee, A. Amin, S. Ramaswamy, J. Domagala, J. M. Musser, and K. Drlica. 2000. Selection of antibiotic resistant bacterial mutants: allelic diversity among fluoroquinolone-resistant mutations. J. Infect. Dis. 182:517-525. [DOI] [PubMed] [Google Scholar]


