

Abstract
Proteomic analysis typically has been performed using proteins digested with trypsin because of the excellent fragmentation patterns they produce in collision induced dissociation (CID). For analyses in which high protein coverage is desirable, such as global monitoring of post-translational modifications, additional sequences can be seen using parallel digestion with a second enzyme. We have benchmarked a relatively obscure basidomycete-derived zinc metalloendopeptidase, Lys-N, that selectively cleaves the amide bond N-terminal of lysine residues. We have found that Lys-N digestion yields peptides with easily assigned CID spectra. Using a mixture of purified proteins as well as a complex yeast lysate, we have shown that Lys-N efficiently digests all proteins at the predicted sites of cleavage. Shotgun proteomics analyses of Lys-N digests of both the standard mixture and yeast lysate yielded peptide and protein identification numbers that were generally comparable to trypsin digestion, whereas the combination data from Lys-N and trypsin digestion substantially enhanced protein coverage. During CID fragmentation, the additional amino terminal basicity enhanced b-ion intensity which was reflected in long b-ion tags that were particularly pronounced during CID in a quadrupole. Finally, immonium ion peaks produced from Lys-N digested peptides originate from the carboxy terminus in contrast to tryptic peptides where immonium ions originate from the amino terminus.
Keywords: Lys-N, Grifola frondosa, metalloendoprotease, immonium ion, sequence tags
Introduction
Mass spectrometry-based proteomics has achieved widespread use in molecular biology. Most CID based applications employ trypsin digestion due to its consistent cleavage on the C-terminal side of arginine and lysine.1 Tandem mass spectra of tryptic peptides using CID are typically dominated by cleavages along the amide backbone, resulting in the formation of a series of overlapping b- and y-type ions.2-5 It is this pathway that is used in the most commonly employed search algorithms.6,7 In fragmentation via CID, the cleavage of peptide bonds is typically governed by the mobility of a proton added during ionization, as explained by the mobile proton model.8,9 The cleaved fragments may transiently form a proton-bound dimer, competing to retain the charge.10 Amino acids with high proton affinities thus play a significant role in determining which ion series will dominate a MS/MS spectrum.
Trypsin digestion positions basic groups at both the amino and carboxy termini, and facilitates the formation of both the b- and y- type ion series. However, it is generally observed with tryptic peptides that the y-ion series produces quantitatively more informative fragments with greater intensity. It has also been observed using enzymes with specificity independent of arginine and lysine that the location of basic residues has a direct effect on the ratio of y-type fragmentation to b-type fragmentation.11,12 When the basic residue is located toward the C-terminus, CID tends to produce better y-ion coverage. Alternatively, when a basic residue is located near the N-terminus, compounded by the intrinsic basicity of the N-terminus, fragmentation produces more complete b-ion coverage. Enzymes with cleavage independent of the basic residues, such as chymotrypsin, will also distribute strongly basic residues within peptides. The result is that proton sequestration and fragmentation frequently do not produce a sufficient number of informative peaks to assign the sequence to a peptide. Hence, control of the location of basic residues through enzymatic digestion is critical to the success of a proteomic work flow.
We sought to explore the utility of a relatively obscure protease, Lys-N, for proteomic applications and to characterize the changes in peptide fragmentation patterns associated with increased amino terminus basicity. Lys-N is a zinc metalloendopeptidase that selectively cleaves the amide bond N-terminal of lysine residues. This enzyme, extracted from the fruiting body of basidomycete Grifola frondosa, has been sequenced, cloned, and crystallized.13-15 It is active in a pH range of 6.0 to 10.5, with an optimal pH reported as either 8.516 or 9.5.17 Lys-N is highly heat stable with 60% of activity retained after 3 h at 80 °C18 and a reported optimal activity at 65 °C using a synthetic substrate.16 It is also fully active in 4 M urea.18 A preliminary analysis of the activity of Lys-N found it to be exclusively active on the N-terminal side of lysine, except for lysine residues on the carboxy terminal side of aspartic acid.17
Lys-N has not been widely used in proteomics. A single study tested the compatibility of Lys-N with 18O labeling and identified 584 proteins in human retinal pigment epithelium cells.19 A more recent publication described its utility in creating informative ladders of c-type ions in samples analyzed by electron transfer dissociation (ETD).20 In this work, we demonstrate that Lys-N is quite useful for general proteomic applications due to its ability to completely digest proteins to peptides with reliable sequence specificity and CID properties that allow easy sequence assignment. Additionally, we demonstrate that Lys-N digestion can have substantial impact on peptide fragmentation patterns in a platform-specific manner.
Materials and Methods
All reagents were purchased from Sigma (St Louis, MO) unless otherwise noted. Lys-N was obtained from Seikagaku Biobusiness (Tokyo, Japan).
Preparation of a Standard Protein Digest
Fifteen proteins from a previously published mix of commercially available proteins21 were mixed in equimolar amounts (Table 1). One hundred micrograms of protein were dissolved in 500 μL of 50 mM ammonium bicarbonate. Proteins were reduced with 5 mM dithiothreitol (DTT) for 30 min at 50 °C and alkylated with 20 mM iodoacetamide for 60 min at room temperature. The alkylation reaction was then quenched with an additional 20 mM DTT. A buffer exchange was performed with Microcon 3 KDa centrifugal filter devices (Millipore Corporation, Bedford, MA) according to the manufacturer's protocol. Samples for trypsin digestion were brought up to 500 μL in 50 mM ammonium bicarbonate, pH 8.0 and 2 μg of trypsin (Promega, Madison, WI) was then added (1:50 w/w) to the sample and incubated at 37 °C overnight. Samples for Lys-N digestion were brought up to 500 μL in 100 mM ammonium bicarbonate, pH 9.5. One unit (defined by the manufacturer as the amount of enzyme that causes a change of 1.0 in absorbance at 366 nm for 30 min of incubation at 37 °C, pH 10 of 1% Azocasein) of Lys-N was added to the sample and incubated at 37 °C overnight. The conditions for Lys-N digestion were based on earlier published kinetic studies15,17 and the manufacturer's testing criteria. Complete digestion was verified using SDS-PAGE. All samples were dried in a low pressure centrifuge. The digests were purified with a mixed cation exchange (MCX) 1 cm3 cartridge (Waters Corp., Milton, MA) according to the manufacture's instructions. The eluate was dried by evaporative centrifugation for LC–MS.
Table 1.
Constituents of the Standard Mixture
| protein | organism | Swiss-Prot AC | MW (kD) | Sigma # | lysine resides |
|---|---|---|---|---|---|
| Alkaline phosphatase | E. coli | P00634 | 49.4 | 79377 | 30 |
| Alpha-amylase | B. licheniformis | P06278 | 58.5 | A4551 | 30 |
| Alpha-lactalbumin | Bovine | P00711 | 16.2 | L6010 | 12 |
| Beta-casein | Bovine | P02666 | 25.1 | C6905 | 12 |
| Beta-galactosidase | E. coli | P00722 | 116.5 | G5635 | 20 |
| Beta-lactoglobulin | Bovine | P02754 | 19.9 | L0130 | 16 |
| Carbonic anhydrase 2 | Bovine | P00921 | 29.1 | C2522 | 18 |
| Catalase | Bovine | P00432 | 59.9 | C40 | 28 |
| Cytochrome c | Bovine | P62894 | 11.7 | C2037 | 18 |
| Glycogen phosphorylase, muscle form | Rabbit | P00489 | 97.3 | P6635 | 48 |
| Myoglobin | Horse | P68082 | 17.1 | M0630 | 19 |
| Myosin light chain 1, skeletal muscle isoform | Rabbit | P02602 | 20.9 | M9891 | 20 |
| Ovalbumin | Chicken | P01012 | 42.9 | A2512 | 20 |
| Serotransferrin | Bovine | Q29443 | 77.8 | T0178 | 64 |
| Serum albumin | Bovine | P02769 | 69.3 | A3059 | 60 |
Complex Sample Preparation
Yeast experiments were performed using Saccharomyces cerevisiae (strain BY4741). S. cerevisiae cells were grown to OD600 as described in ref 21. In two separate analyses, cells were frozen in liquid nitrogen and disrupted with a Retsch PM100 mixer mill. The powder was suspended in 25 mM ammonium bicarbonate and cleared by centrifugation. From this preparation, 200 μg of protein was reduced and alkylated as described above and divided for buffer exchange, which was also performed as above. Samples for trypsin digestion were brought up to 500 μL in 50 mM ammonium bicarbonate, pH 8.0. Two micrograms of trypsin was added (1:50 w/w) and the sample was incubated overnight at 37 °C. Samples for Lys-N digestion were brought up to 500 μL in 100 mM ammonium bicarbonate, pH 9.5, and 1 unit of Lys-N was added to the sample followed by overnight incubation at 37 °C. Following digestion and evaporative centrifugation, yeast peptides were separated into 10 fractions using strong cation exchange as described in ref 22 using a polysulfethyl A 2.1 mm × 200 mm column (PolyLC, Columbia MD) and were desalted using C18 Ultramicrospin columns (The Nest Group, Southborough, MA). For the second analysis using separation on the Off-Gel Fractionator (Agilent, Santa Clara, CA), the mixture was dried by evaporative centrifugation and the sample was suspended in a solution of 1 mL of 1% acetonitrile, 0.1% formic acid in water. The sample was loaded to a C18 clean up column (Waters Corp., Milton, MA), washed with the loading buffer, and eluted in a solution of 45% acetonitrile, 0.1% formic acid. After drying, 100 μg of each sample was suspended in water and separated using the Off-Gel Fractionator per the manufacture's instructions using an IPG strip with pH range 3–10. Fractions were loaded onto C18 Ultramicrospin columns, washed with the loading buffer, and eluted in 45% acetonitrile, 0.1% formic acid. Eluted peptides were dried and resuspended in 25 μL 0.1% formic acid, 2% acetonitrile. For each mass spectrometric analysis, 4 μL was used.
Mass Spectrometry
Each sample was run on an automated mass spectrometry system equipped with an in-house micro-electrospray device.23 In each analysis, 0.1 μg of standard mix and 1.3 μg of each yeast fraction were automatically delivered by a FAMOS autosampler (LC Packings, San Francisco, CA) to an 100 μm internal diameter fused silica capillary precolumn packed with 2 cm of 200 Å pore-size Magic C18AQ resin (Michrom Bioresources, Auburn, CA). The samples were washed on the precolumn with solvent A (0.1% formic acid, 2% acetonitrile) and then eluted via a gradient of 10–35% solvent B (100% acetonitrile) over 60 min to a 75 μm × 10 cm fused silica capillary column packed with 100 Å pore-size Magic C18AQ resin (Michrom) at a constant column-tip flow rate of 200 nL/min using a HP 1100 solvent delivery system (Agilent, Palo Alto, CA). Mass spectrometry, including CID, was performed in an automated fashion using the information dependent acquisition option on a hybrid Q-TOF QSTAR Pulsar i (Applied Biosystems, Foster City, CA), as described in ref 24, a linear ion trap LTQ (ThermoFisher Corp., Waltham, MA), or an LTQ-Oribitrap (ThermoFisher), as described.20,24
Database Searching and Extraction
Spectra were searched using SEQUEST6 (version 27) without a specified enzyme constraint against a database consisting of either: (1) the proteins in the standard protein mix appended to a reversed human International Protein Index (IPI) database, or (2) a yeast subset of a nonredundant protein database acquired from the NCI's Advanced Biomedical Computing Center yeast database which was appended to a reversed version of the IPI human database (v.3.17). Identifications were filtered based on a PeptideProphet25 or ProteinProphet26 probability of 0.9. The PeptideProphet algorithm incorporated a decoy database strategy to improve the modeling as well as a model to group the data according to isoelectric point in experiments performed using the Off-Gel device. All data files in the mzXML format are available upon request. To study the effects of Lys-N digestion on fragmentation, we adapted a program written to analyze neutral losses22 that extracted b- and y -type ion intensity, as well as the number of matched and theoretical peaks for each ion type from every high confidence spectra.
Results and Discussion
Lys-N Digestion of a Standard Protein Mixture Yields Peptide Identifications Comparable to Trypsin
We compared the enzymatic activity of Lys-N to trypsin using a mix of fifteen commercially available proteins (Table 1).21 Proteins were reduced, alkylated with iodoacetamide, and buffer exchanged into buffer of optimal pH for each enzyme (pH 8.0 for trypsin and pH 9.5 for Lys-N) for digestion at 37 °C overnight. Analysis of the digests by SDS-PAGE showed that both enzymes digested all proteins. LC-MS analysis of equal quantities of both digests was performed using a linear ion trap (Thermo LTQ) and quadrupole TOF platform (ABI QSTAR pulsar i). Data were searched using SEQUEST without a specified enzyme constraint against a database consisting of the proteins in the mix appended to a reversed human IPI database. The number of unique peptides assigned to each of the proteins in the standard mixture from a single LC-MS run is shown in Table 2 for both the LTQ and the QSTAR.
Table 2.
Identifications Made in Analysis of the Standard Mixture Digested with Either Lys-N or Trypsin Using an LTQ and QSTAR Pulsar I
| LTQ unique peptides | QSTAR unique peptides | |
|---|---|---|
| Lys-N | 442 | 226 |
| Trypsin | 479 | 201 |
| Lys-N 3+ | 184(42%) | 79(34%) |
| Trypsin 3+ | 126(25%) | 29(14%) |
Digestion with both enzymes yielded similar numbers of unique peptide assignments although there was a trend for more identifications using trypsin in the LTQ. The protein coverage was quite similar between enzymes on both platforms. The Lys-N digestion produced more triply charged precursor ions on both instruments, consistent with the expectation that digestion only at lysine residues will generate peptides containing an internal arginine, as well as longer peptides more likely to include a basic residue. It was also clear that digestion with Lys-N peptides tended to produce intense and lengthy b-ion series, as expected with the amino terminal basicity. A typical example of such fragmentation is shown in Figure 1. Taken together, these experiments demonstrated that Lys-N was not grossly inferior to trypsin for producing peptides amenable to CID fragmentation on either instrument.
Figure 1.
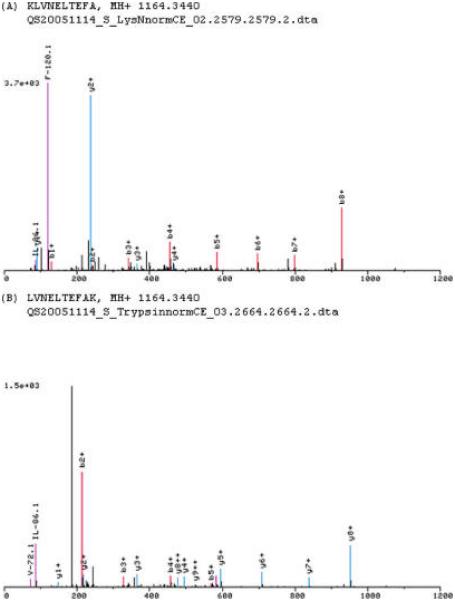
Two fragmentation spectra produced on a QSTAR Pulsar I from bovine serum albumin. The peptides produced by Lys-N digestion (A) and trypsin digestion (B) differ by a single amino acid. The two peptides produce reciprocal long y- and b-type ion series, respectively. The immonium ion peaks (pink) originate from the end of the peptide with the least basicity; the carboxy terminal end of the peptide in the case of the Lys-N peptide, and the amino terminal end in the case of the tryptic peptide.
Lys-N and Trypsin Produce Comparable Results in Analyses of Complex Mixtures
Parallel digestion of a total yeast lysate with both Lys-N and trypsin was performed on two separate occasions with separate batches of Lys-N and analyzed using either a QSTAR or an LTQ-Orbitrap. Both analyses yielded similar numbers of unique peptide and protein identifications. In these experiments, 100 μg of yeast extract was reduced and alkylated with iodoacetamide. The sample was divided and exchanged to the proper buffer for digestion with either Lys-N or trypsin. Complete digestion was confirmed by SDS-PAGE for both samples. In the first analysis, both digests were separated by strong cation exchange and all fractions were analyzed on a QSTAR pulsar i. The data were searched using SEQUEST against a yeast database to which the reversed human IPI database had been appended. Lys-N data were searched without enzyme specificity and analyzed using the TransProteomic Pipeline.23 Proteins with a ProteinProphet probability of at least 0.9 (corresponding to a false discovery rate of approximately 1%) were retained for this comparison. Data for these analyses are presented in Table 3. These results indicate that like the preliminary data on the test mixture, and similar to results reported by Taouatas,20 both the peptide and protein identification numbers are quite comparable after digestion with either enzyme.
Table 3.
Identifications Made in Analysis of a Yeast Lysate Digested with Either Lys-N or Trypsin Using an LTQ-Orbitrap and QSTAR Pulsar I
| instrument | enzyme | unique peptides |
FDR | proteins with prob >0.9 |
proteins with 2 or more unique peptides |
|---|---|---|---|---|---|
| QSTAR | Lys-N | 1747 | 0.010 | 364 | 277 |
| Trypsin | 1733 | 0.007 | 385 | 258 | |
| Combined | 3467 | 0.006 | 444 | 382 | |
| LTQ-Orbitrap | Lys-N | 4653 | 0.006 | 1141 | 700 |
| Trypsin | 6119 | 0.005 | 1404 | 902 | |
| Combined | 10696 | 0.006 | 1645 | 1161 |
A second analysis was performed one year later on an LTQ-Orbitrap using a different lot of Lys-N and separation by pI on an Off-Gel isoelectric focusing device.24,25 Data were analyzed using the same decoy database strategy and a ProteinProphet model that incorporates the agreement of the peptide pI with the pI fraction into the probability calculation. This analysis was confounded because one of the twelve Lys-N pI fractions was inadvertently lost during sample clean up prior to LC–MS. Nonetheless, despite the handicap of the Lys-N analysis, the numbers of identifications are still quite comparable with the parallel trypsin digestion (Table 3). It is likely that the inclusion of the fraction lost in the analysis would have decreased the differences between the analyses.
Combination of Lys-N and Trypsin Data Increases Protein Number and Protein Coverage
We next determined the increment in protein identifications and protein coverage when the mass spectrometry data from trypsin and Lys-N digests of the same yeast extract were combined. Such an approach has been shown to increase protein coverage and might be used when maximal protein coverage is desirable such as during monitoring of post translational modifications.26-28 As would be expected, the absolute number of proteins identified increases, but only modestly, when the data from the Lys-N digest are added to the data from the digestion with trypsin. (Table 3) This is not surprising given that the limit of protein identifications from a sample of this sort is determined by the inherent dynamic range of the instrument compared to that of the sample. As both trypsin and Lys-N digests have the same constituents and thus the same dynamic range, a high level of overlap is to be expected.
In contrast to the small increment in proteins identified, a substantial improvement in protein coverage is achieved when the Lys-N digest data were added to the trypsin digest data. For the analysis of yeast performed on the QSTAR described above, 240 proteins were retained for which at least four unique peptides were identified in the combined analysis and at least one peptide found in the trypsin digest. For these proteins, the ratio of protein coverage obtained in the combined analysis verses the analysis performed using trypsin alone was calculated. In this group, it was found that the addition of the peptides identified in the Lys-N analysis to those in the trypsin analysis resulted in a 1.76 fold increase in the protein coverage. For the analysis the LTQ-Orbitrap using a second set of samples described above, the addition of the peptides identified in the Lys-N analysis to those observed in the trypsin analysis resulted in a similar 1.70 fold increase in the protein coverage for the 755 proteins with at least 4 identified peptides in the combined analysis and at least on tryptic peptide. Such an increment in coverage is consistent with prior reports demonstrating increased protein and peptide identifications using multiple enzymes.26-28 Thus, when maximal protein coverage is desired in an analysis (e.g., characterizing the phospho-proteome), Lys-N appears to be a good enzyme choice for parallel analysis.
Lys-N Cleavage Site Specificity
Because earlier reports indicated that Lys-N was not able to cleave lysines with aspartic acid residues on the amino terminal side of the amide backbone, we analyzed a large set of high confidence yeast data to identify any trends regarding surrounding residues. The LTQ-Orbitrap data from the Lys-N digest of yeast described above were filtered to retain 4480 peptides with a PeptideProphet probability of at least 0.9 representing a false discovery rate of 0.3%. Within this select set of spectral assignments, 78% of all peptides had an amino terminal lysine residue and 80% had a lysine on the carboxy terminal side of the amide bond on the carboxy terminus. Of the peptides identified in this analysis, 61% had the expected cleavage sites at both termini, 36% percent had the expected cleavage at only one terminus, and 3% percent had the expected cleavage at neither terminus. This analysis also showed that peptides with cleavage at amide bonds not bounded on the carboxy side by a lysine were likely to be bound instead by one of three residues, alanine, serine, or arginine (Table 4). Together, these residues were present at the carboxy terminal side of roughly 70% of the nonspecific cleavage sites, and were seen at frequencies far above those expected within the yeast database as a whole. For all peptides having these nonspecific cleavages, we found that approximately 25% were subsumed by another peptide in the analysis, indicating that the origin of the majority of these missed Lys-N cleavages was not in-source decay.
Table 4.
Residue at the P1′ Position at the Both Peptide Termini
| P1′ amino |
P1′ carboxy |
|||||
|---|---|---|---|---|---|---|
| amino acid |
total | percent | percent excluding K |
total | percent | percent excluding K |
| A | 209 | 4.67 | 21.24 | 229 | 5.11 | 25.82 |
| C | 3 | 0.07 | 0.30 | 0 | 0.00 | 0.00 |
| D | 5 | 0.11 | 0.51 | 6 | 0.13 | 0.68 |
| E | 11 | 0.25 | 1.12 | 2 | 0.04 | 0.23 |
| F | 23 | 0.51 | 2.34 | 7 | 0.16 | 0.79 |
| G | 38 | 0.85 | 3.86 | 43 | 0.96 | 4.85 |
| H | 7 | 0.16 | 0.71 | 5 | 0.11 | 0.56 |
| I | 18 | 0.40 | 1.83 | 6 | 0.13 | 0.68 |
| K | 3496 | 78.04 | 3593 | 80.20 | ||
| L | 24 | 0.54 | 2.44 | 14 | 0.31 | 1.58 |
| M | 10 | 0.22 | 1.02 | 13 | 0.29 | 1.47 |
| N | 25 | 0.56 | 2.54 | 18 | 0.40 | 2.03 |
| P | 6 | 0.13 | 0.61 | 33 | 0.74 | 3.72 |
| Q | 7 | 0.16 | 0.71 | 4 | 0.09 | 0.45 |
| R | 183 | 4.08 | 18.60 | 155 | 3.46 | 17.47 |
| S | 263 | 5.87 | 26.73 | 289 | 6.45 | 32.58 |
| T | 5 | 0.11 | 0.51 | 22 | 0.49 | 2.48 |
| V | 19 | 0.42 | 1.93 | 32 | 0.71 | 3.61 |
| W | 2 | 0.04 | 0.20 | 1 | 0.02 | 0.11 |
| Y | 10 | 0.22 | 1.02 | 8 | 0.18 | 0.90 |
The cause of this amino acid distribution favoring alanine, serine, or arginine is not apparent from the available data. It is possible that a contaminant peptidase was present in the purified commercial Lys-N, that Lys-N has some low level nonspecific activity, or that the lysis procedure liberated peptidases in yeast that were responsible for this cleavage pattern. However, the latter situation would have resulted in a similar preponderance of alanine and serine residues present in the nonspecifically cleaved trypsin peptides, and this was not observed (data not shown). In addition, this same pattern of over representation of alanine, serine, and arginine was seen in digestions performed a year earlier of both the complex yeast sample and the standard protein mixture, though the over-representation favored arginine over alanine and serine. This suggests that this activity is intrinsic to the purified Lys-N and may be due to the enzyme itself or a contaminant. Regardless of the source, the knowledge of the common nonspecific cleavage sites could be used in peptide scoring algorithms if analysis shows that more recent lots of Lys-N continue to exhibit this behavior.
It was also questioned whether these findings supported prior work indicating that Lys-N cleavage can be impaired by the presence of specific amino acids in the region of the lysine. Specifically, prior reports indicated that proteolysis is impaired when an aspartic acid residue is present on the amino terminal side of lysine.17 Using the LTQ-Orbitrap data, the frequency of each residue at each of the positions surrounding the amide bond where a lysine was at the expected P1′ position was determined. The labeling of the surrounding residues follows standard nomenclature: P3–P2–P1//P1′–P2′–P3′ with the double slash indicating the amide bond cleaved by the enzyme. The data include positions P1 through P3′ for peptides with an amino terminal lysine and positions P3 through P1′ for peptides having a lysine at the expected P1′ position on the carboxy terminal amide bond (Table 5). Because none of the residues (including aspartic acid) were seen at frequencies dramatically different than those in the database, these data indicate that there is no major impediment to cleavage at the P1 position or any other position surrounding the lysed amide bond.
Table 5.
Residues Surrounding Both Peptide Termini: Amino Terminal Bond Above, Carboxy Terminal Bond Below
| P1 amino |
P2′ amino |
P3′ amino |
||||||||
|---|---|---|---|---|---|---|---|---|---|---|
| amino acid | total | percent | ratio vs database | total | percent | ratio vs database | total | percent | ratio vs database | database frequency |
| A | 388 | 8.66 | 1.58 | 369.00 | 8.24 | 1.50 | 453 | 10.11 | 1.85 | 5.48 |
| C | 41 | 0.92 | 0.65 | 30.00 | 0.67 | 0.48 | 39 | 0.87 | 0.62 | 1.4 |
| D | 168 | 3.75 | 0.65 | 182.00 | 4.06 | 0.71 | 195 | 4.35 | 0.76 | 5.732 |
| E | 310 | 6.92 | 1.08 | 270.00 | 6.03 | 0.94 | 227 | 5.07 | 0.79 | 6.435 |
| F | 286 | 6.38 | 1.42 | 180.00 | 4.02 | 0.89 | 211 | 4.71 | 1.05 | 4.492 |
| G | 293 | 6.54 | 1.31 | 219.00 | 4.89 | 0.98 | 314 | 7.01 | 1.40 | 4.995 |
| H | 95 | 2.12 | 0.98 | 129.00 | 2.88 | 1.33 | 113 | 2.52 | 1.16 | 2.17 |
| I | 143 | 3.19 | 0.49 | 391.00 | 8.73 | 1.33 | 384 | 8.57 | 1.31 | 6.54 |
| K | 271 | 6.05 | 0.84 | 110.00 | 2.46 | 0.34 | 39 | 0.87 | 0.12 | 7.239 |
| L | 439 | 9.80 | 1.03 | 544.00 | 12.14 | 1.27 | 533 | 11.90 | 1.24 | 9.558 |
| M | 100 | 2.23 | 1.06 | 58.00 | 1.29 | 0.62 | 68 | 1.52 | 0.72 | 2.097 |
| N | 241 | 5.38 | 0.88 | 196.00 | 4.38 | 0.72 | 165 | 3.68 | 0.61 | 6.081 |
| P | 185 | 4.13 | 0.94 | 176.00 | 3.93 | 0.90 | 219 | 4.89 | 1.11 | 4.388 |
| Q | 184 | 4.11 | 1.04 | 220.00 | 4.91 | 1.25 | 170 | 3.79 | 0.97 | 3.932 |
| R | 230 | 5.13 | 1.15 | 112.00 | 2.50 | 0.56 | 93 | 2.08 | 0.46 | 4.469 |
| S | 361 | 8.06 | 0.89 | 293.00 | 6.54 | 0.72 | 275 | 6.14 | 0.68 | 9.088 |
| T | 260 | 5.80 | 0.98 | 343.00 | 7.66 | 1.30 | 272 | 6.07 | 1.03 | 5.907 |
| V | 202 | 4.51 | 0.81 | 408.00 | 9.11 | 1.63 | 511 | 11.41 | 2.04 | 5.58 |
| W | 44 | 0.98 | 0.95 | 37.00 | 0.83 | 0.79 | 35 | 0.78 | 0.75 | 1.039 |
| Y | 204 | 4.55 | 1.35 | 213.00 | 4.75 | 1.41 | 164 | 3.66 | 1.08 | 3.379 |
| P3 carboxy |
P2 carboxy |
P1 carboxy |
||||||||
| amino acid | total | percent | ratio vs database | total | percent | ratio vs database | total | percent | ratio vs database | database frequency |
| A | 425 | 9.49 | 1.73 | 418 | 9.33 | 1.70 | 424 | 9.46 | 1.73 | 5.48 |
| C | 34 | 0.76 | 0.54 | 71 | 1.58 | 1.13 | 50 | 1.12 | 0.80 | 1.4 |
| D | 208 | 4.64 | 0.81 | 192 | 4.29 | 0.75 | 226 | 5.04 | 0.88 | 5.732 |
| E | 459 | 10.25 | 1.59 | 278 | 6.21 | 0.96 | 411 | 9.17 | 1.43 | 6.435 |
| F | 161 | 3.59 | 0.80 | 277 | 6.18 | 1.38 | 288 | 6.43 | 1.43 | 4.492 |
| G | 300 | 6.70 | 1.34 | 277 | 6.18 | 1.24 | 281 | 6.27 | 1.26 | 4.995 |
| H | 153 | 3.42 | 1.57 | 164 | 3.66 | 1.69 | 163 | 3.64 | 1.68 | 2.17 |
| I | 251 | 5.60 | 0.86 | 192 | 4.29 | 0.66 | 141 | 3.15 | 0.48 | 6.54 |
| K | 76 | 1.70 | 0.23 | 103 | 2.30 | 0.32 | 187 | 4.17 | 0.58 | 7.239 |
| L | 339 | 7.57 | 0.79 | 485 | 10.83 | 1.13 | 402 | 8.97 | 0.94 | 9.558 |
| M | 49 | 1.09 | 0.52 | 76 | 1.70 | 0.81 | 81 | 1.81 | 0.86 | 2.097 |
| N | 174 | 3.88 | 0.64 | 241 | 5.38 | 0.88 | 274 | 6.12 | 1.01 | 6.081 |
| P | 333 | 7.43 | 1.69 | 127 | 2.83 | 0.65 | 143 | 3.19 | 0.73 | 4.388 |
| Q | 210 | 4.69 | 1.19 | 233 | 5.20 | 1.32 | 200 | 4.46 | 1.14 | 3.932 |
| R | 179 | 4.00 | 0.89 | 176 | 3.93 | 0.88 | 206 | 4.60 | 1.03 | 4.469 |
| S | 323 | 7.21 | 0.79 | 364 | 8.13 | 0.89 | 317 | 7.08 | 0.78 | 9.088 |
| T | 310 | 6.92 | 1.17 | 278 | 6.21 | 1.05 | 203 | 4.53 | 0.77 | 5.907 |
| V | 349 | 7.79 | 1.40 | 298 | 6.65 | 1.19 | 208 | 4.64 | 0.83 | 5.58 |
| W | 36 | 0.80 | 0.77 | 39 | 0.87 | 0.84 | 45 | 1.00 | 0.97 | 1.039 |
| Y | 111 | 2.48 | 0.73 | 191 | 4.26 | 1.26 | 230 | 5.13 | 1.52 | 3.379 |
In a parallel analysis, 640 peptides containing an internal lysine in any position except the amino or carboxy terminal were analyzed to identify if particular residues surrounding the lysine were associated with missed cleavage (Supplemental Table 1, Supporting Information). These data revealed that the presence of proline on the carboxy terminal side of lysine (P2′) was associated with approximately 20% of all missed cleavages, a rate far above the database frequency for this residue (4.3%). However, it was shown earlier that proline was frequently observed in the P2′ position of bonds cleaved by Lys-N (Table 5). Taken together, these data suggest that proline residues in the P2′ position provide a barrier to cleavage that may be context specific and surmountable by Lys-N. It was also noted that the presence of a lysine on the amino terminal side of another lysine was associated with a failure to cleave. This condition was observed 92 times, all but one of which was associated with the sequence Lys–Lys present at the amino terminal of the peptide. Note again that lysine is frequently seen at the P1 position of successfully cleaved amide bonds (Table 5). These findings indicate that this sequence is not a strong inhibitor of Lys-N cleavage; it is possible that structural constraints could limit the ability of Lys-N to cleave a single lysine from the amino terminal of a peptide with an amino terminal lysine-lysine sequence. These results are consistent with an earlier of 18O incorporation where incorporation at the Pro–Lys and Lys–Lys bonds was associated with errors in quantification that were presumed to be due to slower cleavage rates.19 Isoleucine, valine, or aspartic acid on the amino terminal side of lysine are associated with failure of enzymatic cleavage, accounting for 16, 20, and 13% of cleavage failures, respectively (after the removal of sequences beginning with lysine–lysine). These residues were seen to be moderately under-represented in the P1 position, consistent with these findings. Taken together, these data on enzyme specificity indicate that Lys-N is an efficient enzyme with predictable specificity and is inhibited only to a small extent by certain surrounding residues.
Lys-N Digestion Enhances b-Type Ion Signal
We next sought to quantify the differences in the distributions of ions generated by CID on both an ion trap and Q-TOF platform. Ion specific data were extracted for high confidence doubly charged peptides from yeast digested with either Lys-N or trypsin analyzed using both QSTAR and LTQ mass spectrometers. For each high confidence spectral assignment (PeptideProphet score > 0.9), we calculated the ratio of the total ion currents matched to b- and y-type ions (b/y ratio), and the fraction of theoretical peaks matched to b- and y-type ions. Only Lys-N peptides with an amino terminal lysine and fully tryptic peptides were used in this analysis. These data, shown in histogram format in Figure 2A and 2B, demonstrate that the added amino terminal basicity of Lys-N digestion shifts the b/y ratio toward b-type ions compared to trypsin on both platforms: on the LTQ, the two populations are quite distinct; on the QSTAR, the populations are distinct but there is more overlap. In both cases the populations are statistically distinct (p < 0.0001). The mean b/y ratio for Lys-N digestion is 2.2 and 1.4 for the LTQ and QSTAR mass spectrometers, respectively. This is in contrast to trypsin digestion where the ratios are 0.51 and 0.65 respectively. Similar trends were seen for doubly and triply charged peptides in a biological replicate analyzed on an LTQ-Orbitrap (Figure 2C and D). These observations are in agreement with prior reports using subgroups of peptides produced by proteinase-K digestion12 and one earlier report of the use of Lys-N with 18O labeling.19.
Figure 2.
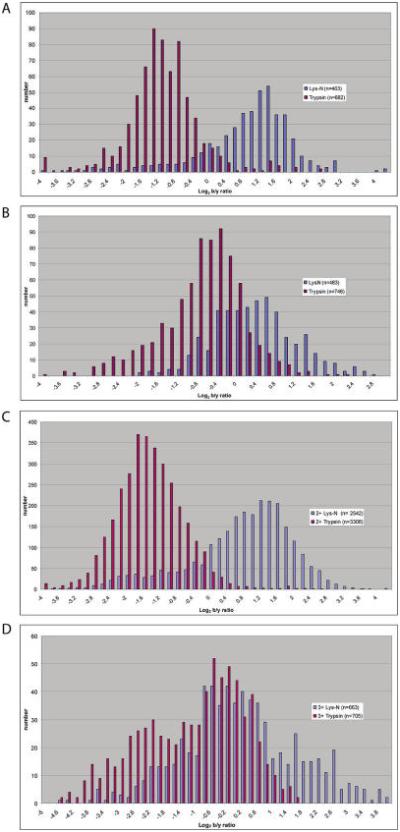
Distribution of b/y ratios with Lys-N and trypsin digestion is shown for analyses on an LTQ (A) and QSTAR (B) platform. In a biological replicate, a second sample of yeast was digested in parallel with Lys-N and trypsin and analyzed on an LTQ-Orbitrap. The distribution of b/y ratios is shown for doubly (C) and triply (D) charged peptides.
The dramatic differences in relative ion series strength had an instrument-dependent effect on the number of measured peaks matched to theoretical peaks during database searching (Figure 3). In analysis using a QSTAR, where CID takes place in a quadrupole, Lys-N digestion is associated with a dramatic increase in the number of b-type ions that are matched to theoretical peaks along with a corresponding drop in the number of y-type ions peaks matched. Surprisingly, the shift in matched ions is present but far less pronounced when these samples are analyzed on an LTQ, where CID takes place via resonance excitation. These data indicate that for high confidence spectra on an ion trap, despite the fact that one ion series is of substantially lower intensity than another, the lower intensity ion series is able to produce signal sufficient for assignment to a theoretical peak. In contrast, for data recorded on a TOF instrument, the loss of intensity from the unfavored series resulted in the inability to match theoretical peaks.
Figure 3.
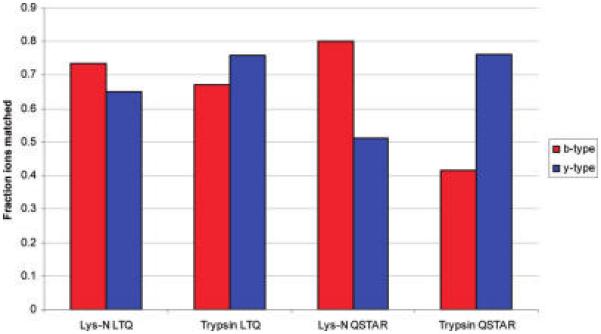
Fraction of theoretical fragments ions that are matched to a peak in the recorded spectra for b- and y- type ions intensity for high confidence spectra recorded on either an LTQ ion trap or QSTAR Pulsar i Q-TOF. For the LTQ, high confidence assignments are associated with a high proportion of matched ions of both b- and y-types with only subtle bias seen with Lys-N compared to trypsin. Analysis using a QSTAR is associated with a much stronger bias toward one ion type depending on the enzyme used.
During collision-induced dissociation, the proton affinities of the peptide's side chains determine the most stable locations for the available protons.11,29 It is well-known that b-ion signals from MS/MS spectra of tryptic peptides are typically weak when CID is performed in a quadrupole. It has been postulated that this behavior results from facile bx → bx−1 fragmentation that reduces the higher m/z peaks and increases the lower m/z peaks while y-type ions are stabilized through proton sequestration by the carboxy terminal basic residue side chains.3,30 Lys-N digestion alters this balance by producing peptides with added amino terminal basicity. With proton sequestration taking place at the amino terminus, the b-type ions are less labile and less secondary fragmentation occurs. In contrast, y-type ions are less likely to have a basic residue to sequester a proton and are thus more likely to undergo secondary fragmentation.
Lys-N Digestion Yields Immonium Ion Peaks Derived from the Carboxy Terminal as well as b-Type Ion Sequence Tags
Immonium ion formation is a commonly observed phenomenon on Q-TOF platforms. The immonium ions seen from peptides generated by tryptic digest are generally biased to particular residues (phenylalanine, proline, histidine, tyrosine, valine, and isoleucine/leucine) with an intensity that is proportionate to the residue's proximity to the amino terminus.31 It was observed that, unlike tryptic digestion, the digestion with Lys-N produced intense immonium ions with an intensity that was proportionate to the distance from the uncharged carboxy-terminus. An example of this phenomenon is shown in Figure 1 where the carboxy-proximal phenylalanine has give rise to an immonium ion which serves as a base peak for the spectrum. The observation was confirmed for all the residues mentioned above through manual evaluation of high confidence spectra from the analysis of yeast. The correlation of immonium ions with the presence of the expected amino acid is quite useful in confirming a sequence assignment; knowledge of the fact that the residue generating the peak should generally be seen near the carboxy terminus will be quite important for those using a TOF platform to analyze a Lys-N digest.
A second phenomenon that is apparent with digestion using Lys-N is that spectra resulting from sequences with minimal carboxy terminal basicity frequently produce strings of large b-type ion sequence tags that could have utility in sequence assignment. This is also shown in Figure 1 where a sequence tag of b4 through b8 is easily seen. Such b-type strings are almost never seen in peptides produced with trypsin digest. This phenomenon is similar to the informative ladders of c-type ions that result from Lys-N digestion in samples analyzed by electron transfer dissociation (ETD).20 These strings could have utility for spectral matching software 32-34 that makes use of a sequence tag to improve sequence assignments.
Conclusions
Lys-N is an efficient commercially available peptidase with properties that should make it useful in proteomic studies. It is currently derived from purification from the fruiting body of basidomycete Grifola frondosa. Ultimately a recombinant form could be obtained for more widespread use. We have shown that this enzyme is efficient and comparable to trypsin digestion, which is in agreement with two other less comprehensive studies discussed earlier.19,20 We have expanded upon this work by demonstrating that parallel digestion using Lys-N and trypsin substantially enhances protein coverage and that Lys-N digestion generally follows the predicted sites of cleavage, with few missed cleavages. We also have demonstrated that, additional basicity at the amino termini enhances the b-ion series and yields long b-ion ladders that could have utility in database search algorithms. In conclusion, because of the favorable qualities described above, Lys-N has substantial potential for broad use in proteomic studies, especially those in which expanded protein coverage is desirable.
Supplementary Material
Acknowledgment
This work was supported by grant P50GM076547 (to D.B.M.) and contract N01–HV-28179 from the National Heart, Lung, and Blood Institute.
Footnotes
Supporting Information Available: Supplemental Table 1. This material is available free of charge via the Internet at http://pubs.acs.org.
References
- 1.Aebersold R, Mann M. Mass spectrometry-based proteomics. Nature. 2003;422(6928):198–207. doi: 10.1038/nature01511. [DOI] [PubMed] [Google Scholar]
- 2.Hunt DF, Yates JR, 3rd., Shabanowitz J, Winston S, Hauer CR. Protein sequencing by tandem mass spectrometry. Proc. Natl. Acad. Sci. U.S.A. 1986;83(17):6233–7. doi: 10.1073/pnas.83.17.6233. [DOI] [PMC free article] [PubMed] [Google Scholar]
- 3.Paizs B, Suhai S. Fragmentation pathways of protonated peptides. Mass Spectrom. Rev. 2004 doi: 10.1002/mas.20024. [DOI] [PubMed] [Google Scholar]
- 4.Roepstorff P, Fohlman J. Proposal for a common nomenclature for sequence ions in mass spectra of peptides. Biomed. Mass Spectrom. 1984;11(11):601. doi: 10.1002/bms.1200111109. [DOI] [PubMed] [Google Scholar]
- 5.Biemann K. Appendix 5. Nomenclature for peptide fragment ions (positive ions) Methods Enzymol. 1990;193:886–7. doi: 10.1016/0076-6879(90)93460-3. [DOI] [PubMed] [Google Scholar]
- 6.Eng J, McCormack A, Yates JR., III An approach to correlate tamdem mass spectral data of peptides with amino acid sequences in a protein database. J. Am. Soc. Mass Spectrom. 1994;(5):976–989. doi: 10.1016/1044-0305(94)80016-2. [DOI] [PubMed] [Google Scholar]
- 7.Perkins DN, Pappin DJ, Creasy DM, Cottrell JS. Probability-based protein identification by searching sequence databases using mass spectrometry data. Electrophoresis. 1999;20(18):3551–67. doi: 10.1002/(SICI)1522-2683(19991201)20:18<3551::AID-ELPS3551>3.0.CO;2-2. [DOI] [PubMed] [Google Scholar]
- 8.Dongre AR, Jones JL, Somogyi A, Wysocki VH. Influence of Peptide Composition, Gas-Phase Basicity, and Chemical Modification on Fragmentation Efficiency: Evidence for the Mobile Proton Model. J. Am. Chem. Soc. 1996;118(35):8365–8374. [Google Scholar]
- 9.Tang XJ, Boyd RK. An investigation of fragmentation mechanisms of doubly protonated tryptic peptides. Rapid Commun. Mass Spectrom. 1992;6(11):651–7. doi: 10.1002/rcm.1290061105. [DOI] [PubMed] [Google Scholar]
- 10.Paizs B, Suhai S. Towards understanding some ion intensity relationships for the tandem mass spectra of protonated peptides. Rapid Commun. Mass Spectrom. 2002;16(17):1699–702. doi: 10.1002/rcm.747. [DOI] [PubMed] [Google Scholar]
- 11.Wysocki VH, Tsaprailis G, Smith LL, Breci LA. Mobile and localized protons: a framework for understanding peptide dissociation. J. Mass Spectrom. 2000;35(12):1399–406. doi: 10.1002/1096-9888(200012)35:12<1399::AID-JMS86>3.0.CO;2-R. [DOI] [PubMed] [Google Scholar]
- 12.Tabb DL, Huang Y, Wysocki VH, Yates JR., 3rd Influence of basic residue content on fragment ion peak intensities in low-energy collision-induced dissociation spectra of peptides. Anal. Chem. 2004;76(5):1243–8. doi: 10.1021/ac0351163. [DOI] [PMC free article] [PubMed] [Google Scholar]
- 13.Saito T, Dohmae N, Tsujimoto M, Takio K. PCR cloning and heterologous expression of cDNA encoding a peptidyl-Lys metalloendopeptidase precursor of Grifola frondosa. J. Gen. Appl. Microbiol. 2002;48(5):287–92. doi: 10.2323/jgam.48.287. [DOI] [PubMed] [Google Scholar]
- 14.Hori T, Kumasaka T, Yamamoto M, Nonaka N, Tanaka N, Hashimoto Y, Ueki U, Takio K. Structure of a new ‘aspzincin’ metalloendopeptidase from Grifola frondosa: implications for the catalytic mechanism and substrate specificity based on several different crystal forms. Acta Crystallogr. D: Biol. Crystallogr. 2001;57(Pt 3):361–8. doi: 10.1107/s0907444900019740. [DOI] [PubMed] [Google Scholar]
- 15.Nonaka T, Dohmae N, Hashimoto Y, Takio K. Amino acid sequences of metalloendopeptidases specific for acyl-lysine bonds from Grifola frondosa and Pleurotus ostreatus fruiting bodies. J. Biol. Chem. 1997;272(48):30032–9. doi: 10.1074/jbc.272.48.30032. [DOI] [PubMed] [Google Scholar]
- 16.Nishiwaki T, Hayashi K. Purification and characterization of an aminopeptidase from the edible basidiomycete Grifola frondosa. Biosci. Biotechnol. Biochem. 2001;65(2):424–7. doi: 10.1271/bbb.65.424. [DOI] [PubMed] [Google Scholar]
- 17.Nonaka T, Hashimoto Y, Takio K. Kinetic characterization of lysine-specific metalloendopeptidases from Grifola frondosa and Pleurotus ostreatus fruiting bodies. J. Biochem. 1998;124(1):157–62. doi: 10.1093/oxfordjournals.jbchem.a022074. [DOI] [PubMed] [Google Scholar]
- 18.Barrett AJ, Rawlings NK, Woessner JF. Handbook of Proteolytic Enzymes. Vol. 1. Elsevier Academic Press; London: 2004. [Google Scholar]
- 19.Rao KC, Palamalai V, Dunlevy JR, Miyagi M. Peptidyl-Lys metalloendopeptidase-catalyzed 18O labeling for comparative proteomics: application to cytokine/lipolysaccharide-treated human retinal pigment epithelium cell line. Mol. Cell. Proteomics. 2005;4(10):1550–7. doi: 10.1074/mcp.M500150-MCP200. [DOI] [PubMed] [Google Scholar]
- 20.Taouatas N, Drugan MM, Heck AJ, Mohammed S. Straight-forward ladder sequencing of peptides using a Lys-N metalloendopeptidase. Nat. Methods. 2008;5(5):405–7. doi: 10.1038/nmeth.1204. [DOI] [PubMed] [Google Scholar]
- 21.Klimek J, Eddes JS, Hohmann L, Jackson J, Peterson A, Letarte S, Gafken PR, Katz JE, Mallick P, Lee H, Schmidt A, Ossola R, Eng JK, Aebersold R, Martin DB. The standard protein mix database: a diverse data set to assist in the production of improved Peptide and protein identification software tools. J. Proteome Res. 2008;7(1):96–103. doi: 10.1021/pr070244j. [DOI] [PMC free article] [PubMed] [Google Scholar]
- 22.Martin DB, Eng JK, Nesvizhskii AI, Gemmill A, Aebersold R. Investigation of neutral loss during collision-induced dissociation of peptide ions. Anal. Chem. 2005;77(15):4870–82. doi: 10.1021/ac050701k. [DOI] [PMC free article] [PubMed] [Google Scholar]
- 23.Keller A, Eng J, Zhang N, Li XJ, Aebersold R. A uniform proteomics MS/MS analysis platform utilizing open XML file formats. Mol. Syst. Biol. 2005;1:2005–0017. doi: 10.1038/msb4100024. [DOI] [PMC free article] [PubMed] [Google Scholar]
- 24.Horth P, Miller CA, Preckel T, Wenz C. Efficient fractionation and improved protein identification by peptide OFFGEL electrophoresis. Mol. Cell. Proteomics. 2006;5(10):1968–74. doi: 10.1074/mcp.T600037-MCP200. [DOI] [PubMed] [Google Scholar]
- 25.Lam HT, Josserand J, Lion N, Girault HH. Modeling the isoelectric focusing of peptides in an OFFGEL multicompartment cell. J. Proteome Res. 2007;6(5):1666–76. doi: 10.1021/pr0606023. [DOI] [PubMed] [Google Scholar]
- 26.Choudhary G, Wu SL, Shieh P, Hancock WS. Multiple enzymatic digestion for enhanced sequence coverage of proteins in complex proteomic mixtures using capillary LC with ion trap MS/MS. J. Proteome Res. 2003;2(1):59–67. doi: 10.1021/pr025557n. [DOI] [PubMed] [Google Scholar]
- 27.Gatlin CL, Eng JK, Cross ST, Detter JC, Yates JR., 3rd Automated identification of amino acid sequence variations in proteins by HPLC/microspray tandem mass spectrometry. Anal. Chem. 2000;72(4):757–63. doi: 10.1021/ac991025n. [DOI] [PubMed] [Google Scholar]
- 28.Wa C, Cerny R, Hage DS. Obtaining high sequence coverage in matrix-assisted laser desorption time-of-flight mass spectrometry for studies of protein modification: analysis of human serum albumin as a model. Anal. Biochem. 2006;349(2):229–41. doi: 10.1016/j.ab.2005.11.015. [DOI] [PubMed] [Google Scholar]
- 29.Polce MJ, Ren D, Wesdemiotis C. Dissociation of the peptide bond in protonated peptides. J. Mass Spectrom. 2000;35(12):1391–8. doi: 10.1002/1096-9888(200012)35:12<1391::AID-JMS85>3.0.CO;2-1. [DOI] [PubMed] [Google Scholar]
- 30.Vachet RW, Ray KL, Glish GL. Origin of product ions in the MS/MS spectra of peptides in a quadrupole ion trap. J. Am. Soc. Mass Spectrom. 1998;9(4):341–4. doi: 10.1016/S1044-0305(98)00008-7. [DOI] [PubMed] [Google Scholar]
- 31.Hohmann LJ, Eng JK, Gemmill A, Klimek J, Vitek O, Reid GE, Martin DB. Quantification of the Compositional Information Provided by Immonium Ions on a Quadrupole-Time-of-Flight Mass Spectrometer. Anal. Chem. 2008 doi: 10.1021/ac8006076. [DOI] [PMC free article] [PubMed] [Google Scholar]
- 32.Mann M, Wilm M. Error-tolerant identification of peptides in sequence databases by peptide sequence tags. Anal. Chem. 1994;66(24):4390–9. doi: 10.1021/ac00096a002. [DOI] [PubMed] [Google Scholar]
- 33.Tabb DL, Saraf A, Yates JR., 3rd GutenTag: high-throughput sequence tagging via an empirically derived fragmentation model. Anal. Chem. 2003;75(23):6415–21. doi: 10.1021/ac0347462. [DOI] [PMC free article] [PubMed] [Google Scholar]
- 34.Tabb DL, Ma ZQ, Martin DB, Ham AJ, Chambers MC. DirecTag: Accurate Sequence Tags from Peptide MS/MS through Statistical Scoring. J. Proteome Res. 2008;7(9):3838–46. doi: 10.1021/pr800154p. [DOI] [PMC free article] [PubMed] [Google Scholar]
Associated Data
This section collects any data citations, data availability statements, or supplementary materials included in this article.