Abstract
Purpose
To investigate the utility of consistency metrics, such as inverse consistency, in contour based deformable registration error analysis.
Methods
Four images were acquired of the same phantom that has experienced varying levels of deformation. The deformations were simulated with deformable image registration. Using calculated deformation maps the inconsistencies within the algorithm were investigated. This can be done for example by calculating deformation maps both in forward and reverse directions and applying them subsequently to an image. If the algorithm is not inverse-consistent then this final image will not be the same as the original, as it should be. Other consistency tests were done for example by comparing different algorithms or by applying the deformation maps to a circular set of multiple deformations whereby the original and final images are in fact the same. The resulting composite deformation map in this case contains a combination of the errors within in those maps, because if error-free the resulting deformation map should be zero everywhere. We have termed this the generalized inverse consistency error map (Σ⃗(x⃗)).
Results and Conclusions
The correlation between the consistency metrics and registration error varied considerably depending on the registration algorithm and type of consistency metric. There was also a trend for the actual registration error to be larger than the consistency metrics. A disadvantage of these techniques is that good performance in these consistency checks is a necessary but not sufficient condition for an accurate deformation method.
Keywords: Deformable registration, quality assurance, adaptive radiotherapy, 4D planning
Introduction
Deformable image registration has received a lot of attention recently for applications in radiotherapy treatment planning. Specific applications include auto-segmentation (Isambert et al., 2008) 4-D planning (Rietzel et al., 2005; Ehler and Tome, 2008), and adaptive planning or dose accumulation (Yan et al., 1997; Yan, 2008; Kessler, 2006; Lu et al., 2006). In the case of auto-segmentation, the only thing that matters is that the deformation is accurate for the contours of interest; inaccuracies elsewhere are irrelevant since they will not influence the contours. Additionally, since contours generated automatically can easily be compared to physician contours, end-to-end testing is relatively straightforward.
The full 3D accuracy of deformable registration is important however when considering dose-volume histograms in treatment planning, and end-to-end testing becomes difficult. In terms of the accuracy of dose distributions determined using deformable registration, distinctions can be drawn between relatively homogeneously irradiated target volumes, and inhomogeneously irradiated target volumes or organs at risk. As for a target, as long as one delivers a uniform dose to the entire target volume, small inaccuracies in deformation within the target volume do not matter since all voxels are supposed to receive the same dose. Note, however that with IMRT, sequential highly inhomogeneous doses are delivered over a sequence of time points in order to sum to a homogeneous dose. Thus, in 4D IMRT planning the deformation within the target needs to be accurate even if there is a uniform dose prescription. The situation in general is complicated further as soon as one ascribes biological properties to voxels within the target volume, as is the case in selective boosting or risk adaptive radiotherapy. This is because the dose a sub-region is to receive now depends on its biological properties in terms of possible tumor recurrence or the harboring of high-risk disease (Tome and Fowler, 2000; Kim and Tome, 2006).
The accuracy of deformable image registration is of importance for the development of 4D or adaptive radiotherapy techniques that deliver differential doses to different parts of the target volume and/or organs at risk, including IMRT where differential doses are supposed to sum to a uniform dose. Yan recently described a clinical QA workflow for adaptive radiotherapy and points to the need for quality assurance of deformable image registration (Yan, 2008).
The current algorithms used for dose deformation are based on physical models but few if any have the ability to accurately simulate the insurmountable mechanical complexity of the human body, with some recent reports representing significant progress towards more realistic biomechanical models (Zhong et al., 2007). There are many quality assurance techniques available today for deformable image registration. Some authors have used landmark points within regions of interest (ROI), e.g. in the lung or in a phantom, and this represents a reasonable attempt at quality assurance (Brock et al., 2005; Kaus et al., 2007; Lu et al., 2004). However, landmark points are often sparse in real patients, and assessment of accuracy on a case-by-case basis will be time consuming. Another popular method of evaluating the deformation is to inspect difference images (Lu et al., 2004). This can be informative in regions where there is sufficient contrast but for low contrast regions, which are prevalent in real patient images, using a difference image will fail to identify inaccuracies. Using cross correlation between images (e.g. (Castadot et al., 2008)) suffers the same problem in regions of low contrast. To make matters worse, some algorithms are likely to perform best in regions where nearby organs have sufficient contrast to be seen, and therefore a bias can easily be introduced; one evaluates the algorithms at locations where it should be the easiest for the algorithm to get the deformation correct. Others have attempted to mitigate such effects when using landmark points as a quality assurance tool by digitally subtracting the landmarks before deformation (Kashani et al., 2007).
The concept of inverse consistency is not a new one (Christensen and Johnson, 2001; Leow et al., 2005; Yang et al., 2008), and it can be understood as follows. Two images, which we’ll call image A and image B, are registered using deformable registration in two different ways: Image A is deformed to match image B, and separately image B is deformed to match image A. A perfect algorithm would arrive at deformation maps that were equivalent (more specifically, inverses) for both of these deformation tasks. Many real algorithms however do not. This may be surprising but feeding the algorithm two problems that are really inverses of each other will not result in two deformation maps that are inverses. The degree to which an algorithm can or can not successfully arrive at equivalent deformation maps given a problem and its inverse can be quantified with what we will refer to as an inverse consistency error map.
The inverse consistency error map can be thought of as follows. If one deforms image A to match image B, then uses the deformation algorithm to deform that deformed image back to image A again as described above, the result will be an image that actually does not match the original image A if the algorithm is not inverse consistent. Because this image is not successfully restored to its original state, a deformation map can be derived which maps the original image A to it’s unsuccessfully restored state, and we call it the inverse consistency error map. Note that in a recent study, Yang et al. have described a new algorithm designed to be inherently inverse consistent (Yang et al., 2008). In our work here we will concentrate however on the contour based deformation available in the Pinnacle3 treatment planning system (Philips Medical Systems, Fitchburg, WI), which is not inherently inverse consistent. Specifically, we will employ the elastic body splines (EBS) and thin plate splines (TPS) algorithms, discussed below.
Additional consistency checks can be done in a case for example where one has no a priori reason to believe that one of two possible algorithms will be better than the other. In our case we suppose for the sake of illustrating the method that we have equal confidence in both the TPS and EBS methods. Since these two methods give different results, their discrepancy is of some value if we are interested in what the uncertainties are. One could argue from the beginning that the EBS algorithm may be more appropriate for elastic materials. However, although the physical model behind the EBS algorithm may make more intuitive sense for our phantom (described below), it can only approximate the deformation of an elastic body. This is because there is no unique solution to the physical problem without assumptions about the nature of the forces that produce the deformations, and these assumptions may or may not be appropriate. In this report we will illustrate the method and present results of quantitatively comparing the TPS and EBS deformation methods.
Finally we will introduce an extension to the inverse consistency concept involving three separate images (A, B, and C) and their associated deformation vector fields that connect them. This gives rise to what we call the generalized inverse consistency error (gICE), written as Σ⃗(x⃗).
Materials and Methods
To test the utility of the consistency checks (inverse consistency, inter-algorithm consistency, and the generalized inverse consistency error Σ⃗(x⃗)), a gelatin phantom with a volume of approximately 5 L was constructed and 140 glass beads of 8 mm diameter were suspended in it at regular intervals. This was accomplished by suspending the glass beads on a thread before the gelatin was poured, and removing the thread after it had solidified. Additionally a wooden dowel approximately 2.9 cm in diameter was suspended in the phantom to act as a mobile but rigid mechanical constraint. Upon completion this phantom was compressed with a hard plastic ball and axial CT scans were performed after varying levels of compression had been applied in 0.5 cm increments ranging from 1 cm to 2 cm vertically. For illustrative purposes, all images in this report are associated with a central axial slice of this phantom. It is important however to realize that all of the deformations are fully 3 dimensional.
Contour based deformable registration was performed in the Pinnacle3 treatment planning system (Kaus et al., 2007). Both the thin plate splines (TPS) and elastic body splines (EBS) algorithms were used. Briefly, these deformation algorithms are inspired by physical models for either the bending of thin plates or the deformation of elastic bodies. For the TPS algorithm generalizations are made to higher dimensions, as our 3 dimensional images cannot be thought about as thin plates. The TPS and EBS algorithms are contour based in that the driving ‘force’ in the algorithm is derived from a set of contours in the pre- and post-deformed images. The vectors that point from vertices of a contour mesh in the deformed image to their corresponding vertices in the undeformed image can be thought of as samples of a vector field that defines the mapping between the images. Deformation of the entire image is then accomplished by interpolating these samples of this vector field to the entire 3D volume of the image. The EBS and TPS algorithms are simply two of a limitless number of possible choices of an interpolation algorithm. More about the implementation of these algorithms in Treatment planning system can be found elsewhere, cf. (Kaus et al., 2007). In order to produce various consistency maps, the deformation maps produced by the Treatment Planning System were exported to MATLAB for further processing. The appendix details some of the methods used for determining these maps.
After the phantom used here was deformed virtually in the Treatment planning system the glass beads were used as landmarks to access the accuracy of the deformation fields in 140 locations. This allows us to test the consistency metrics in terms of whether or not they correlate with registration error. The bead centroids were determined by an in-house algorithm which takes advantage of the fact that the glass beads are much more dense than anything else in the phantom. The Spearman’s rank-order correlation coefficient has been employed as a measure of correlation between the actual known errors in the bead positions to the consistency errors. Additionally, the percentage of the time that the consistency errors were larger than the actual errors was also calculated. Finally, the wood grain in the dowel was used as an indicator of the error in the deformation within this hard constraint, where there is no deformation, just translations and rotations.
Moreover, one arrives at an extension of the inverse consistency concept by using three separate images (A, B, and C) and their associated deformation vector fields that connect them, written as Δ⃗1 (x⃗), Δ⃗2(x⃗), and Δ⃗3(x⃗). Specifically, Δ⃗1(x⃗) maps image maps image A to B, Δ⃗2(x⃗) maps image B to C, and Δ⃗3(x⃗) maps image C back to A. These images could be for example three different phases in a 4D-CT image or images of the same patient from three different treatment fractions, although for our work here they are three images of our deformable phantom. If the deformation fields Δ⃗1(x⃗), Δ⃗2(x⃗), and Δ⃗3(x⃗)were all accurate then applying the three deformations sequentially on image A will result in no change in that image. If this operation is performed on a set of images with any real algorithm (which might not be accurate), and the sequential action of Δ⃗1(x⃗), Δ⃗2(x⃗), and Δ⃗3(x⃗) results in a change in the image A, then there must be errors in at least one of those deformation fields. The result of sequentially applying Δ⃗1(x⃗), Δ⃗2(x⃗), and Δ⃗3(x⃗) this case, where the initial and final images are the same, can be combined into its own composite deformation vector field that we call the gICE map, Σ⃗(x⃗), where Σ⃗(x⃗) = Δ⃗3(x⃗) ◦ Δ⃗2(x⃗) ◦ Δ⃗1(x⃗). Although we cannot access the individual errors present in the vector deformation fields Δ⃗1(x⃗), Δ⃗2(x⃗), and Δ⃗3(x⃗), the errors may accumulate in the Σ⃗(x⃗) map. Note however, that it is possible that errors in one deformation field may cancel with errors in another yielding a zero value at some points in the Σ⃗(x⃗) map. In other words, a zero value of Σ⃗(x⃗) is necessary but not sufficient for an accurate algorithm. The same limitation also applies to the other consistency checks we have tested.
Results and Discussion
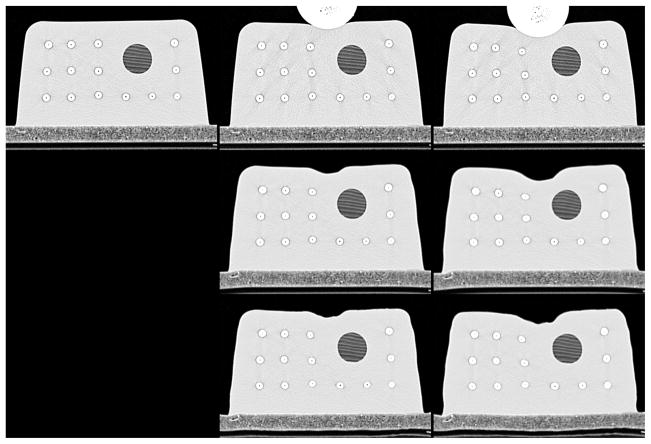
The top row of Figure 1 shows representative axial slices of the CT phantom used for our measurements, where the left, center, and right images correspond to images A, B, and C. The image on the top left is the phantom before any deformation was applied, while the center and right images show the phantom with compressions of 1 cm and 2 cm vertically (the 1.5 cm deformation level is omitted for this figure but is qualitatively similar). For deformable image registration, contours of the outside of the phantom and the wooden dowel were used as input to the algorithm. The center and bottom rows of Figure 1 show the resulting virtually deformed images at the 1 cm and 2 cm deformation phases, using the TPS and EBS algorithms, respectively.
Figure 1.
Top row: CT scans of the phantom before deformation (left) and after two levels of applied deformation (center and right). Middle row: Simulated deformations using the TPS algorithm. Bottom row: Simulated deformations using the EBS algorithm.
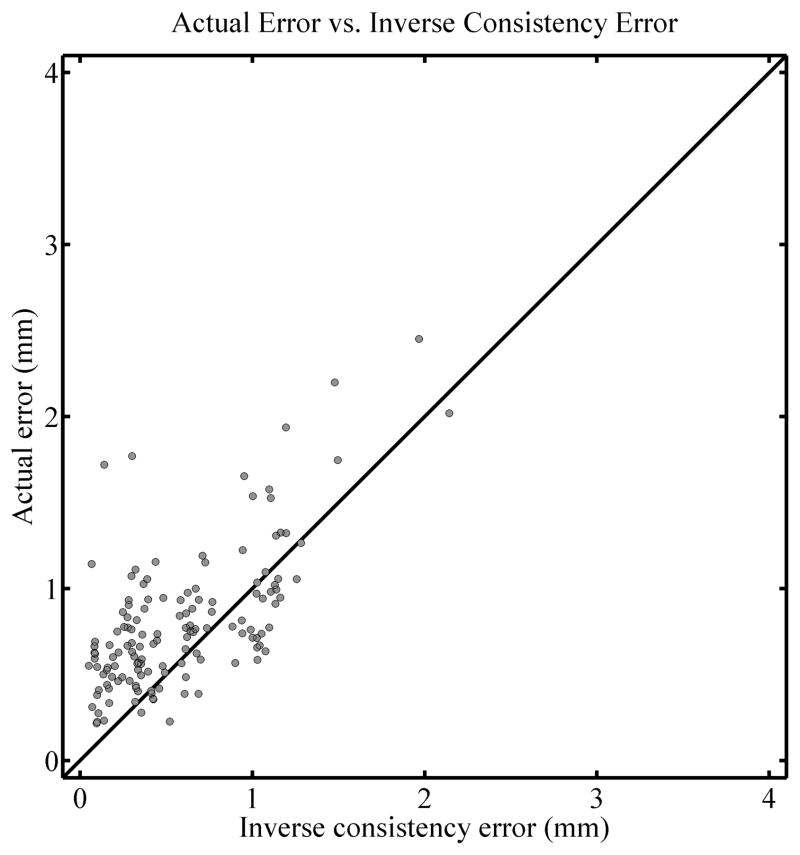
A test of the inverse consistency for the TPS algorithm is shown in Figure 2. The left panel shows an overlay of the physically and virtually deformed phantom after the 1 cm deformation level (corresponding to the top two images in the central column of Figure 1). Note the discrepancy in the position of the beads close to the ball used to compress the phantom. The right panel shows a color plot of the magnitude of the inverse consistency error map with a background of the undeformed phantom. The color scale spans from 0 mm in blue to 2.5 mm and higher in red. It can be seen that there is a significant inverse consistency error, as inferred by looking at the left panel, in the region where the deformation is not accurate. A more quantitative evaluation of the correlation between inverse consistency error and actual registration error is shown in Figure 3. For all of the 140 beads in the phantom it shows the relationship between the actual registration error at that bead position and the inverse consistency error for that same bead. The Spearman’s rank-order correlation coefficient for this example is rS = 0.568 (two tailed p < 0.01) and the percentage of the time that the actual registration error was larger than the inverse consistency error (i.e. the percentage of points above the diagonal line in the figure) is 73.6%. A diagonal line is drawn in the graph with a slope of 1 represents the line for which actual error is equal to the inverse consistency error and has been added to aid in visualizing the number of beads for which the actual error was larger than the inverse consistency error. These diagonal lines appear in all correlation plots here and it is important to note that they do not represent a best linear fit line for the data, but simply represent the line for which actual error equals the inverse consistency error.
Figure 2.
Left: Overlay of the physically deformed phantom and the one deformed virtually using the TPS algorithm, at the 1 cm deformation level. Right: Magnitude of the inverse consistency error map displayed as a colorwash on the original undeformed phantom. The colormap goes from 0 mm (blue) to 2.5 mm (red).
Figure 3.
Correlation plot for the comparison of actual registration error and inverse consistency error, for the TPS algorithm at the 1 cm deformation level. A diagonal line is drawn with a slope of 1 for reference and does not represent a fit of the data.
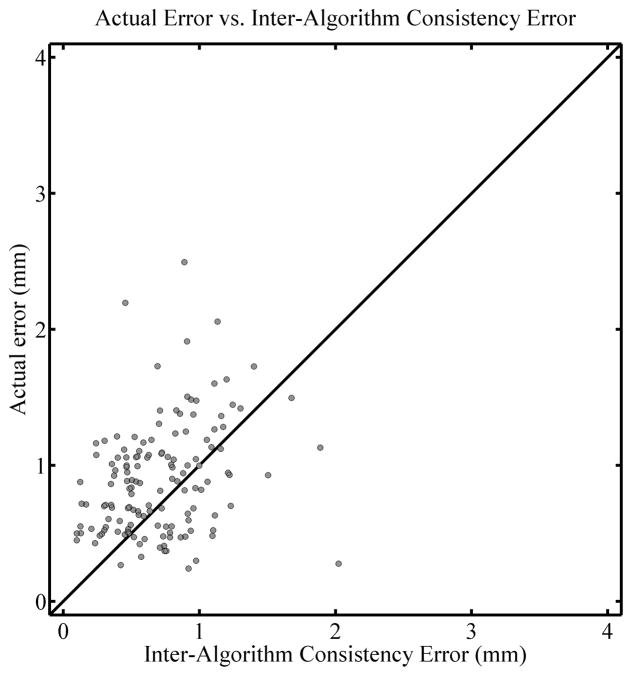
Figure 4 shows another kind of consistency error map in that it compares the results of the TPS and EBS deformations directly. The left panel shows an overlay of the virtually deformed images, one deformed with the TPS algorithm and the other with EBS. The right panel is a consistency map that relates the two deformed images. More specifically, applying the inter-algorithm consistency error deformation map whose magnitude appears in the right panel of Figure 4 to the TPS-deformed image will produce the EBS-deformed image. In other words, it is a deformation map representing the discrepancy between the deformation maps arrived at when using the TPS and EBS algorithm, respectively. (A more detailed description of how it is defined and calculated appears in the appendix). A priori there is no reason to believe ahead of time that EBS is more appropriate than TPS, so this discrepancy can be considered an uncertainty in a similar way as the inverse consistency error map can. Note in this case that Figure 4 illustrates the discrepancy between the deformation maps arrived at when employing the TPS and EBS algorithm, and that the discrepancy in the bead positions apparent in the figure is not illustrative of the actual error in the deformation. To quantitatively evaluate the actual error in the EBS deformation as it relates to the inter-algorithm consistency error, Figure 5 shows the corresponding correlation plot. The Spearman’s rank-order correlation coefficient rS = 0.301 (two tailed p < 0.01) and the actual error was larger than the inter-algorithm consistency error 71.4% of the time. This moderate correlation was typical for what was seen when using the inter-algorithm consistency error.
Figure 4.
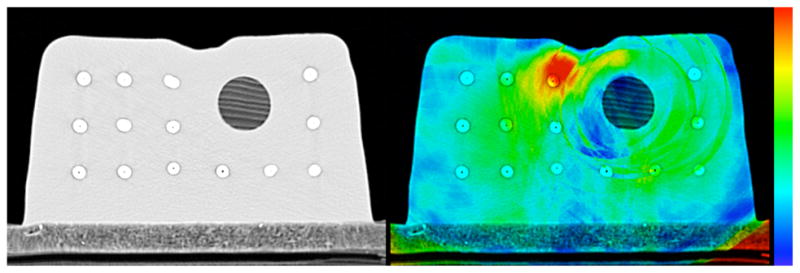
Left: Overlay of the virtually deformed phantoms using both the TPS and EBS algorithms, at the 1 cm deformation level. Right magnitude of the deformation map showing the consistency between the EBS and TPS algorithms, as a color overlay on the phantom after virtual deformation with the EBS algorithm. The colormap spans from 0 mm (blue) to 2.5 mm and above (red).
Figure 5.
Correlation plot for the comparison of actual registration error and inter-algorithm consistency error, with the actual regitration error for the EBS algorithm at the 1 cm deformation level as the vertical axis. A diagonal line is drawn with a slope of 1 for reference and does not represent a fit of the data.
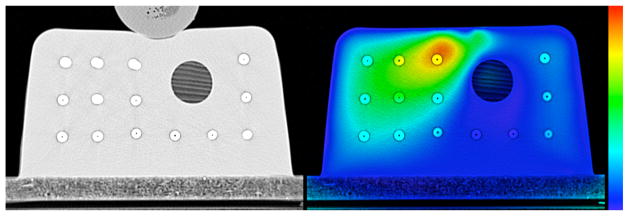
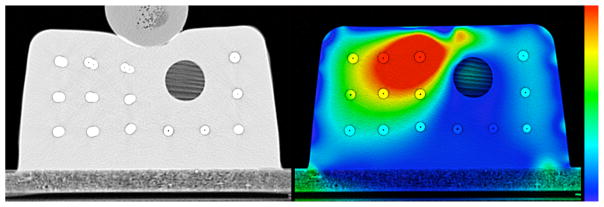
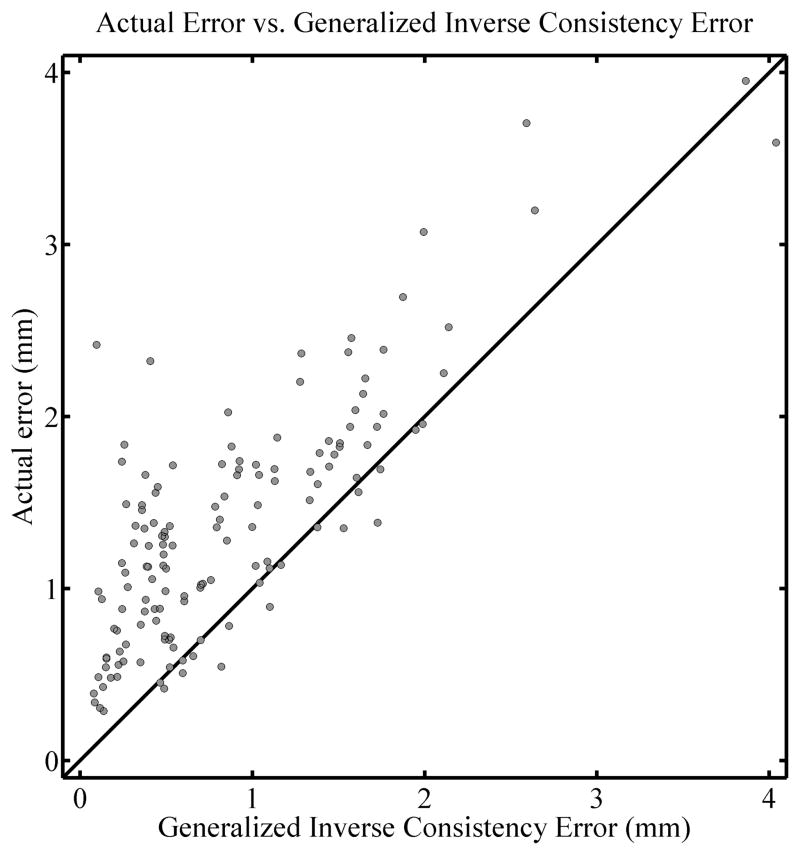
A test of the gICE, Σ⃗(x⃗), is illustrated in Figure 6. The left panel shows an overlay of the physically deformed phantom at the 2 cm deformation level (corresponding to the right column of Figure 1) and the phantom deformed virtually with the TPS algorithm. The right panel shows the Σ⃗(x⃗) map (computed using the undeformed image and those at the 1 cm and 2 cm levels) in color on top of the undeformed phantom. The colormap spans from 0 mm (blue) to 2.5 mm (red), the same as it is in Figure 2. Note in this case that the maximum value of this map exceeds 4 mm and is saturated here as to preserve the same color scale. As can be seen from Figure 6, qualitatively the red and yellow regions (i.e. regions where the Σ⃗(x⃗) map is relatively large) are associated with regions where deformations are inaccurate. A quantitative comparison is shown in Figure 7. The Spearman’s rank-order correlation coefficient is rS = 0.702 (two tailed p< 0.01) and the actual error is larger than the gICE 87.1% of the time.
Figure 6.
Left: Overlay of the physically deformed phantom (2 cm deformation level as in the top right of figure 1) and the one deformed virtually using the TPS algorithm. Right: The magnitude of the generalized inverse consistency error (gICE)as a color overlay on the undeformed phantom. The colormap spans from 0 mm (blue) to 2.5 mm and above (red).
Figure 7.
Correlation plot for the comparison of actual registration error and the generalized inverse consistency error (gICE), for the TPS algorithm. The three images used were the undeformed, 1 cm level, and 2 cm level. A diagonal line is drawn with a slope of 1 for reference and does not represent a fit of the data.
A further fact to note is that the Σ⃗(x⃗) map is associated with errors in the deformation map within the dowel, which can be more clearly appreciated from Figure 8, which shows the original dowel (left) and that after the first two of the three deformations have been applied (Δ⃗2 ◦ Δ⃗1) (center). The right panel shows the Σ⃗(x⃗) map with a different color scale as the rest of the figures, specifically 0 mm (blue) to 1 mm (red). Incidentally, this suggests that an algorithm that uses rigidity penalties in structures known to be rigid may be advantageous (Staring et al., 2007). However, in this particular case the error appears to be very small (less than 1mm). Regardless of the magnitude of the error in this particular case, however, the utility of the Σ⃗(x⃗) method can be appreciated here because it would have identified this inaccuracy in the shape of the wood grain, and hence deformation field, whether there was any contrast in the wood grain or not; the presence of the wood grain allows us to confirm the inaccuracy here but our method did not depend on this contrast to identify the error. Thus, this method along with the other consistency checks may have the ability to identify some inaccuracies in areas of low contrast or even zero contrast regions where landmark identification is impossible and where a difference image would be zero.
Figure 8.

A closeup view of the dowels shown in figure 6, in the physically deformed phantom (left) and virtually deformed phantom (center). The right shows the magnitude of the generalized inverse consistency error (gICE) with a colormap spanning from 0 mm (blue) to 1 mm (red).
Multiple correlation plots similar to the ones previously discussed were produced with a variety of different deformation levels and the results are summarized in Table 1, which shows Spearman’s rank-order correlation coefficient for the comparison of actual registration error and the value of the consistency metric in question, the two tailed p-value, and the percentage of the time that the actual registration error was larger than the consistency metric. The results for all deformation levels combined are also shown as a meta-analysis. For the consistency metrics that only require two images (inverse consistency and inter-algorithm consistency), six deformations were considered as can be seen in the table, while three different combinations of deformation levels were considered with the gICE.
Table 1.
Correlation coefficients between the consistency metrics and actual registration errors, the associated two tailed p-value, and the percentage of beads where the actual registration error was larger than the consistency metric in question. The bottom 6 rows combine all deformation levels for the three types of consistency metrics and two deformation algorithms. The correlation coefficients where the p-value is larger than 0.05 are listed as not significant (NS).
| Consisistency Metric | Algorithm | Deformation (cm) | Correlation Coefficient rs | Two tailed p-value | Actual Error Larger (%) | ||
|---|---|---|---|---|---|---|---|
| 1st | 2nd | 3rd | |||||
| Inverse | TPS | 0 | 1 | - | 0.568 | < 0.01 | 73.6 |
| Inverse | TPS | 0 | 1.5 | - | 0.600 | < 0.01 | 91.4 |
| Inverse | TPS | 0 | 2 | - | 0.656 | < 0.01 | 95.7 |
| Inverse | TPS | 1 | 1.5 | - | 0.392 | < 0.01 | 87.1 |
| Inverse | TPS | 1 | 2 | - | 0.614 | < 0.01 | 94.3 |
| Inverse | TPS | 1.5 | 2 | - | 0.560 | < 0.01 | 93.6 |
| Inverse | EBS | 0 | 1 | - | NS | 0.450 | 96.4 |
| Inverse | EBS | 0 | 1.5 | - | NS | 0.577 | 98.6 |
| Inverse | EBS | 0 | 2 | - | NS | 0.782 | 97.1 |
| Inverse | EBS | 1 | 1.5 | - | 0.214 | 0.0113 | 100.0 |
| Inverse | EBS | 1 | 2 | - | −0.230 | < 0.01 | 95.0 |
| Inverse | EBS | 1.5 | 2 | - | NS | 0.569 | 98.6 |
| Inter-algorithm | TPS | 0 | 1 | - | 0.419 | < 0.01 | 60.0 |
| Inter-algorithm | TPS | 0 | 1.5 | - | 0.403 | < 0.01 | 63.6 |
| Inter-algorithm | TPS | 0 | 2 | - | 0.338 | < 0.01 | 76.4 |
| Inter-algorithm | TPS | 1 | 1.5 | - | 0.231 | < 0.01 | 75.7 |
| Inter-algorithm | TPS | 1 | 2 | - | 0.328 | < 0.01 | 51.4 |
| Inter-algorithm | TPS | 1.5 | 2 | - | NS | 0.661 | 49.3 |
| Inter-algorithm | EBS | 0 | 1 | - | 0.301 | < 0.01 | 71.4 |
| Inter-algorithm | EBS | 0 | 1.5 | - | 0.196 | 0.0204 | 67.9 |
| Inter-algorithm | EBS | 0 | 2 | - | NS | 0.134 | 52.9 |
| Inter-algorithm | EBS | 1 | 1.5 | - | 0.321 | < 0.01 | 87.1 |
| Inter-algorithm | EBS | 1 | 2 | - | −0.203 | 0.0164 | 50.0 |
| Inter-algorithm | EBS | 1.5 | 2 | - | 0.200 | 0.0181 | 63.6 |
| gICE | TPS | 0 | 1 | 1.5 | 0.612 | < 0.01 | 83.6 |
| gICE | TPS | 0 | 1 | 2 | 0.702 | < 0.01 | 87.1 |
| gICE | TPS | 1 | 1.5 | 2 | 0.617 | < 0.01 | 91.4 |
| gICE | EBS | 0 | 1 | 1.5 | 0.250 | < 0.01 | 97.9 |
| gICE | EBS | 0 | 1 | 2 | NS | 0.0502 | 76.4 |
| gICE | EBS | 1 | 1.5 | 2 | 0.312 | < 0.01 | 62.1 |
| Meta analysis | |||||||
| Inverse | TPS | 0.661 | < 0.01 | 89.3 | |||
| Inverse | EBS | 0.342 | < 0.01 | 97.6 | |||
| Inter-algorithm | TPS | 0.550 | < 0.01 | 62.7 | |||
| Inter-algorithm | EBS | 0.434 | < 0.01 | 65.5 | |||
| gICE | TPS | 0.684 | < 0.01 | 87.4 | |||
| gICE | EBS | 0.204 | < 0.01 | 78.8 | |||
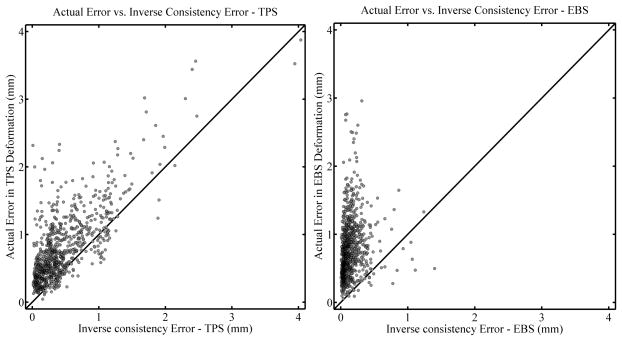
Figure 9 shows correlation plots for the actual error vs. inverse consistency error for all deformation levels combined. The left panel shows the results for the TPS algorithm while the right panel shows that for the EBS algorithm. In general the correlation is stronger for the TPS algorithm as compared to the EBS algorithm (Spearman’s rank-order correlation coefficient rS = 0.661, p < 0.01, vs. rS = 0.342, p < 0.01 respectively.) However, both correlations are still moderate in strength. The actual error is larger than the inverse consistency error for 89.3% and 97.6% of the beads for the TPS and EBS algorithms, respectively. This shows that the inverse consistency error may be useful as a lower bound of the actual registration error: Although there is no guarantee that the actual error is larger than the inverse consistency error, there appears to be a trend for it to be so. Additionally, despite the moderate correlation between the inverse consistency error and actual error when the EBS algorithm was used, there was a strong trend for the actual error to be larger than the inverse consistency error, so it still may be useful.
Figure 9.
Correlation plots comparing the actual error in TPS deformations (left panel) and EBS deformations (right panel) with the inverse consistency error. All deformation levels are combined (see text). Diagonal lines are drawn with a slope of 1 for reference and do not represent a fit of the data.
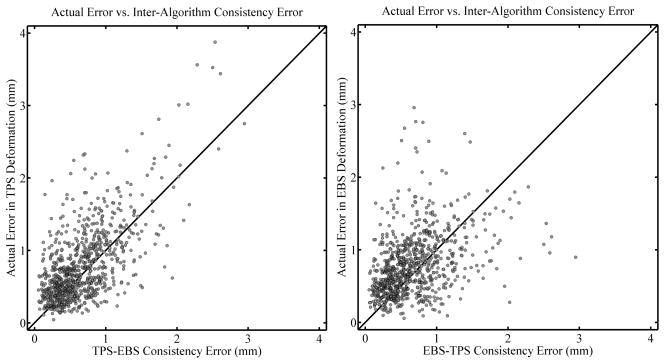
A correlation plot for the inter-algorithm consistency error, for all deformation levels combined, is shown in Figure 10, with the results for the TPS algorithm shown on the left and the EBS algorithm on the right. (That is, the left panel shows the actual error in the TPS deformation plotted against the TPS-EBS inter-algorithm consistency error, while the right panel is the same for the actual error in the EBS deformation). The Spearman’s rank-order correlation coefficients are rS = .550 (two tailed p< 0.01) and rS = .434 (two tailed p < 0.01) for the TPS and EBS algorithms, respectively, while the actual error is larger than the inter-algorithm consistency error 62.7% and 65.5% of the time, respectively. From these results it appears that the inter-algorithm consistency error, although moderately correlated to actual registration error, is not as useful as the inverse consistency error to estimate a possible lower bound for the actual registration error.
Figure 10.
Correlation plots comparing the actual error in TPS deformations (left panel) and EBS deformations (right panel) with the inter-algorithm consistency error. All deformation levels are combined (see text). Diagonal lines are drawn with a slope of 1 for reference and do not represent a fit of the data.
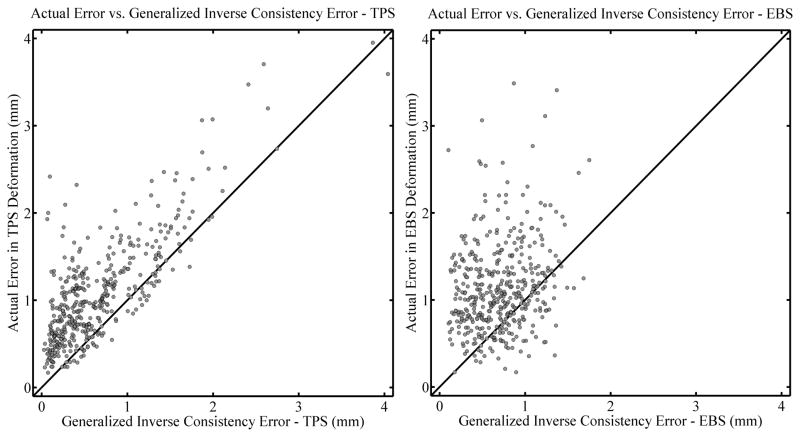
Finally, a correlation plot for gICE, for all deformation levels combined, is shown in Figure 11, again with the TPS algorithm to the left and the EBS algorithm to the right. The Spearman’s rank-order correlation coefficients are rS = 0.684 (two tailed p< .01) and rS = 0.204 (two tailed p < .01). The percentage of the time that the actual error is larger than the gICE is 87.4% and 78.8%, respectively.
Figure 11.
Correlation plots comparing the actual error in TPS deformations (left panel) and EBS deformations (right panel) with the generalized inverse consistency error (gICE). All deformation levels are combined (see text). Diagonal lines are drawn with a slope of 1 for reference and do not represent a fit of the data.
Judging from Figures 9–11 and Table 1, it appears that the registration algorithm affects the correlation coefficients more than the level of deformation, with the TPS algorithm often having a substantially larger correlation as compared to the same deformation level with the EBS algorithm. Also of interest is the fact that there is a bias for the actual registration error to be larger than the consistency metrics. This is the most striking when considering inverse consistency error with the EBS algorithm (cf. Figure 9). Based on the data in Figure 9, it appears that the EBS algorithm has a tendency to be more inverse consistent than the TPS algorithm, i.e. that the inverse consistency error seems to be smaller on average when EBS is used. This could explain why the correlation between inverse consistency error and actual registration error was relatively weak or non-existent for the EBS algorithm. Although when using the EBS algorithm the inverse consistency error significantly underestimates the actual registration error, this trend is not as apparent when gICE is used instead (cf. Figure 11). This demonstrates a potential utility of the gICE concept; an algorithm that tends towards inverse consistency may perform well with an inverse consistency test but the generalized inverse consistency test, which involves 3 deformations, none of which are inverses of each other, may be able to elucidate some of the errors present when employing a given deformation algorithm.
Conclusions
We have demonstrated the possible utility of consistency metrics (inverse consistency error, inter-algorithm consistency error, and gICE) for contour based deformable image registration error analysis. Weak to moderate correlations were found between actual registration error and the consistency errors. There was variability in the strength of the correlations, with correlations being strongest for the TPS algorithm. There was also a tendency, though not absolute, for the actual registration error to be larger than the consistency metrics, with inverse consistency error showing the strongest tendency in this regard. If no other error estimates are available for a deformation task, it may therefore be prudent to use the inverse consistency error as an estimate of the minimum uncertainty. The same consideration applies to the generalized inverse consistency error Σ⃗(x⃗). The Σ⃗(x⃗) test may be better suited to algorithms that have a natural tendency towards inverse consistency, and it may be interesting in the future to apply the Σ⃗(x⃗) test to an inherently inverse consistent algorithm, which will pass the inverse consistency check but perhaps may still fail the Σ⃗(x⃗) test. Determining whether these consistency metrics have utility in other types of deformable registration, such as with image based algorithms, is reserved for future work.
Acknowledgments
This work was supported in part by the National Institutes of Health Grants R01-CA109656 and R01-CA118365.
Appendix
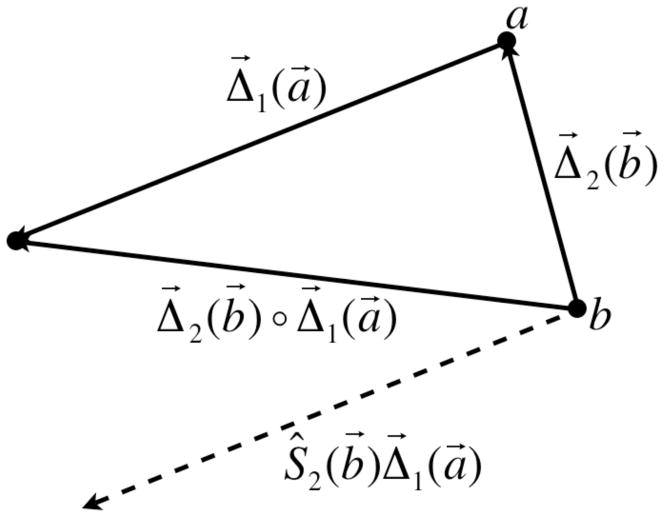
For many tasks in this report the necessity arises to determine the equivalent deformation map resulting from two or more successive deformations. In the case where one is interested in finding an equivalent deformation map such that Δequivalent (I) = Δ2 ◦ Δ1(I) acting on an arbitrary image I, one may be tempted to simply add the vector fields. However, a problem arises because Δ⃗1 and Δ⃗2 do not act on the same images. This issue can be appreciated further in Figure 12 as discussed below.
Figure 12.
Vector diagram showing the method used to combine two deformation fields
Although one would naturally think that a deformation vectors exist in the original image coordinate system and point to where voxels go in the deformed image, for our work the original deformation fields exist in the coordinate system of the deformed image, and point to the corresponding voxels in the original image. This is how the treatment planning system defines them and it is more convenient computationally. This is because the deformed image can be calculated on a point-by-point basis for each voxel by simply sampling the vector field at each point in the deformed image and using it to determine the image value at that point. If the vector field were defined in the coordinate system of the original image then there will likely be ‘holes’ in the deformed image. Note therefore, that the actual deformation of the image proceeds in the opposite direction as the arrows of the vectors; this is necessary to preserve the fact that vectors are always defined at their starting point.
Looking now at Figure 12, one can see samples of the deformation vector fields at points a⃗ and b⃗, Δ⃗1(a⃗) and Δ⃗2 (b⃗). The equivalent deformation vector resulting from the subsequent action of Δ⃗1(a⃗) and Δ⃗2 (b⃗) is written as Δ⃗2 (b⃗) ◦ Δ⃗1(a⃗). In a computational setting we need to add the vector fields together but we can only accomplish this if the vectors Δ⃗1(a⃗) and Δ⃗2 (b⃗) exist at the same point. This problem can be remedied by shifting the vector Δ⃗1(a⃗) by Δ⃗2 (b⃗), moving it down to point b⃗ where the two fields can then be added directly. The result of this shift is shown as a dashed vector. We write this shift operation as Ŝ2 (b⃗)Δ⃗1(a⃗). Computationally, the shift operator Ŝ2 (b⃗) behaves as if it was a deformation field but instead of acting on image points it acts on other deformation fields. Therefore, the proper way to combine the deformation vectors Δ⃗1(a⃗) and Δ⃗2 (b⃗) is Δ⃗2 ◦ Δ⃗1 = Δ⃗2 + Ŝ2Δ⃗1. This method of combining vector fields is used extensively throughout this work.
There is one more fundamental operation that needs to be preformed on a regular basis and that is inverting deformation fields. There is a similar pitfall here as with combining vector fields: The inverse of a deformation field is not simply that same field with the signs reversed. The reason for this complication is essentially the same as what was discussed earlier: The forward and inverse deformation fields act on different images. Although it is computationally expensive, deformation fields can be computationally inverted in MATLAB ® (MathWorks ™) using the griddata3 function. This algorithm is similar conceptually to a 3D interpolation except it is designed for data that is not on a regular grid. This is precisely the problem that arises when trying to invert a deformation field: All of the vectors in the forward deformation are defined on a regular grid but the points they refer back to (the tips of the vectors) can be distributed in a very irregular pattern, certainly no longer on a grid. The griddata3 function does a reasonably good job of “gridding” this data (hence the name). It is important to note however that because of the inherent interpolation processes when applying deformations and when inverting them with griddata3, small discrepancies are likely to be introduced into the images and inverted deformation fields. These discrepancies result in a slight blurring of the deformed images, and this can be appreciated by close examination of the virtually deformed images of Figure 1.
Now that vector fields can be combined and inverted in a computational environment, all of the consistency metrics used in this report can be constructed. Inverse consistency is the simplest consistency metric to construct, being simply the composition of the forward and reverse deformation fields. We use the term “reverse” to refer to the vector field determined by the algorithm in the treatment planning system when the baseline and deformable images have their roles reversed, i.e. the baseline image takes the place of the deformed image and the deformed image takes the place of the baseline image. This is not to be confused with the inverse of a deformation field as calculated directly in MATLAB ®. Thus, the inverse consistency error map is calculated by Δ⃗2 ◦ Δ⃗1 = Δ⃗2 + Ŝ2Δ⃗1 where in this instance Δ⃗1 is the forward vector field and Δ⃗2 is the reverse. Ŝ2 is the shift operator as discussed before associated with the reverse deformation vector field. As an added complication, but one that is necessary for properly displaying the vector fields in the figures shown here, the inverse consistency error map as calculated is inverted. This is because as calculated above, the inverse consistency error map exists in the coordinate system of the deformed image, but we would prefer to view it on the undeformed image, so it has to be inverted.
When looking at the consistency between different algorithms, as we did in this report with the EBS and TPS deformation algorithms, a similar technique can be used. Figure 13 shows a similar diagram as in Figure 12 but we have changed the meaning of the vectors for the current discussion. The two algorithms yield two different deformation maps Δ⃗TPS and Δ⃗EBS, and we are interested in a quantitative measure of the discrepancy between the two. This discrepancy is defined as Δ⃗C such that Δ⃗C ◦ Δ⃗TPS = Δ⃗EBS. In a technique similar to those used before, Δ⃗C can be found by first by shifting Δ⃗TPS so that it’s starting point is at the correct location, yielding the dotted vector shown in the figure . Vector subtraction then yields . These consistency maps can be shown in the coordinate system of the EBS-deformed image without having to do any inversions, and this is why the right panel of Figure 4 is shown with a background of the EBS-deformed image.
Figure 13.
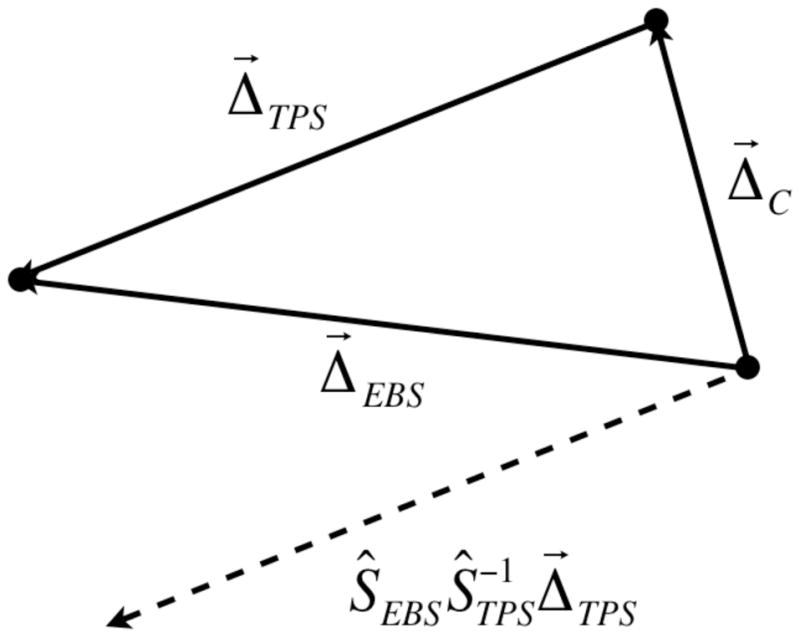
Vector diagram showing how the consistency between two different algorithms is defined and calculated
Finally, for calculating Σ⃗(x⃗) maps, a simple extension to the process of combining vector fields can be performed. Using the shift operator Ŝ, one can show that Σ⃗(x⃗) = Δ⃗3 + Ŝ3Δ⃗2 + Ŝ3Ŝ2Δ⃗1. This Σ⃗(x⃗) map is inverted before being displayed in Figure 6 so that they can be displayed as an overlay on the undeformed image. Without inversion, the proper way to display the Σ⃗(x⃗) map would be on the image that has been deformed by Σ⃗(x⃗), which is not as intuitive. In practice deforming an image sequentially with all of the individual deformations should produce the same result as applying the Σ⃗(x⃗) map to the original image. This fact can be used to test whether the Σ⃗(x⃗) map has been appropriately constructed. In fact, “reality checks” such as this one can and have been done for all of the consistency metrics used in this report.
References
- Brock KK, Sharpe MB, Dawson LA, Kim SM, Jaffray DA. Accuracy of finite element model-based multi-organ deformable image registration. Med Phys. 2005;32:1647–59. doi: 10.1118/1.1915012. [DOI] [PubMed] [Google Scholar]
- Castadot P, Lee JA, Parraga A, Geets X, Macq B, Gregoire V. Comparison of 12 deformable registration strategies in adaptive radiation therapy for the treatment of head and neck tumors. Radiother Oncol. 2008;89:1–12. doi: 10.1016/j.radonc.2008.04.010. [DOI] [PubMed] [Google Scholar]
- Christensen GE, Johnson HJ. Consistent image registration. IEEE Trans Med Imaging. 2001:20568–82. doi: 10.1109/42.932742. [DOI] [PubMed] [Google Scholar]
- Ehler ED, Tome WA. Lung 4D-IMRT treatment planning: An evaluation of three methods applied to four-dimensional data sets. Radiother Oncol. 2008;88:319–25. doi: 10.1016/j.radonc.2008.07.004. [DOI] [PubMed] [Google Scholar]
- Isambert A, Dhermain F, Bidault F, Commowick O, Bondiau PY, Malandain G, Lefkopoulos D. Evaluation of an atlas-based automatic segmentation software for the delineation of brain organs at risk in a radiation therapy clinical context. Radiother Oncol. 2008;87:93–9. doi: 10.1016/j.radonc.2007.11.030. [DOI] [PubMed] [Google Scholar]
- Kashani R, Hub M, Kessler ML, Balter JM. Technical note: a physical phantom for assessment of accuracy of deformable alignment algorithms. Med Phys. 2007;34:2785–8. doi: 10.1118/1.2739812. [DOI] [PubMed] [Google Scholar]
- Kaus MR, Brock KK, Pekar V, Dawson LA, Nichol AM, Jaffray DA. Assessment of a model-based deformable image registration approach for radiation therapy planning. Int J Radiat Oncol Biol Phys. 2007;68:572–80. doi: 10.1016/j.ijrobp.2007.01.056. [DOI] [PubMed] [Google Scholar]
- Kessler ML. Image registration and data fusion in radiation therapy. Br J Radiol. 2006;79(Spec No 1):S99–108. doi: 10.1259/bjr/70617164. [DOI] [PubMed] [Google Scholar]
- Kim Y, Tome WA. Risk-adaptive optimization: selective boosting of high-risk tumor subvolumes. Int J Radiat Oncol Biol Phys. 2006;66:1528–42. doi: 10.1016/j.ijrobp.2006.08.032. [DOI] [PMC free article] [PubMed] [Google Scholar]
- Leow A, Huang SC, Geng A, Becker J, Davis S, Toga A, Thompson P. Inverse consistent mapping in 3D deformable image registration: its construction and statistical properties. Inf Process Med Imaging. 2005;19:493–503. doi: 10.1007/11505730_41. [DOI] [PubMed] [Google Scholar]
- Lu W, Chen ML, Olivera GH, Ruchala KJ, Mackie TR. Fast free-form deformable registration via calculus of variations. Phys Med Biol. 2004;49:3067–87. doi: 10.1088/0031-9155/49/14/003. [DOI] [PubMed] [Google Scholar]
- Lu W, Olivera GH, Chen Q, Ruchala KJ, Haimerl J, Meeks SL, Langen KM, Kupelian PA. Deformable registration of the planning image (kVCT) and the daily images (MVCT) for adaptive radiation therapy. Phys Med Biol. 2006;51:4357–74. doi: 10.1088/0031-9155/51/17/015. [DOI] [PubMed] [Google Scholar]
- Rietzel E, Chen GT, Choi NC, Willet CG. Four-dimensional image-based treatment planning: Target volume segmentation and dose calculation in the presence of respiratory motion. Int J Radiat Oncol Biol Phys. 2005;61:1535–50. doi: 10.1016/j.ijrobp.2004.11.037. [DOI] [PubMed] [Google Scholar]
- Staring M, Klein S, Pluim JP. A rigidity penalty term for nonrigid registration. Med Phys. 2007;34:4098–108. doi: 10.1118/1.2776236. [DOI] [PubMed] [Google Scholar]
- Tome WA, Fowler JF. Selective boosting of tumor subvolumes. Int J Radiat Oncol Biol Phys. 2000;48:593–9. doi: 10.1016/s0360-3016(00)00666-0. [DOI] [PubMed] [Google Scholar]
- Yan D. Developing quality assurance processes for image-guided adaptive radiation therapy. Int J Radiat Oncol Biol Phys. 2008;71:S28–32. doi: 10.1016/j.ijrobp.2007.08.082. [DOI] [PubMed] [Google Scholar]
- Yan D, Vicini F, Wong J, Martinez A. Adaptive radiation therapy. Phys Med Biol. 1997;42:123–32. doi: 10.1088/0031-9155/42/1/008. [DOI] [PubMed] [Google Scholar]
- Yang D, Li H, Low DA, Deasy JO, Naqa IE. A fast inverse consistent deformable image registration method based on symmetric optical flow computation. Phys Med Biol. 2008;53:6143–65. doi: 10.1088/0031-9155/53/21/017. [DOI] [PMC free article] [PubMed] [Google Scholar]
- Zhong H, Peters T, Siebers JV. FEM-based evaluation of deformable image registration for radiation therapy. Phys Med Biol. 2007;52:4721–38. doi: 10.1088/0031-9155/52/16/001. [DOI] [PubMed] [Google Scholar]


