Abstract
This work reports the design of and experimentation with a topographically patterned cell culture substrate of variable local density and anisotropy as a facile and efficient platform to guide the organization and migration of cells in spatially desirable patterns. Using UV-assisted capillary force lithography, an optically transparent microstructured layer of a UV curable poly(urethane acrylate) resin is fabricated and employed as a cell-culture substrate after coating with fibronectin. With variable local pattern density and anisotropy present in a single cell-culture substrate, the differential polarization of cell morphology and movement in a single experiment is quantitatively characterized. It is found that cell shape and velocity are exquisitely sensitive to variation in the local anisotropy of the two-dimensional rectangular lattice arrays, with cell elongation and speed decreasing on symmetric lattice patterns. It is also found that cells could integrate orthogonal spatial cues when determining the direction of cell orientation and movement. Furthermore, cells preferentially migrate toward the topographically denser areas from sparser ones. Consistent with these results, it is demonstrated that systematic variation of local densities of rectangular lattice arrays enable a planar assembly of cells into a specified location. It is envisioned that lithographically defined substrates of variable local density and anisotropy not only provide a new route to tailoring the cell-material interface but could serve as a template for advanced tissue engineering.
1. Introduction
The biomimetic design of a cell-material interface is of great importance in a wide variety of biomedical applications, including those using biomaterials, engineered tissues, implantable medical devices, and drug-delivery systems.[1-4] Inspired by the analysis of cell-extracellular matrix (ECM) interactions, micro- and nano-structured biomaterials mimicking structural and mechanical in vivo ECM environments have been incorporated into synthetic scaffolds to form functional model tissues.[5-9] Various techniques have been employed for the fabrication of micro- and nanotopographic substrata, such as colloidal lithography,[10,11] polymer demixing,[12] electrospinning,[8] nanoimprinting,[13] and dip-pen nanolithography.[14] Of these, the first three methods can endow a surface with random or semirandom topography, so that the interactions between topography and living mammalian cells might be elucidated only on a somewhat limited spatial scale. The latter two methods are able to generate a well-ordered array over larger areas. However, these two methods are potentially limited in that nanoimprinting requires a sophisticated experimental set-up and dippen nanolithography frequently is less cost effective and might be unsuitable for constructing a three-dimensional (3D) topography. Thus, simpler, more scalable and cost-effective techniques for fabricating precise micro- and nanotopographic features might be beneficial to study cell behavior and to establish a potential tissue-engineering application.
Recent advances in the aforementioned micro- and nanofabrication techniques have revealed the effects of ECM micro- and nanotopography on defining cell functions such as adhesion,[15] migration,[16] proliferation[17] and differentiation[18] as well as cytoskeletal organization[19] and morphology[20]. Of these, the spatial organization of cells and their migration are essential for various biological, pathological, and immunological processes, including embryogenesis, maintenance of homeostasis, inflammation, wound healing, and tumor metastasis.[21] Kumar et al. demonstrated that microarrays of asymmetric cell-adhesive islands could afford the directional control of lamellipodia attachment and extension, enabling cells to move continuously in predetermined directions along preset paths.[22] Inspired by these observations, we investigated how large-area topographic control of biomaterials can be used to guide long-range directional migration of adherent mammalian cells.
Despite a considerable amount of ongoing research on tailored biomaterial interface, current efforts in the area of biomimetic topographic definition of the cellular microenvironment are centered on rather simplistic patterns. For example, most experiments are performed with spatially homogenous patterns of ECM density or topography definition. Cell substrata are commonly patterned with micro- and nanoridges of specified pitch, width, and height, which, although possibly varied from experiment to experiment, are constant in any one experiment. However, supporting ECM structures in living tissues and the scaffolds that might be used for tissue engineering and engraftment are generally inhomogeneous, with complex structures that may vary on the scale of a single cell.
This report describes the design of a functional and spatially complex cell-material interface that can be used to guide cell organization and migration, with potential implications for tissue formation in a spatially desired pattern. More specifically, we fabricated a 2D cell-culture substrate patterned with a grid of topographic features of different local densities, mimicking the structural architectures of ECM networks. To construct a robust micropatterned, density-variant cell-culture substrate in a scalable and cost-effective fashion, we used UV-assisted capillary force lithography to pattern UV-curable poly(urethane acrylate) (PUA) resin on a transparent cell-culture coverslip. We show that this lithographically constructed pattern presenting migrating cells with variable local topographic cues can have a profound effect on the organization of long-range cell movement and ultimate cell arrangement on the micro- and nanofabricated substrate.
2. Results and Discussion
2.1. Fabrication of a 2D Square Lattice Pattern of Vertically and Horizontally Variable Local Densities
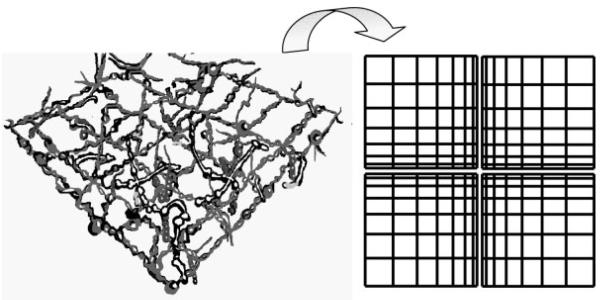
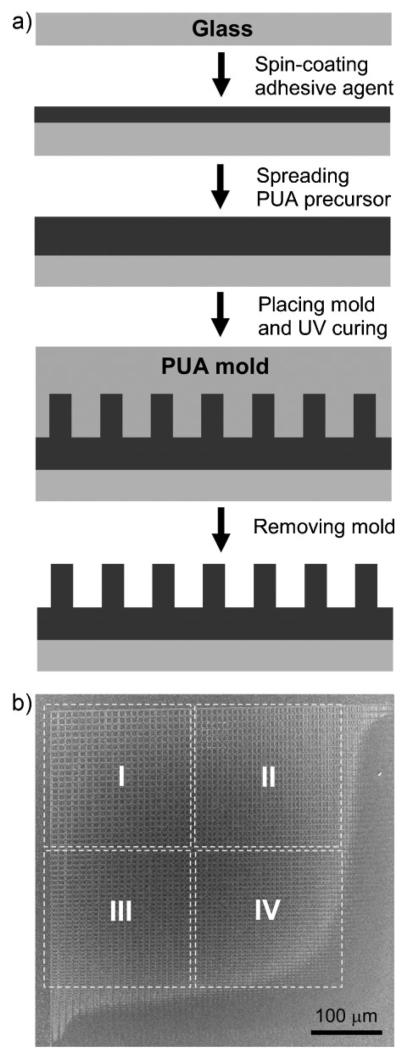
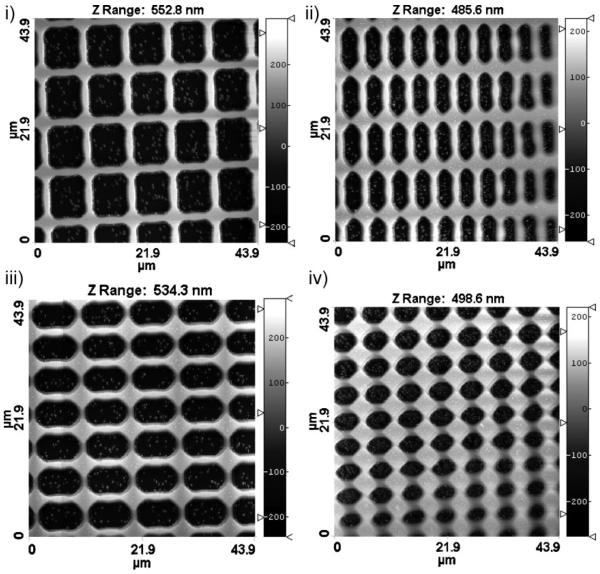
In many tissues, ECM forms a meshwork of interlinked fibers of variable density and complexity of organization (Fig. 1). In designing the cell-culture substrate, we mimicked this in vivo cellular microenvironment by fabricating a topographically defined pattern, whose features varied in a graded fashion in 2D. A schematic of the experimental fabrication procedure is shown in Figure 2a. It relies on capillary force lithography, wherein the capillary force spontaneously drives the PUA precursor into the cavities in the engraved mold followed by curing through exposure to the UV light for ≈20 s. Details of this technique can be found elsewhere.[23] The pattern was 600 × 600 μm2 in size and contained a lattice network of perpendicular ridges of different local densities (the direction of the ridges was designated as “vertical” and “horizontal” for convenience). The rounded cross-shaped region in the center was flat and continuous (no pattern). It was surrounded by the topographically patterned areas of variable local densities (Fig. 2b; one fourth of the total patterned area is shown), with the local density of the pattern features gradually increasing toward the central unpatterned area. The atomic force microscopy (AFM) imaging confirmed that the desired pattern was fabricated to high accuracy and helped us to approximately subdivide it into four distinct regions (Fig. 3, Regions I to IV), each having distinct local pattern density and, for Regions II and III, orientation asymmetry. The approximate geometrical parameters for each region shown in Figure 3 were: 1.5-μm-wide ridges for Regions I–III with 8.0- and 9.5-μm inter-ridge intervals (in horizontal and vertical directions, respectively) in Region I, 4.5- and 9.5-μm intervals in Region II, 9.5- and 6.0-μm intervals in Region III, and 2.0-μm-wide ridges with 6.0- and 5.0-μm intervals in Region IV. The height of the pattern was ≈500 nm throughout the patterned region. As the pattern topography varied gradually, these data indicated the typical dimensions at the central zones of Regions I–IV, representative of the topography in these regions.
Figure 1.
Schematic illustration of in vivo-like ECM architectures and bioinspired design of topographically tailored substrate of variable local densities.
Figure 2.
Two-dimensional square lattice pattern arrays of vertically and horizontally variable local densities. a) Schematic image of the microfabrication process used to generate PUA micropattern arrays. Drawings are not to scale. b) SEM images of one quarter of the designed 2D pattern arrays. A central area (bottom right) with a rounded cross shape in the actual pattern is the target area for cell aggregation and the surrounding area is engineered with topographically variable micropatterns with a lattice shape.
Figure 3.
AFM images of four distinct regions of different local densities shown in Figure 2b.
2.2. Analysis of Guided Cell Migration on the Topographically Patterned Substrate with Different Local Density
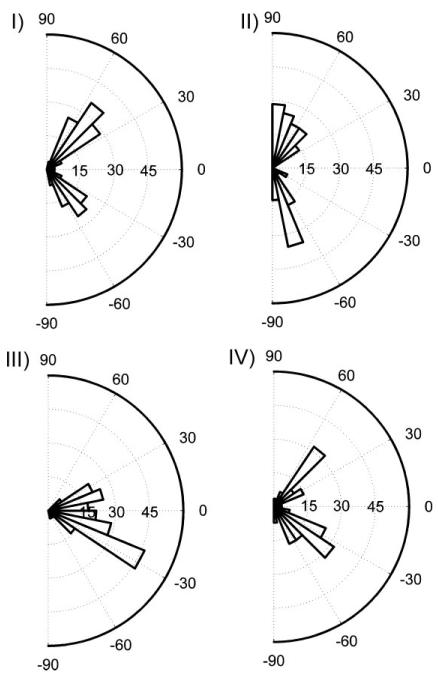
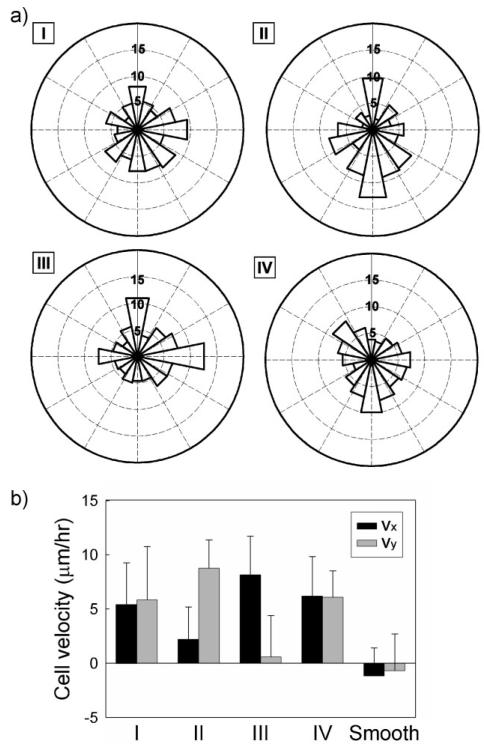
To investigate whether cell adherence, spreading, and migration were sensitive to the variation of the local topographic pattern density, we cultured NIH 3T3 fibroblasts on fibronectin-coated topographic substrate for 14 hours. We observed that cells adhered on all four patterned areas shown in Figure 2b, moving largely toward the denser pattern areas from their initial positions. The distribution of cell-orientation angles (the angle of the major axis of a cell with respect to the horizontal direction) correlated well with the topographic features of the underlying substrates, that is, horizontally and vertically aligned ridge/groove patterns (Fig. 4). The cells in the area of low pattern density (Region I) were found to be oriented at angles of approximately 45° and −45° with respect to horizontal ridges/grooves on square lattice pattern. The two peaks (approximating −90° and 90°) in the percentage distribution in the Region II, with predominance of vertically oriented patterns, showed that the magnitude of the angles increased in vertically dense pattern of the rectangular lattice. In the Region III, on the other hand, with the predominance of horizontal patterns, the majority of orientation angles fell between −30° and 30°. The results for Regions I–III strongly suggested that the local pattern anisotropy can guide cell movement along a preferred direction, even if the mechanical cues are present in the form of a lattice. On the other hand, a symmetric lattice can provide cells with conflicting cues, pointing in orthogonal directions, which then can lead to cells averaging between the cues (orienting at 45° to each of the cues). This was further evidenced on the densely patterned symmetric lattice area (Region IV) where the peaks of the cell-orientation distributions again favored ±45° directions. These results supported the notion that a cell can integrate both locally dense and sparse substrate features, sensing the symmetry of the underlying substrate or lack thereof, and orienting themselves accordingly.
Figure 4.
Angular distribution of cell orientation for the four regions with different topographic density. Heavier sectors on angular distribution indicate higher percentage of the cells orientated in the particular range of the direction (n = 53 for each group).
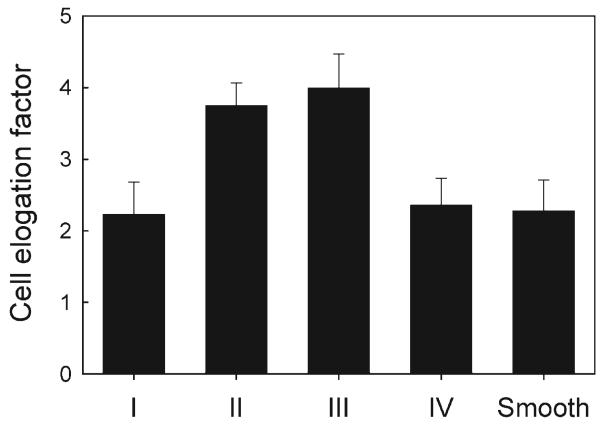
The elongation factor calculated for each cell was employed to determine morphological changes reflected in changes of cell polarization as a function of the topographical properties of the substratum. We found high values of elongation factors in the Regions II and III, whereas cells in the Regions I and IV displayed similar elongation factors to those of the cells on a flat continuous surface (Fig. 5). These results suggested that local pattern anisotropy rather than density is likely responsible for the extent of cell elongation. Since the distributions of the polarization angles in Regions I and IV were skewed diagonally into the left and right upper quadrant, it was possible that cells in these regions were continuously switching direction of spreading and migration and thus tended to spread out more evenly rather than having preference for horizontal or vertical elongation (Regions II and III).
Figure 5.
Effect of the density variation of square lattice arrays on cell elongation. Elongation factor is defined as (major axis)/(minor axis) – 1 (elongation factor of 1 is for a perfect circle). Error bar represents mean standard error of the mean (s.e.m.) of 20–25 cells for each group counted.
To further investigate whether the direction of cell movement was also guided by pattern density and anisotropy variations in 2D, we analyzed the angle of displacement vector from two consecutive time-lapse images with respect to the horizontal direction, as previously described.[24] This distribution was dependent on the local topographic patterns, demonstrating that cells indeed, on average, migrated along preferred directions following their attachments to the patterned substrate (Fig. 6a). Our results confirmed the expectations that the short-term cell dynamics are affected by the details of the underlying structure, with cell displacement preferentially directed on patterns of higher anisotropy (Regions II and III). On symmetric patterns of different densities, on the other hand, the short-term cell displacement was apparently random.
Figure 6.
Topography gradient-induced change in cell migration. a) Angular distribution of cell movement direction for four different regions of different pattern densities. b) Analysis on the migration speed of cells with specific directional cues existing in each region. A high Vy is shown in Region II while Region III displays an increase in Vx. Error bars represent mean ± s.e.m of 20–25 cells for each group counted.
Next we analyzed the horizontal and vertical velocity components of Vx and Vy. As the pattern anisotropy was shown to influence cell morphology, orientation, and short-term dynamics, we reasoned that the same mechanosensitivity would affect the rate of migration by adjusting cell shape and alignment with the underlying patterns to control cell movement. The cell migration speed characteristics for four Regions I–IV are illustrated in Figure 6b. The analysis of the velocity indicated that the horizontal component Vx increased in Region III, likely affected by local anisotropy in the horizontal direction. Conversely, vertically anisotropic pattern of Region II exhibited the highest Vy and the lowest Vx. The two velocity components were approximately equal in the symmetric pattern regions (Regions II and III), with the speed showing no dependence on the pattern density. The overall directional migration velocity with positive sign strongly suggested that the cells moved toward high-density gradients, in both horizontal and vertical directions. The dramatically decreased cell velocities observed in the smooth area raised the possibility that once cells have reached the target zone, they may be prevented from escaping from it back onto the patterned region, thus being coaxed by the pattern details to remain and aggregate in the central area. In summary, the motility of the cell was highly dependent on the local variation of topographic guidance cues, particularly the local pattern anisotropy. Overall, these results suggested that topographical gradient in extracellular environment not only could provide cues for cell to elongation and migration but also controlled cell velocity, directing cell movement toward higher pattern densities.
It is well established that parallel micro- and nanoscale ridges can elicit contact guidance but the underlying mechanism mediating contact guidance in generating polarization of cell movement remains unclear. Furthermore, the crucial parameters in topographic characteristics determining cell migration are largely unknown. Previous studies suggested that substrate micro- and nanotopography could influence the organization and regulation of focal adhesions.[25,26] Focal adhesions are large, dynamic protein complexes through which the cytoskeleton of a cell connects to the ECM.[27] The dynamic assembly and disassembly of focal adhesions also plays a central role in cell migration.[28] During migration, localized actin polymerization in the front of the cell provides a pivotal driving force for lamellopodia extension.
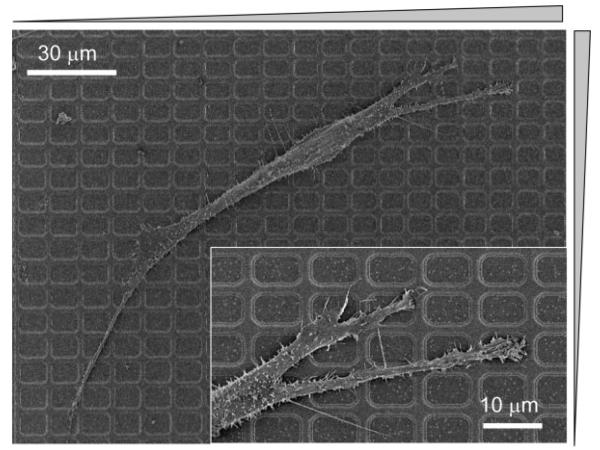
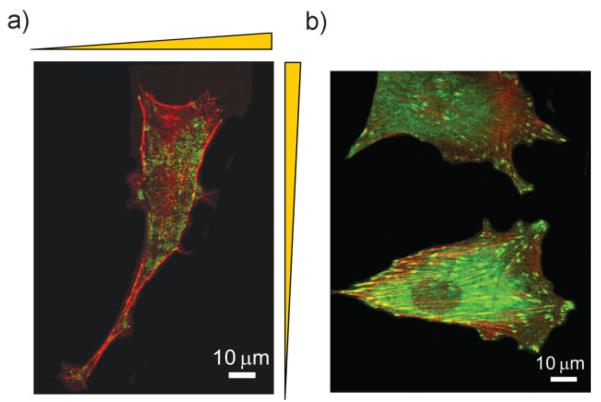
We thus investigated whether the formation of stable focal adhesions and the cytoskeleton remodeling is sensitive to topographic pattern density. The scanning electron microscopy (SEM) analysis showed that cells on the square lattice pattern of symmetric pattern regions (Region I or Region IV) polarized largely toward the denser lattice region (Fig. 7) and extended lamellipodia at the cells' leading edges along individual ridges (Fig. 7, inset). Cells often aligned their actin stress fibers and focal adhesions along the direction diagonal to the lattice (Fig. 8a) in these regions. On the other hand, cells aligned their actin stress fibers along the direction of denser ridges, established focal contacts proximal to denser ridges, and extended lamellipodia preferentially along more densely spaced ridges on either vertically (Region II) or horizontally (Region III) dense arrays of the ridges (data not shown). Cells that moved into the central smooth area became more rounded with flattened lamellipodia and randomly distributed focal adhesions (Fig. 8b). These results suggested that focal adhesions preferentially formed or stabilized on the denser local areas of the latticed pattern, possibly due to higher local rigidity of the pattern, which might direct cell extension and velocity towards the denser patterns zones and ultimately unpatterned target zones.
Figure 7.
Representative SEM image for the morphology of cells adhered to the square lattice pattern arrays of different local densities (Region II). A magnified image at the migrating edge is shown in the inset.
Figure 8.
Immunofluorescent images of a) polarized cell morphology with elongated lamellipodia toward the denser array of the ridges from Region II and b) rounded cell morphology with the flattened lamellipodia on the central smooth area. Cells are stained for vinculin in green and actin in red.
2.3. Guided Cell Organization Using the Topographically Patterned Substrate with Graded Density and Anisotropy
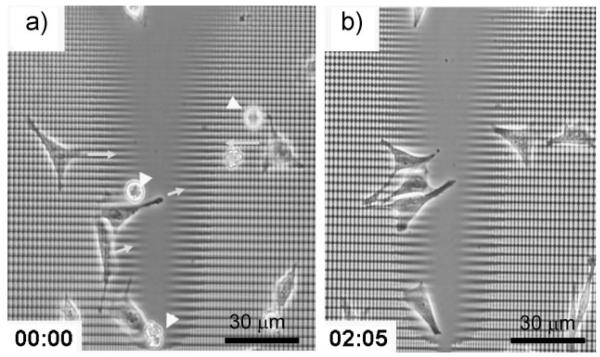
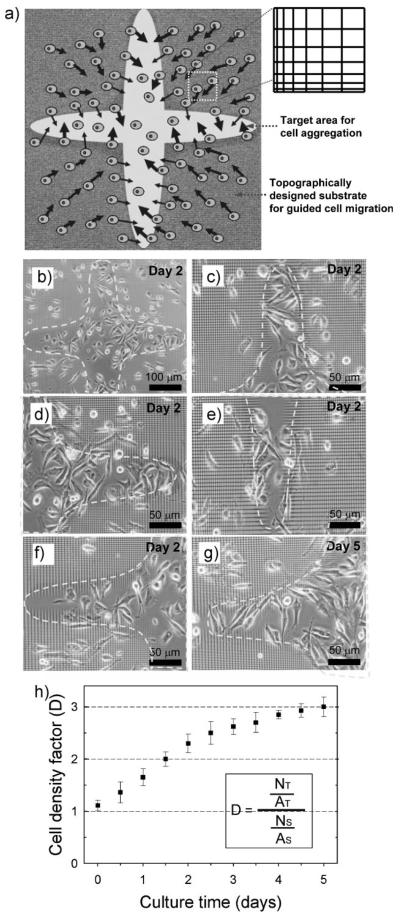
Based on our quantitative analysis of polarization of cell morphology and movement, we hypothesized that it would be possible to use delicate variation in the local density and anisotropy of the underlying substrate topography and effectively direct cell migration toward the central smooth surfaces to ultimately form cell aggregates. To test this, we cultured NIH 3T3 fibroblasts at the initial density of 5 × 10⁴ cells mL−1 for up to 5 days. We observed that cells on the topographically patterned areas of graded lattice arrays indeed migrated preferentially toward and accumulated at the target round cross-shaped zone. A typical example of cell migration at high magnification is shown in Figure 9 over a time span of ≈2 h. This strongly suggests a simple aggregation strategy, that is, that systematic variation of local densities of a 2D patterned substrate can give rise to a planar assembly of cells into a specified location (Fig. 10a). To quantitatively analyze this self-assembly, we introduce here the cell density factor (D), which is defined as the ratio of the total number of cells in the target area (NT) to the total number of cells in the surrounding topographically patterned areas (NS), expressed per unit area of both regions by dividing the area of target space (AT) and the area of surrounding (AS), respectively. Guided cell migration on the entire sample area as well as on some specific branch zones is demonstrated in Figure 10b−f. Over the 5-day culture, cells slowly migrated to the target round cross-shaped zone that was indicated as the yellow boundary (Fig. 10g). The organized cell migration and accumulation was evaluated during cell culture, as shown in Figure 10h. The results suggested that around day 4 of culture under these conditions, D started approaching a plateau around D = 3 from the initial value of D = 1, indicating that the overall cell accumulation indeed occurred but might ultimately be counteracted by the inherent randomness of cell movement allowing a certain degree of cell escape from the target zone. Overall, our results suggested that a tailored biomaterials interface can induce a planar assembly of cells in a spatially desired pattern, which could be of potential use in cell-sheet engineering of functional tissues.[29,30]
Figure 9.
An example of time-lapse images of cell migration toward the central target area. a) Phase-contrast micrograph of cells adhered onto the topographically gradient lattice pattern moving toward the central target area. b) Another snapshot image at the same location after two hours and five minutes. Yellow arrows indicate the direction of cell migration and white arrow heads indicate cells which are not adhered to the substrate yet at the initial time point of imaging.
Figure 10.
Topography-induced cell migration to the target area (rounded cross area in the center). a) The strategy for cell aggregation inside the 2D target area by using topographically tailored substrate. b) Cell distribution on a large area at day 2 after seeding. c–f) Spatial distribution of cells at several branch regions of the target space at day 2 after seeding. g) Spatial distribution of cells at the same location of (f) at day 5 after seeding. h) Time-dependent change in the cell density factor (D) in the central target area over a culture for 5 day after seeding. Data from 3 independent experiments were analyzed. Error bar represents mean ± s.e.m.
3. Conclusions
In this report, we presented a 2D topographically patterned substrate of variable local densities and anisotropy in a single substrate as a novel platform for studying the organization and migration of adherent cells. The patterns were fabricated by UV-assisted capillary force lithography, which provides a simple and efficient way to construct micropatterns with controlled geometry over a large area. By using this cell-culture platform, contact guidance was evaluated through quantitative analysis of cell morphology and migration.
Our results strongly suggest that cells can recognize the variation of topographic pattern density, resulting in migration toward the denser area from their initial positions. The cell shape and velocity were closely related to the degree of the local anisotropy of the substrate, indicating that cells could integrate orthogonally directed mechanical cues on the scale comparable to that of the feature sizes of the in vivo ECM networks. These results further suggest that cells might be exquisitely sensitive to 2D and possibly 3D variations in the ECM density and anisotropy, responding by dynamically altering the direction their speed and orientation.
Furthermore, we showed that the micropatterned biomaterial cell substrata with graded changes in local density and pattern anisotropy can induce a large-scale organized cell migration and ultimate aggregation, allowing one to coax cells to migrate into a spatially desired location. Our findings therefore have potential to yield both fundamental knowledge of mechanical guidance of directed cell migration and the resulting control of tissue formation in spatially desired patterns that can be utilized in advanced tissue engineering. Furthermore, we envision that more sophisticated architectural design of cell substrate micro- and nanotopography, with systematic variation of other guidance cues (e.g., rigidity of materials[31,32]), could be also applicable to creating truly biomimetic surface interfaces in implantable biomedical devices, biomaterials, and tissue scaffolds for regenerative or tissue engineering.
4. Experimental
Fabrication of the PUA Mold
Silicon wafers were spin-coated with photoresist (Shipley, Marlborough, MA) and then patterned via electron-beam lithography (JBX-9300FS, JEOL). After photoresist development (MF320, Shipley), exposed silicon was deep reactive ion etched (STS ICP Etcher) to form arrays of submicrometer-scale ridges with near-vertical sidewalls. The remaining photoresist on silicon wafers was removed using an ashing process (BMR ICP PR Asher) and then diced into silicon masters for subsequent replica molding. To cast topographic micro- and nanopattern arrays, PUA was used as a mold material from the silicon master as previously described [20]. Briefly, the UV-curable PUA was drop-dispensed onto a silicon master and then a flexible and transparent polyethylene terephthalate (PET) film was brought into contact with the dropped PUA liquid. Subsequently, it was exposed to UV light (λ = 200–400 nm) for 30 s through the transparent backplane (dose = 100 mJ cm−2). After UV curing, the mold was peeled off from the master and additionally cured overnight to terminate the remaining active acrylate groups on the surface prior to use as a first replica. The resulting PUA mold used in the experiment was a thin sheet with a thickness of ≈50 μm.
Capillary Force Lithography for Fabricating Topographical Pattern Arrays
The topographic pattern arrays with a variable local density and anisotropy were fabricated onto the glass coverslip using UV-assisted capillary-molding techniques [23]. Prior to application of the PUA mold, the glass substrate was cleaned with isopropyl alcohol (IPA), thoroughly rinsed in distilled ionized water, and then dried in a stream of nitrogen. Subsequently, an adhesive agent (phosphoric acrylate: propylene glycol monomethyl ether acetate = 1:10, volume ratio) was spin-coated to form a thin layer (≈ 100 nm) for 30 s at 3000 rpm. A small amount of the same PUA precursor was drop-dispensed on the substrate and a PUA mold was directly placed onto the surface. The PUA precursor spontaneously filled the cavity of the mold by means of capillary action and was cured by exposure to UV light (λ = 250–400 nm) for ≈ 30 s through the transparent backplane (dose = 100 mJ cm−2). After curing, the mold was peeled off from the substrate using sharp tweezers.
Culture of Cells on Topographical Pattern Arrays
NIH 3T3 fibroblasts were cultured at 37°C and 5% CO2 in Dulbecco's modified Eagle's medium containing 2 mM L-glutamine, 50 U mL−1 penicillin, and 50μg mL−1 streptomycin with 10% fetal bovine serum (Invitrogen). The topographically patterned substrate was oxidized and sterilized using plasma treatment (Harrick) for 1 min. Fibronectin (10μg mL−1, BD Biosciences) was absorbed onto PUA pattern arrays within the culture dish for 1 h. Cells are seeded at 5 × 10⁴ cells mL−1 onto arrays of topographical pattern and cultured up to 5 days.
Immunofluorescence
NIH 3T3 fibroblasts were seeded onto the topographic pattern arrays, allowed to spread overnight for 14 h, fixed with 3.7% paraformaldehye solution for 15 min, washed, made permeable with 0.1% Triton X-100 in phosphate buffered saline (PBS) for 15 min, and then incubated for 1 h with Texas Red conjugated phalloidin (Invitrogen) and 4′,6-diamidino-2-phenylindole (DAPI, Sigma) to stain for actin filaments and cell nuclei, respectively. Cells were blocked using 10% goat serum in PBS for 1 h before incubated with a monoclonal mouse anti-vinculin antibody (Sigma) for 1 h. Stained cells were imaged using a Zeiss LSM 510 Meta CLSM under 100× and 63× plan apochromat objective lens 1.4 N.A. Images were processed using the Zeiss Meta software version 3.5.
Time-Lapse Mmicroscopy
For time-lapse analysis of individual cell movement, NIH 3T3 fibroblasts were cultured on the glass coverslip with topographical pattern arrays, which was previously glued onto the bottom surface of the custom-made Mattek dish (P35G-20-C). For long-term observation, the environmental chamber containing the custom-made Mattek dish integrated with topographically patterned substrate was mounted onto the stage of a motorized inverted microscope (Zeiss Axiovert 200M) equipped with a Cascade 512B II CCD camera. Phase-contrast images of the NIH 3T3 fibroblasts were automatically recorded with the SlideBook software (Intelligent Imaging Innovations, Inc.) for 12 hours at 15-minute intervals.
SEM
Cultured NIH 3T3 fibroblasts were washed with phosphate-buffered saline (PBS, pH 7.4, Gibco Invitrogen) and fixed in 3% glutaraldehyde (Sigma) in PBS for 1 h. After fixation, samples were rinsed in 0.1 M sodium cacodylate for thirty minutes at 4 °C. They were then post-fixed in 2% osmium tetroxide for 1 h at the same temperature. After a brief D-H2O rinse, samples were en-bloc stained in 2% aqueous uranyl acetate (0.22 μm filtered) for 1 h at room temperature in the dark. Following a graded ethanol dehydration cells were critical point dried with liquid CO2, mounted onto SEM stubs with double-stick carbon tape, and sputter coated with 10-nm gold palladium. Samples were viewed and photographed with a LEO FESEM 1530 operating at 1 kV.
AFM
AFM measurements were performed using a commercial AFM (Surface Imaging Systems, NANOstation). Measurements were performed in noncontact mode. The scan rate was 0.7 line s−1 1 and oscillation frequency was 182 Hz. Data were processed using Surface Probe Image Processor software (Surface Imaging Systems).
Quantification of Cell Orientation and Elongation
For quantitative analysis of cell orientation and elongation, we cultured NIH 3T3 fibroblasts on 2D square lattice arrays for 14 hours and then stained the cells for Factin. Fluorescent images were subsequently taken and each picture was analyzed using SlideBook software. The 15–20 images with 1–5 cells per image were then examined to identify cell morphology. The cell elongation factor was defined as the ratio of the major and minor axes which are the longest and the shortest length of the cell, respectively. Using the SlideBook algorithms, we measured the maximum and minimum cell diameters between two edges within the cell, not necessarily perpendicular to each other. This ratio was then subtracted by 1 to demonstrate a deviation of cellular shape from a perfect circle. We performed elongation analysis on 20–25 cells for sample group of the four regions. The orientation angle of polarized cell was determined by measuring the acute angle stretching the line of major axis of the cell with respect to the direction of underlying ridges. The longest aspect of the cell was traced by connecting two coordinates on the major axis acquired by using SlideBook and another point to find an acute angle. A total of 212 cells were used to measure the polarization angle distributions ranging between −90° and 90° while positive and negative are defined to be in the counter clockwise and clockwise directions, respectively. An angle of 0° was measured when cells were perfectly aligned parallel to the horizontal ridges. The angle of orientation on the control smooth surface was measured with respect to an arbitrary direction, ensuring share of the same baseline for consistent measurements.
Quantification of Cell Movement
To determine the directionality of cell movement, the instantaneous change in migration direction of cells in each region was found, and the distribution of 300 step angles (i.e., for two different time steps in migration of a single cell) in each region was plotted ranging from 0° and 360°. The angle between cell orientations in these steps was calculated by applying the four-quadrant inverse tangent function to component vectors of displacement for two consecutive images. The speeds from the mean squared displacement were computed and averaged for a 7-hour period to evaluate the migration speed. Cells that attached to adjacent cells were removed from the datasets since cell-cell contact is known to affect cell spreading and migration. Similarly, the vector components of velocity in the horizontal (Vx) and vertical directions (Vy) were found separately on four characteristic regions on the 2D square lattice pattern. The sign change due to directional cues was defined by the local pattern density on substrate, such that a positive sign represents cells moving toward the densely patterned regions. The number of cells from 20 to 25 in each region was employed to determine the speed of migratory cells.
Acknowledgements
We gratefully acknowledge support from the Center for Nanoscale Mechatronics & Manufacturing (08K1401-00210), one of the 21st Century Frontier Research Programs in Korea and the Micro Thermal System Research Center of Seoul National University. This work was also partially supported by the National Institutes of Health (1R21EB008562-01A1).
Footnotes
D.-H. K. and C.-H. S. equally contributed to this work.
This article appears as part of a special issue on materials science in Korea.
References
- 1.Ma PX. Adv. Drug Delivery Rev. 2008;60:184. doi: 10.1016/j.addr.2007.08.041. [DOI] [PMC free article] [PubMed] [Google Scholar]
- 2.Hahn MS, Miller JS, West JL. Adv. Mater. 2006;18:2679. [Google Scholar]
- 3.Ingber DE, Mow VC, Butler D, Niklason L, Huard J, Mao J, Yannas I, Kaplan D, Vunjak-Novakovic G. Tissue Eng. 2006;12:3265. doi: 10.1089/ten.2006.12.3265. [DOI] [PubMed] [Google Scholar]
- 4.Venkatesh S, Byrne ME, Peppas NA, Hilt JZ. Expert Opin. Drug Delivery. 2005;2:1085. doi: 10.1517/17425247.2.6.1085. [DOI] [PubMed] [Google Scholar]
- 5.Zong X, Bien H, Chung CY, Yin L, Fang D, Hsiao BS, Chu B, Entcheva E. Biomaterials. 2005;26:5330. doi: 10.1016/j.biomaterials.2005.01.052. [DOI] [PubMed] [Google Scholar]
- 6.Lutolf MP, Hubbell JA. Nat. Biotechnol. 2005;23:47. doi: 10.1038/nbt1055. [DOI] [PubMed] [Google Scholar]
- 7.Martins A, Araujo JV, Reis RL, Neves NM. Nanomed. 2007;2:929. doi: 10.2217/17435889.2.6.929. [DOI] [PubMed] [Google Scholar]
- 8.Moroni L, Schotel R, Hamann D, de Wijn JR, van Blitterswijk CA. Adv. Funct. Mater. 2008;18:53. [Google Scholar]
- 9.Gadegaard N, Dalby MJ, Riehle MO, Curtis ASG, Affrossman S. Adv. Mater. 2004;16:1857. [Google Scholar]
- 10.Michel R, Reviakine I, Sutherland D, Fokas C, Csucs G, Danuser G, Spencer N, Textor M. Langmuir. 2002;18:8580. [Google Scholar]
- 11.Yi DK, Kim MJ, Turner L, Breuer KS, Kim DY. Biotechnol. Lett. 2006;28:169. doi: 10.1007/s10529-005-5331-8. [DOI] [PubMed] [Google Scholar]
- 12.Dalby MJ, Riehle MO, Johnstone HJ, Affrossman S, Curtis AS. Tissue Eng. 2002;8:1099. doi: 10.1089/107632702320934191. [DOI] [PubMed] [Google Scholar]
- 13.Yim EK, Reano RM, Pang SW, Yee AF, Chen CS, Leong KW. Biomaterials. 2005;26:5405. doi: 10.1016/j.biomaterials.2005.01.058. [DOI] [PMC free article] [PubMed] [Google Scholar]
- 14.Lee K, Park S, Mirkin C, Smith J, Mrksich M. Science. 2002;295:1702. doi: 10.1126/science.1067172. [DOI] [PubMed] [Google Scholar]
- 15.Karuri NW, Liliensiek S, Teixeira AI, Abrams G, Campbell S, Nealey PF, Murphy CJ. J. Cell Sci. 2004;117:3153. doi: 10.1242/jcs.01146. [DOI] [PMC free article] [PubMed] [Google Scholar]
- 16.Kaiser JP, Reinmann A, Bruinink A. Biomaterials. 2006;27:5230. doi: 10.1016/j.biomaterials.2006.06.002. [DOI] [PubMed] [Google Scholar]
- 17.Liliensiek SJ, Campbell S, Nealey PF, Murphy CJ. J. Biomed. Mater. Res. Part A. 2006;79:185. doi: 10.1002/jbm.a.30744. [DOI] [PMC free article] [PubMed] [Google Scholar]
- 18.Dalby MJ, Gadegaard N, Tare R, Andar A, Riehle MO, Herzyk P, Wilkinson CD, Oreffo RO. Nat. Mater. 2007;6:997. doi: 10.1038/nmat2013. [DOI] [PubMed] [Google Scholar]
- 19.Karuri NW, Porri TJ, Albrecht RM, Murphy CJ, Nealey PF. IEEE Trans. Nanobiosci. 2006;5:273. doi: 10.1109/tnb.2006.886570. [DOI] [PubMed] [Google Scholar]
- 20.Kim D, Kim P, Song I, Cha J, Lee S, Kim B, Suh K. Langmuir. 2006;22:5419. doi: 10.1021/la060283u. [DOI] [PubMed] [Google Scholar]
- 21.Lauffenburger DA, Horwitz AF. Cell. 1996;84:359. doi: 10.1016/s0092-8674(00)81280-5. [DOI] [PubMed] [Google Scholar]
- 22.Kumar G, Ho CC, Co CC. Adv. Mater. 2007;19:1084. [Google Scholar]
- 23.Kim P, Kim D, Kim B, Choi S, Lee S, Khademhosseini A, Langer R, Suh K. Nanotechnology. 2005;16:2420. doi: 10.1088/0957-4484/16/10/072. [DOI] [PubMed] [Google Scholar]
- 24.Saez A, Ghibaudo M, Buguin A, Silberzan P, Ladoux B. Proc. Natl. Acad. Sci. USA. 2007;104:8281. doi: 10.1073/pnas.0702259104. [DOI] [PMC free article] [PubMed] [Google Scholar]
- 25.Dalby MJ, Riehle MO, Sutherland DS, Agheli H, Curtis AS. Eur. J. Cell Biol. 2004;83:159. doi: 10.1078/0171-9335-00369. [DOI] [PubMed] [Google Scholar]
- 26.Teixeira AI, Abrams GA, Bertics PJ, Murphy CJ, Nealey PF. J. Cell Sci. 2003;116:1881. doi: 10.1242/jcs.00383. [DOI] [PMC free article] [PubMed] [Google Scholar]
- 27.Geiger B, Bershadsky A. Curr. Opin. Cell Biol. 2001;13:584. doi: 10.1016/s0955-0674(00)00255-6. [DOI] [PubMed] [Google Scholar]
- 28.Gupton S, Waterman-Storer C. Cell. 2006;125:1361. doi: 10.1016/j.cell.2006.05.029. [DOI] [PubMed] [Google Scholar]
- 29.Isenberg BC, Tsuda Y, Williams C, Shimizu T, Yamato M, Okano T, Wong JY. Biomaterials. 2008;29:2565. doi: 10.1016/j.biomaterials.2008.02.023. [DOI] [PMC free article] [PubMed] [Google Scholar]
- 30.Harimoto M, Yamato M, Kikuchi A, Okano T. Macromol. Symp. 2003;195:231. [Google Scholar]
- 31.Ren KF, Crouzier T, Roy C, Picart C. Adv. Funct. Mater. 2008;18:1378. doi: 10.1002/adfm.200701297. [DOI] [PMC free article] [PubMed] [Google Scholar]
- 32.Zaari N, Rajagopalan P, Kim S, Engler A, Wong J. Adv. Mater. 2004;16:2133. [Google Scholar]


