

Abstract
Purpose:
Extrafocal structural abnormalities have been consistently described in temporal lobe epilepsy (TLE) with mesial temporal lobe sclerosis (TLE-MTS). In TLE without MTS (TLE-no) extrafocal abnormalities are more subtle and often require region of interest analyses for their detection. Cortical thickness measurements might be better suited to detect such subtle abnormalities than conventional whole brain volumetric techniques which are often negative in TLE-no. The aim of this study was to seek and characterize patterns of cortical thinning in TLE-MTS and TLE-no.
Methods:
T1 weighted whole brain images were acquired on a 4T magnet in 66 subjects (35 controls, 15 TLE-MTS, 16 TLE-no). Cortical thickness measurements were obtained using the FreeSurfer software routine. Group comparisons and correlation analyses were done using the statistical routine of FreeSurfer (FDR, p = 0.05).
Results:
TLE-MTS and TLE-no showed both widespread temporal and extratemporal cortical thinning. In TLE-MTS, the inferior medial and posterior temporal regions were most prominently affected while lateral temporal and opercular regions were more affected in TLE-no. The correlation analysis showed a significant correlation between the ipsilateral hippocampal volume and regions of thinning in TLE-MTS and between inferior temporal cortical thickness and thinning in extratemporal cortical regions in TLE-no.
Conclusion:
The pattern of thinning in TLE-no was different from the pattern in TLE-MTS. This finding suggests that different epileptogenic networks could be involved in TLE-MTS and TLE and further supports the hypothesis that TLE-MTS and TLE-no might represent two distinct TLE syndromes.
Keywords: Temporal lobe epilepsy, mesial temporal sclerosis, extratemporal, network, projections
1. Introduction
Temporal lobe epilepsy (TLE) is the most common form of partial epilepsy with a prevalence of 0.1% in the general population. Based on imaging and histopathological findings the following types of non-lesional TLE can be distinguished: TLE with mesial-temporal lobe sclerosis (TLE-MTS, about 60-70%), i.e. atrophied hippocampus with MR signal abnormalities and severe neuronal loss in the histological examination, and TLE with normal appearing hippocampus on the MRI (TLE-no, about 30-40%) and no or only mild neuronal loss in the histological examination. Depth EEG exams show a relatively circumscribed epileptogenic zone in the hippocampus in TLE-MTS and more widespread, less well defined epileptogenic areas in the medial – lateral temporal lobe in TLE-no (Vossler et al. 2004). In both types however, seizures are not restricted to the temporal lobe but can spread to other regions as well. Accordingly, structural abnormalities are not restricted to the epileptogenic focus. In TLE-MTS for example, structural abnormalities have also been described in the entorhinal cortex, the parahippocampal and fusiform gyrus, thalamus, basal ganglia and frontal and parietal lobe (Jutila et al., 2001; Coste et al., 2002; Moran et al., 2001; Desay et al.; 2000, Dreifuss et al., 2001; Hagemann et al., 2002; Keller et al., 2004; Mueller et. al 2007). These abnormalities can be pronounced and are often detectable on visual inspection (Kim et al 1995; Coste et al., 2002). In contrast, structural abnormalities in TLE-no tend to be more subtle and are often only detected by quantitative region of interest (ROI) approaches (Bernasconi et al., 2001; Bowers et al., 2003; Mueller et al., 2007).
Over the last few years several computational approaches for regionally unbiased whole brain cortical thickness measurements have been developed (Evans, 2005; Fischl and Dale, 2000; Thompson et al., 2005). Compared to traditional ROI analyses, these techniques have the advantage to assess the whole brain without requiring an a priori hypothesis regarding the localization of the abnormality. In addition to this, they are also less influenced by individual gyral variations than traditional voxel-based whole brain methods, e.g. voxel-based-morphometry (VBM). Recently, the first studies using cortical thickness measurements in TLE-MTS have been published showing a characteristic pattern of cortical thinning in the region of the superior frontal and precentral gyrus, operculum, inferior and medial temporal and occipital lobe (Lin et al., 2007; MacDonald et al., 2008; Bernhardt et al., 2008). In this study we used cortical thickness measurements as provided by the FreeSurfer software routine with the following aims 1. To identify regions of cortical gray matter thinning beyond the hippocampus in TLE-MTS and to confirm the typical pattern of cortical thinning in TLE-MTS described by previous studies. Based on EEG and structural findings in TLE-MTS (Vossler et al., 2004; Mueller et al., 2006), we expected to find neocortical thinning in regions receiving hippocampal projections. 2. To identify regions of cortical thinning in TLE-no. We expected extrafocal thinning in TLE-no to affect neocortical regions in the inferior medial temporal lobe (Carne et al., 2007; Vossler et al., 2004; Mueller et al 2007) and regions receiving projections from these regions, i.e., to show a different distribution than the one found in TLE-MTS.
2. Methods
2.1 Study Population
The committees of human research at the University of California, San Francisco (UCSF), California Pacific Medical Center, San Francisco and VA Medical Center, San Francisco approved the study, and written informed consent was obtained from each subject according to the Declaration of Helsinki. Thirty-one consecutive TLE patients undergoing evaluation for epilepsy surgery were recruited between mid 2005 and end of 2007 from the Pacific Epilepsy Program, California Pacific Medical Center and the Northern California Comprehensive Epilepsy Center, UCSF. Fifteen patients (mean age 41.3 ± 10.4; left TLE/right TLE: 9/6, females/males 10/5) had evidence for mesial temporal lobe sclerosis on their 1.5 T MRI images (TLE-MTS) and 16 patients (mean age 37.8 ± 9.9; left TLE/right TLE: 8/8; females/males: 8/8) had normal appearing hippocampi (TLE-no) and normal MR reads at 1.5 T. So far, seven TLE-MTS and three TLE-no have had surgery and histopathological examination confirmed the presence (TLE-MTS), and absence (TLE-no) respectively of mesial temporal lobe sclerosis in all these patients. Age at onset of epilepsy was different between the two groups (TLE-MTS: 8.7±6.9 years; TLE-no: 21.1±9.2 years, p<0.001) as was duration of epilepsy (TLE-MTS: 31.5±12.4 years; TLE-no: 14.7±8.3 years; p<0.001). The identification of the epileptogenic focus was based on seizure semiology and prolonged ictal and interictal Video/EEG/Telemetry (VET) in all patients. The control population consisted of 35 healthy volunteers (mean age 37.9 ± 9.3; females/males: 23/12). Table 1 displays the Patient Characteristics
Table 1.
Patient characteristics
| Patient no. | Age | Gender | Ictal VET | Precipitating Event/Risk Factors |
Age at Onset of Seizures |
1.5 T clinical MRI |
|---|---|---|---|---|---|---|
| 1 | 46 | Male | L mesial temporal |
No | 3 | L MTS |
| 2 | 35 | Male | L mesial temporal |
No | 4 | L MTS |
| 3 | 50 | Female | L mesial temporal |
Febrile seizures | 2 | L MTS |
| 4 | 24 | Female | L mesial temporal |
No | 13 | L MTS |
| 5 | 35 | Female | L mesial temporal |
No | 9 | L MTS |
| 6 | 54 | Male | L mesial temporal |
No | 50 | L MTS |
| 7 | 44 | Male | L mesial temporal |
No | 28 | L MTS |
| 8 | 48 | Female | L mesial temporal |
No | 13 | bil MTS |
| 9 | 38 | Female | L mesial temporal |
Febrile seizures | 6 | bil MTS |
| 10 | 46 | Female | R mesial temporal |
Post traumatic | 6 | R MTS |
| 11 | 28 | Female | R mesial temporal |
Febrile seizures | 13 | R MTS |
| 12 | 49 | Female | R mesial temporal |
No | 7 | R MTS |
| 13 | 23 | Female | R mesial temporal |
Infection | 5 | R MTS |
| 14 | 43 | Male | R mesial temporal |
No | 5 | R MTS |
| 15 | 56 | Female | R mesial temporal |
No | 12 | R MTS |
| 16 | 16 | Male | L mesial temporal |
No | 14 | Normal |
| 17 | 27 | Female | L mesial temporal |
No | 10 | Normal |
| 18 | 33 | Female | L mesial temporal |
No | 10 | Normal |
| 19 | 35 | Female | L mesial temporal |
No | 32 | Normal |
| 20 | 42 | Female | L mesial temporal |
No | 21 | Normal |
| 21 | 38 | Female | L mesial temporal |
Post traumatic | 37 | Normal |
| 22 | 33 | Female | L mesial temporal |
No | 22 | Normal |
| 23 | 51 | Male | L mesial temporal |
No | 18 | Normal |
| 24 | 29 | Male | R mesial temporal |
No | 11 | Normal |
| 25 | 43 | Female | R mesial temporal |
Birth complications | 20 | Normal |
| 26 | 45 | Female | R mesial temporal |
No | 31 | Normal |
| 27 | 33 | Male | R mesial temporal |
No | 23 | Normal |
| 28 | 45 | Male | R mesial temporal |
Post traumatic | 30 | Normal |
| 29 | 39 | Male | R mesial temporal |
No | 13 | Normal |
| 30 | 56 | Male | R mesial temporal |
Post traumatic | 49 | Normal |
| 31 | 41 | Male | R mesial temporal |
Post traumatic | 40 | Normal |
R, right; L, Left; MTS, mesial temporal sclerosis; No, none; Post traumatic, head trauma in history without temporal relationship to onset of seizures; infection, history of meningitis or encephalitis.
2.2. MRI Acquisition
All imaging was performed on a Bruker MedSpec 4T system controlled by a Siemens Trio™ console and equipped with a USA instruments eight channel array coil that consisted of a separate transmit coil enclosing the eight receiver coils. The following sequence, which was part of a larger research imaging and spectroscopy protocol, was acquired for cortical thickness measurements: volumetric T1-weighted gradient echo MRI (MPRAGE) TR/TE/TI = 2300/3/950 ms, 7° flip angle, 1.0 × 1.0 × 1.0 mm3 resolution, acquisition time 5.17 min.
2.3. Cortical Thickness Measurement
All T1 images were segmented in EMS (van Leemput et al., 1999 a, b). The bias field maps and tissue maps obtained during this process were used for bias correction and skull stripping of the T1 image. To allow for a combination of left and right TLE in the analysis, the T1 images of all patients with right TLE were side flipped so that the focus was on the left side in all subjects. The same was done with all control images. FreeSurfer (version 3.05, https://surfer.nmr.mgh.harvard.edu) was used for cortical surface reconstruction and cortical thickness estimation of the original (controls and left TLE) and side-flipped (controls and right TLE) images. The procedure has been extensively described elsewhere (Fischl et al., 1999a,b; Fischl and Dale, 2000; Fischl et al.,, 2001; Fischl et al., 2002; Fischl et al., 2004 a,b; Dale et al., 1999; Segonne et al., 2005) To summarize it briefly: A preliminary segmentation of white matter was obtained using a connected components algorithm. Subcortical structures, e.g. basal ganglia, thalamus, amygdala, hippocampus and ventricles etc. were labeled using a probabilistic atlas and Bayesian classification rule for label assignment. The brain was divided into the two hemispheres and interior holes in the white matter region (ventricles, white matter lesion, lacunes) were filled to obtain a single white matter volume for each hemisphere which was then covered with a polygonal tessellation and smoothed to reduce metric distortions. The obtained surface was inflated and topological defects were automatically corrected. In the next step the gray-white matter boundary was re-constructed by segmenting all white matter voxels in the MRI and the resulting white matter surface refined to obtain sub millimeter accuracy in delineating the gray/white matter surface. This surface was then outward deformed to identify the gray-csf boundary. The cortical thickness at each vertex across the cortical mantle was defined by calculating the average of a. the shortest distance between the gray-white boundary and the gray-csf boundary and b. the shortest distance between the gray-csf boundary and the gray-white boundary at each vertex on the tessellated surface. After this step, the data was visually inspected by raters unaware of the clinical diagnosis and, if necessary, errors due to segmentation miss-classification manually corrected and re-processed. An automatic parcellation technique was used to subdivide each hemisphere into 34 gyral labels (Desikan et al., 2006), cf Figure 1.
Figure 1.
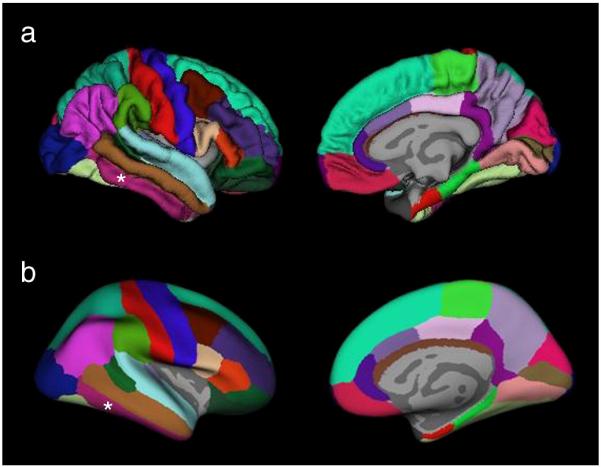
Regional labeling of neocortical structures as provided by Freesurfer (Desikan et. al, 2006). Medial and lateral view of A. Normal brain. B. Inflated brain. The region labeled as inferior temporal gyrus which was used for the correlation analyses is indicated by *.
Each subject's inflated brain was then morphed onto a project specific average spherical representation (average of original and side flipped control data, left TLE data and side-flipped right TLE data) using a non rigid high resolution surface based averaging method for an optimal alignment of the cortical folding patterns. The data was smoothed with a 20 mm full width half maximum Gaussian kernel to improve the signal to noise ratio. This relatively large kernel was chosen because we expected regions of cortical thinning to be subtle and widespread, i.e. not restricted to a single gyrus.
2.4. Statistics
2.4.1. Group Comparisons
Differences in cortical thickness between controls and TLE-MTS (reduced thickness in TLE-MTS), controls and TLE-no (reduced thickness in TLE-no), and TLE-MTS with TLE-no were tested in a regionally unbiased way by computing a general linear model of the effect of “group” on thickness at each vertex using the statistical tool provided by FreeSurfer. A False Discovery Rate (FDR) of p ≤ 0.05 was applied to correct for multiple comparisons.
2.4.2. Correlation Analyses
Structural correlation analyses have been proposed as a mean to study non invasively the connectivity between different brain areas (Lerch et al., 2006, Bernhardt et al., 2008). This approach assumes that processes leading to neuron loss and consequently volume loss/cortical thinning in one region (primary region) will result in a proportional volume loss/thinning in synaptically connected regions (target region), i.e. regions receiving projections from the first area due to associated loss of afferent fibers/neuropil and/or local neuron loss. As a consequence the correlation of volumetric measures between the primary region and target regions will be essentially unchanged in each subgroup (correlation co-efficient in TLE not significant different from correlation coefficient in controls) but will increase in populations containing both subgroups. In regions not synaptically connected to the primary region or epileptogenic focus, the correlation in the mixed population (TLE and controls) will not be different from the correlation in each subgroup. According to the a priori hypothesis about the localization of epileptogenic focus in TLE-MTS and TLE-no, a linear regression analysis was performed in which volume respectively cortical thickness in the presumed epileptogenic focus (volume of ipsilateral hippocampal for the correlation in TLE-MTS and controls, mean thickness of the inferior temporal gyrus for the correlation in TLE-no and controls (Carne et al., 2007; Mueller et al., 2007) was correlated with the thickness in the remaining cortex in TLE-MTS and controls, TLE-no and controls and controls alone. Age was modeled as a co-variate to correct for age-related volume loss, a FDR of p ≤ 0.05 was applied to correct for multiple comparisons. Significant positive correlations outside the region of the presumed focus were interpreted as evidence for a structural connectivity between the focus and extrafocal regions. To test the above made assumption that the correlation of the presumed epileptogenic focus and extrafocal cortical thickness in synaptically connected regions are not different between subgroups, a second linear regression analysis was performed. In this analysis, cortical thickness was modeled as function of ipsilateral hippocampal volume/mean thickness of inferior temporal gyrus, group (control and TLE-MTS respectively control and TLE-no) and interaction of group with ipsilateral hippocampal volume/mean thickness of inferior temporal gyrus. In this test regions with significant effects for the interaction term were searched for, a FDR of p ≤ 0.05 was applied to correct for multiple comparisons.
3. Results
3.1. Group Comparisons
Figure 2 a. shows regions with significant regional thinning in TLE-MTS compared to controls. Regions of significant thinning were found in the ipsilateral entorhinal cortex, parahippocampus/fusiform gyrus, temporo-polar and anterior superior temporal region, retrosplenial region, posterior insula, middle frontal gyrus and parietal superior region and bilaterally in the pre/postcentral region, superior frontal, transversal temporal, precuneus and occipital prestriate region. Figure 2 b. displays regions with significant cortical thinning in TLE-no compared to controls. Regions of significant thinning were found in the fusiform, inferior and middle temporal gyrus, opercular and anterior insular region, middle (rostral) and superior frontal and pre/postcentral region bilaterally, in the ipsilateral posterior superior temporal gyrus, medial and lateral orbitofrontal and lingual region and contralateral occipital pole and superior parietal region. Although most of the lobes showing cortical thinning were identical in TLE-MTS and TLE-no, the distribution of thinning within the lobes was different. In TLE-MTS the most pronounced thinning was found in ipsilateral temporal mesial and posterior regions (entorhinal cortex, fusiform gyrus, lingual gyrus) and lateral occipital lobe while in TLE-no the most pronounced thinning was found in ipsilateral anterior inferior and lateral temporal regions (inferior and middle temporal gyrus) and lateral frontal (operculum) and insular regions. However, there were no significant differences of cortical thickness in the direct comparison between TLE-MTS and TLE-no. When the threshold for significance was lowered to p ≤ 0.01 without correction for multiple comparisons, TLE-MTS had a more pronounced thinning in the ipsilateral lateral occipital region and TLE-no in contralateral inferior temporal and in bilateral rostral anterior cingulate and insular regions (cf Figure 2c).
Figure 2.

A. Regions with significant neocortical thinning in TLE-MTS compared to age matched controls. Please see text for details. B. Regions with significant neocortical thinning in TLE-no compared to age matched controls. C. Regions with significant thinning in TLE-MTS compared to TLE-no (blue) and significant thinning in TLE-no compared to TLE-MTS (red).
3.2. Correlation Analyses
Figure 3 a. shows regions with significant positive correlations between ipsilateral hippocampal volume and ipsilateral extrahippocampal cortical thickness in TLE-MTS and controls corrected for age. The pattern of significant correlations was very similar to the pattern of cortical thinning found in the direct comparison between TLE-MTS and controls although the extent of the clusters indicating significant correlations were smaller than those of indicating significant thinning. If the analysis was restricted to the control group, none of the correlations between hippocampal volume and cortical thickness reached significance (data not shown). There was also no significant effect for the interaction term (group × ipsilateral hippocampal volume) indicating that TLE-MTS and controls do not differ regarding the correlation hippocampal volume with cortical thickness. Figure 3b shows regions with significant positive correlations between ipsilateral mean thickness of the inferior temporal gyrus and extratemporal cortical thickness in TLE-no and controls. Again, the distribution of significant correlations is very similar to the pattern of thinning found in the direct comparison between TLE-no and controls although in this case the clusters indicating significant correlation were larger than those indicating significant thinning. If the analysis was restricted to the control group, significant correlations were restricted to the region of the inferior temporal gyrus (data not shown). There was no significant effect for the interaction term (group × mean inferior temporal gyrus thickness) indicating that that the correlation between mean inferior temporal gyrus thickness and extratemporal cortical thickness is not different between TLE-no and controls.
Figure 3.

a. Regions with significant positive correlations between ipsilateral hippocampal volume and ipsilateral cortical thickness in TLE-MTS and controls. b, Regions with significant positive correlations between ipsilateral mean inferior temporal gyral thickness and cortical thickness beyond the temporal lobe. Regions with the most significant correlations show a good concordance with regions with maximal cortical thinning in the direct comparisons TLE-MTS with controls (Figure 2a) and TLE-no with controls (Figure 2 b).
4. Discussion
There were two major findings in this study. 1. TLE-MTS was associated with prominent cortical thinning in ipsilateral medial posterior temporal and lateral prestriatal structures, additional regions with less severe cortical thinning were found in superior frontal, pre/postcentral and superior temporal regions bilaterally. The correspondence between the direct group comparison and the correlation analysis with the ipsilateral hippocampal volume supports the hypothesis that these regions are synaptically connected to the presumed epileptogenic focus in the hippocampal formation. 2. TLE-no was associated with prominent cortical thinning in ipsilateral anterior inferior, lateral and superior temporal, opercular and insular regions. Less prominent cortical thinning was also found in superior frontal regions and pre/postcentral regions bilaterally. The correlation analysis supports the hypothesis that these regions are synaptically connected to the presumed epileptogenic focus in the ipsilateral inferior – lateral temporal region. Taken together, these findings show that TLE-MTS and TLE-no have both extensive extrahippocampal and extratemporal cortical thinning. The regions with extrahippocampal thinning differ in extent and distribution which suggests the involvement of two different cortical networks in TLE-MTS and TLE-no.
4.1. Methodological Considerations
4.1.1. Limitations of the study
This study has several limitations. One of the most important is that the EEG focus localization was based on ictal and interictal scalp recordings alone. While this is often sufficient in TLE-MTS with well–lateralized EEG and concordant imaging findings, accurate focus localization in TLE-no usually requires intracranial recordings. Another limitation is that the majority of patients have not had surgery yet and thus the 1.5T MRI diagnosis regarding presence or absence of a hippocampal sclerosis could not be confirmed histopathologically. The 1.5T assessment however was in good agreement with the findings of a special 4T hippocampal high resolution MRI and hippocampal volumetry which was available for all subjects in the study population. Nonetheless, we cannot completely exclude that some of the TLE-no patients had mild hippocampal sclerosis not detected by MRI. It is also important to mention that the relatively small sample size made it necessary to pool left and right sided TLE patients for the analysis by side-flipping the data of the right sided patients. Therefore, we were not able to address the issue of differences of extrahippocampal differences between left and right TLE which have been described by other studies (Bernhardt et al. 2008; Riederer et al. 2008). Furthermore, we also cannot exclude that we missed regions with more subtle thinning because of the side-flipping. In order to further investigate this issue, we also performed the analysis in each of the subgroups, e.g. in. left TLE-MTS or right TLE-no. If no correction for multiple comparisons was applied, the pattern of thinning found in these analyses (data not shown) was very similar to the pattern in the pooled groups. Therefore, we do not think that the pooling had a significant effect on the findings. Finally, in contrast to other studies (McDonald et al. 2000) we did not attempt to correlate the degree and extent of thinning with clinical measures of disease severity. The most commonly used parameter for such analyses is duration of epilepsy. However, its value as measure for severity is limited because it takes neither the number nor the type (partial vs. secondary generalized) of seizures experienced during this time into account. Lifetime seizure count would be a better measure for disease severity. However this information can often not be reliably obtained and was not available for this study.
4.1.2. Confirmation of previous studies in TLE-MTS
TLE-MTS had regions of significant cortical thinning in ipsilateral inferior medial temporal, retrosplenial, occipital prestriatal, frontal and posterior insular regions and in contralateral frontal and occipital regions. These findings are in good agreement with those described by previous studies on cortical thickness in TLE (Lin et al.,2007; McDonald et al., 2008; Bernhardt et al., 2008) with the exception that those studies found significant cortical thinning in the lateral temporal regions which we did not. There are several possible explanations for this discrepancy. Firstly, the small sample size of our patient group necessitated the pooling of left and right TLE patients. To that purpose, right TLE were side-flipped to create a common “ipsilateral” and a “contralateral” hemisphere. Although we tried to correct for the presence of physiological hemispherical differences of cortical thickness (Luders et al. 2006) by side-flipping the control group and using the flipped and non-flipped control data in the comparison with patients, this procedure resulted in a higher physiological variance which might have reduced our ability to detect lateral temporal thinning. Another explanation is that the patient population in some of the other studies included TLE-MTS as well as TLE-no, while we used a pure TLE-MTS group (combining of TLE-MTS and TLE-no for the comparison with controls showed significant lateral temporal thinning also in this study (data not shown)). Finally, there are additional methodological differences which might also have contributed to this discrepancy, e.g. different algorithms for cortical thickness measurements, different smoothing kernels, improved gray/white contrast at 4T compared to 1.5T (Duewell et al. 1996), different thresholds for significance and different methods to correct for multiple comparisons etc. Despite the difference in the lateral temporal lobe, this study confirmed once more that structural abnormalities in TLE-MTS are not confined to the epileptogenic focus but are widespread and affect extrahippocampal temporal and extratemporal structures in both hemispheres.
4.1.3. Widespread neocortical thinning in TLE-no
To our knowledge this is the first study which performed cortical thickness measurements in TLE-no and found widespread cortical temporal and extratemporal abnormalities. Significant neocortical thinning was found in ipsilateral inferior lateral temporal, frontal and anterior insula, and to a lesser degree also in contralateral temporal, frontal, anterior insula and in superior parietal regions.
Previous studies using ROI approaches found subtle although significant structural abnormalities in the ipsilateral amygdala, entorhinal cortex, thalamus or diffuse hemispheric volume losses in TLE-no compared to controls (Bernasconi et al. 2001, Bowers et al., 2003;Natsume et al., 2003; Mueller et al., 2007; Briellmann et al., 1998; Carne et al., 2007). Studies using unbiased whole brain analyses, i.e., voxel-based morphometry (VBM), found either no or only very subtle and diffuse cortical abnormalities in comparisons of TLE-no with controls (Mueller et al., 2006; Woermann et al. ,1999; Riederer et al. ,2008). Based on these observations, it was assumed that structural abnormalities in TLE-no are likely to be subtle, not well delineated and heterogeneous. The widespread cortical thinning found in this study however contradicts this assumption and suggests that eventually technical limitations of the VBM method prevented the detection of cortical abnormalities in TLE-no. For example, the type of non-linear spatial normalization used in VBM allows for some degree of miss co-registration on the level of individual smaller sulci and gyri. To compensate for this and to render the data normally distributed, the data needs to be convolved with a smoothing kernel which results in additional non-anatomical blurring of neighboring gyral and sulcal structures (Lerch et al., 2006; Bernhardt et al., 2008) and thus a reduced ability to detect cortical abnormalities. In contrast, Freesurfer uses the gyral pattern of the inflated brain for non-linear subject co-registration/spatial normalization thus allowing for a better co-registration on the level of individual sulci/gyri than VBM. Data smoothing for statistical analysis is also required but since this is also done on the inflated brain anatomical relationships between neighboring gyral and sulcal structures are better preserved. These differences could explain that cortical thickness measurements detected widespread cortical abnormalities which are missed by SPM based voxel-based techniques.
4.2. Biological Considerations
The nature of the neocortical thinning in TLE is unknown. Theoretically, it could be caused by three different mechanisms which are not mutually exclusive: 1. Cortical thinning due to microscopic cortical malformations, e.g., microdysgenesis. Microdysgenesis is characterized by cortical thinning due to dysplastic, enlarged neurons with reduced neuropil, a disturbed cortical architecture and the presence of heterotopic neurons in the perivascular white matter (Bothwell et al., 2001; Kaspar et al., 2003; Thom et al., 2001). Abnormalities consistent with microdysgenesis have been described in up to 35% of the surgically resected temporal lobe specimens but can also affect extratemporal regions (Eriksson et al., 2002; Norberg et al., 1999). 2. Cortical thinning due to deafferentation. In this case, loss of neurons in the epileptogenic focus due to local excitotoxic effects or microdysgenesis leads to deafferentation of synaptically connected neurons in other neocortical regions. 3. Cortical thinning due to local excitotoxic effects of epileptic activity which either originates in this region or propagates into it from another part of the brain.
Taking into account the information about the presumed focus localization in TLE-MTS and TLE-no, about its anatomical connections to other brain regions and the findings of ictal and interictal functional studies, it is possible to hypothesize which mechanism or mechanisms are most likely to cause thinning in a specific region
4.2.1. Neocortical thinning in TLE-MTS
In TLE-MTS the epileptogenic focus is assumed to be in the hippocampus and/or adjacent structures (perirhinal, entorhinal (ERC) or parahippocampal cortex) (Bertram et al. 2003, Vossler et al. 2004). Freesurfer does not provide a cortical thickness measurement for the hippocampus but showed significant thinning in the entorhinal and parahippocampal cortices in TLE-MTS which supports the hypothesis that these regions are part of the epileptogenic focus. The most likely cause of thinning in these regions is similarly as in the hippocampus neuron loss due to local excitotoxic effects. Most of the extrafocal regions showing ipsilateral cortical thinning in TLE-MTS, i.e., fusiform gyrus, retrosplenial cortex, temporal pole, insula and prestriate region, receive either direct or indirect (via ERC) hippocampal projections (Gloor 1997). Ictal SPECT studies consistently describe hyperperfusion in these regions while post-surgical PET studies show persistent hypometabolism (Nelissen et al., 2006, van Paesschen et al. 2003; Joo et al., 2005). Based on these observations, the cortical thinning in these regions could be explained by either deafferentation due loss of hippocampal projections or by neuron loss due to local excitotoxic effects of seizure propagation. The findings of the correlation analysis are in agreement with this assumption. In contrast, there are no direct projections of the ERC/hippocampus to the pre/postcentral region (Gloor 1997, Insausti and Munoz, 2001; Munoz and Insausti, 2005). The pre/postcentral region shows hyperperfusion during ictal SPECT (Nelissen et al., 2006; van Paesschen et al., 2003; Blumenfeld et al., 2004, Tae et al., 2005) and increased glucose metabolism in post-surgical PET, i.e., functional changes consistent with seizure propagation. The fact that pre- and postcentral cortical thinning is consistently described in cortical thickness studies of TLE (Li et al., 2007; MacDonald et al., 2008; Bernhardt et al., 2008) suggests that seizure propagation into these regions causes not only functional (Grant et al. 2005) but also irreversible structural abnormalities. Additional regions with cortical thinning are found in the superior and middle frontal gyrus. These prefrontal areas receive indirect input from the hippocampus/parahippocampus via retrosplenial cortex (Kobayashi et al., 2007). The assumption of an indirect effect of the focus on these regions is supported by the fact, that we found no significant correlations between the ipsilateral hippocampus and these prefrontal areas. Furthermore, ictal SPECT and EEG show evidence for widespread bilateral active inhibition in prefrontal regions (Blumenfeld et al.,2004 a,b; van Paesschen et al., 2003; Nelissen et al. ,2006) suggesting that thinning in the superior and middle frontal gyrus is more likely due to loss of retrosplenial projections than due to local excitotoxic effects of seizure propagation. Taken together, the pattern of cortical thinning found in TLE-MTS is consistent with an epileptogenic focus in the hippocampus/medial temporal lobe and secondary involvement of temporal and extratemporal neocortical regions directly or indirectly connected to the focus. The distribution of these regions suggests that not a single mechanism, e.g. deafferentation, is responsible for the thinning but rather a combination of several or all of them.
4.2.2. Neocortical thinning in TLE-no
Functional studies, i.e., depth EEG (Vossler et al. 2004) and PET imaging (Carne et al. 2007) suggest that the initial seizure onset zone in TLE-no is not restricted to the hippocampus but encompasses a more widespread area in the anterior inferior medial temporal lobe of which the hippocampus may or may not be a part. The cortical thinning in the ipsilateral mesial-inferior temporal region found in this study indicates that these functional abnormalities are associated with a structural correlate, e.g. a localized microdysgenesis or a diffuse neuronal loss due to excitotoxic effects. The anterior inferior medial temporal region is part of a larger network encompassing specific regions of the orbitofrontal cortex, frontal operculum and insular cortex (Saleem et al. 2008). This network is supposed to be a sensory integration system which –at least in primates – plays a role in the assessment of food stimuli. TLE-no display cortical thinning in all the regions belonging to this network suggesting that this network as a whole is affected in TLE-no. This assumption is also supported by the findings of the correlation analysis which shows strong significant correlations between inferior temporal gyrus and operclum/insula. Similarly as in TLE-MTS, regions of cortical thinning are also found in the pre/postcentral region and in the superior frontal region in TLE-no. The latter receives direct input from the inferior medial temporal region and thus deafferentation as well as excitotoxic effects of seizure propagation could explain the thinning. The findings of the correlation analysis which shows significant positive correlations between the region of the presumed focus and the superior frontal region also support the involvement of these mechanisms. In contrast, the pre/postcentral region receives no direct projections from the anterior medial-inferior region and also shows no significant correlations with the thickness in the inferior temporal lobe which suggests that similarly as in TLE-MTS seizure propagation is the most likely explanation for the thinning there. Taken together, the pattern of cortical thinning found in TLE-no is consistent with an epileptogenic focus in the anterior inferior medial temporal region and secondary involvement of temporal and extratemporal regions connected to this region. As in TLE-MTS, the distribution of these regions suggests that more than one pathological mechanism is responsible for the thinning.
In conclusion, we found that TLE-MTS as well as TLE-no had evidence for widespread cortical thinning in extrafocal neocortical regions. While extrafocal cortical thinning in TLE-MTS has been described by previous studies, this is to our knowledge the first study to describe widespread structural deficits in TLE-no. Although there are similarities between the two groups, the distribution of thinning is different enough to indicate that different cortical networks may be involved in TLE-MTS and TLE-no. The nature of these abnormalities, microscopic malformation, deafferentation or excitotoxic effects of seizure spread, is not clear but the distribution suggests that rather a combination of several mechanisms than a single mechanisms is responsible for these widespread abnormalities in TLE-MTS and TLE-no.
Acknowledgment
This work was supported by a National Institute of Health grant [RO1-NS31966 to K.D.L.]
Footnotes
Publisher's Disclaimer: This is a PDF file of an unedited manuscript that has been accepted for publication. As a service to our customers we are providing this early version of the manuscript. The manuscript will undergo copyediting, typesetting, and review of the resulting proof before it is published in its final citable form. Please note that during the production process errorsmaybe discovered which could affect the content, and all legal disclaimers that apply to the journal pertain.
References
- Bernasconi N, Bernasconi A, Caramanos Z, Dubeau F, Richardson J, Andermann F, et al. Entorhinal cortex atrophy in epilepsy patients exhibiting normal hippocampal volumes. Neurology. 2001;56:1335–1339. doi: 10.1212/wnl.56.10.1335. [DOI] [PubMed] [Google Scholar]
- Bernhardt BC, Worsley KJ, Besson P, Concha L, Lerch JP, Evans AC, et al. Mapping limbic network organization in temporal lobe epilepsy using morphometric correlations: Insight on the relation between mesiotemporal connectivity and cortical atrophy. NeuroImage. 2008;42(2):515–24. doi: 10.1016/j.neuroimage.2008.04.261. [DOI] [PubMed] [Google Scholar]
- Bertram EH. Why does surgery fail to cure limbic epilepsy? Seizure functional anatomy may hold the answer. Epilepsy Res. 2003;56:93–99. doi: 10.1016/j.eplepsyres.2003.10.003. [DOI] [PubMed] [Google Scholar]
- Blumenfeld H, Rivera M, McNally KA, Davis K, Spencer DD, Spencer SS. Ictal neocortical slowing in temporal lobe epilepsy. Neurology. 2004;63:1015–1021. doi: 10.1212/01.wnl.0000141086.91077.cd. [DOI] [PubMed] [Google Scholar]
- Blumenfeld H, McNally KA, Vanderhill SD, Paige AL, Chung R, Davis K, et al. Positive and negative network correlations in temporal lobe epilepsy. Cerebral Cortex. 2004;14:892–902. doi: 10.1093/cercor/bhh048. [DOI] [PubMed] [Google Scholar]
- Bothwell S, Meredith GE, Phillips J, Staunton H, Doherty C, Grigorenko E, et al. O'Donovan CA, Farrell M. Neuronal Hypertrophy in the neocortex of patients with temporal lobe epilepsy. J Neurosci. 2001;21:4789–4800. doi: 10.1523/JNEUROSCI.21-13-04789.2001. [DOI] [PMC free article] [PubMed] [Google Scholar]
- Bowers SPC, Vogrin SJ, Morris K, Cox I, Murphy M, Kilpatrick CJ, et al. Amygdala volumetry in “imaging-negative” temporal lobe epilepsy. J Neurol Neurosurg Psychiatry. 2003;74:1245–1249. doi: 10.1136/jnnp.74.9.1245. [DOI] [PMC free article] [PubMed] [Google Scholar]
- Briellmann RS, Jackson D, Kalnins R, Berkovic SF. Hemicranial volume deficits in patients with temporal lobe epilepsy with and without hippocampal sclerosis. Epilepsia. 1998;39:1174–1181. doi: 10.1111/j.1528-1157.1998.tb01308.x. [DOI] [PubMed] [Google Scholar]
- Carne RP, Cook MJ, MacGregor LR, Kilpatrick CJ, Hicks RJ, O'Brien TJ. Magnetic resonance imaging negative positron emission tomography positive temporal lobe epilepsy: FDG-PET pattern differs from mesial temporal lobe epilepsy. Mol Imaging Biol. 2007;9:32–42. doi: 10.1007/s11307-006-0073-0. [DOI] [PubMed] [Google Scholar]
- Coste S, Ryvlin P, Hermier M, Ostrowsky K, Adeleine P, Froment JC, et al. Temporopolar changes in temporal lobe epilepsy. A quantitative MRI-based study. Neurology. 2002;59:855–861. doi: 10.1212/wnl.59.6.855. [DOI] [PubMed] [Google Scholar]
- Dale AM, Fischl B, Sereno MI. Cortical surface-based analysis I: segmentation and surface reconstruction. Neuroimage. 1999;9:179–194. doi: 10.1006/nimg.1998.0395. [DOI] [PubMed] [Google Scholar]
- Desay NP, Jaroz JM, Elwes RCD, Polkey CE, Cox TCS. Thalamic changes with mesial temporal sclerosis: MRI. Neuroradiology. 2000;42:346–351. doi: 10.1007/s002340050896. [DOI] [PubMed] [Google Scholar]
- Dreifuss S, Vingerhoets FJG, Lazeyras F, Gonzales Andino S, Spinelli L, Delavelle J, et al. Volumetric measurements of subcortical nuclei in patients with temporal lobe epilepsy. Neurology. 2001;57:1636–1641. doi: 10.1212/wnl.57.9.1636. [DOI] [PubMed] [Google Scholar]
- Duewell S, Wolff SG, Wen H, Balaban RS, Jezzard P. MR imaging contrast in human brain tissue: assessment and optimization at 4T. Radiology. 1996;199:780–786. doi: 10.1148/radiology.199.3.8638005. [DOI] [PubMed] [Google Scholar]
- Eriksson SH, Rydenhag B, Uvebrant P, Malmgren K, Norborg C. Widespread microdysgenesis in therapy-resistant epilepsy. A case report on post-mortem findings. Acta Neuropathol. 2002;103:74–77. doi: 10.1007/s004010100426. [DOI] [PubMed] [Google Scholar]
- Fischl B, Dale AM. Measuring the thickness of the human cerebral cortex from magnetic resonance images. Proc Natl Acad Sci U S A. 2000;97:11050–5. doi: 10.1073/pnas.200033797. [DOI] [PMC free article] [PubMed] [Google Scholar]
- Fischl B, Sereno MI, Dale AM. Cortical surface-based analysis. II: Inflation, flattening, and a surface-based coordinate system. Neuroimage. 1999;2:195–207. doi: 10.1006/nimg.1998.0396. [DOI] [PubMed] [Google Scholar]
- Fischl B, Liu A, Dale AM. Automated manifold surgery: constructing geometrically accurate and topologically correct models of the human cerebral cortex. IEEE Trans Med Imaging. 2001;20:70–80. doi: 10.1109/42.906426. [DOI] [PubMed] [Google Scholar]
- Fischl B, Sereno MI, Tootell RB, Dale AM. High-resolution intersubject averaging and a coordinate system for the cortical surface. Hum Brain Mapp. 1999;8:272–84. doi: 10.1002/(SICI)1097-0193(1999)8:4<272::AID-HBM10>3.0.CO;2-4. [DOI] [PMC free article] [PubMed] [Google Scholar]
- Fischl B, Salat DH, van der Kouwe AJ, Makris N, Ségonne F, Quinn BT, et al. Sequence-independent segmentation of magnetic resonance images. Neuroimage. 2004;23(Suppl 1):S69–84. doi: 10.1016/j.neuroimage.2004.07.016. [DOI] [PubMed] [Google Scholar]
- Fischl B, van der Kouwe A, Destrieux C, Halgren E, Ségonne F, Salat DH, et al. Automatically parcellating the human cerebral cortex. Cereb Cortex. 2004;1:11–22. doi: 10.1093/cercor/bhg087. [DOI] [PubMed] [Google Scholar]
- Fischl B, Salat DH, Busa E, Albert M, Dieterich M, Haselgrove C, et al. Whole brain segmentation: automated labeling of neuroanatomical structures in the human brain. Neuron. 2002;33:341–355. doi: 10.1016/s0896-6273(02)00569-x. [DOI] [PubMed] [Google Scholar]
- Gloor P. The temporal lobe and limbic system. Oxford University Press USA; New York: 1997. [Google Scholar]
- Grant AC, Henry TR, Fernandez R, Hill MA, Sathian K. Somatosenory processing is impaired in temporal lobe epilepsy. Epilepsia. 2005;46:534–539. doi: 10.1111/j.0013-9580.2005.54604.x. [DOI] [PubMed] [Google Scholar]
- Hagemann G, Lemieux L, Free SL, Krakow K, Everitt AD, Kendall BE, et al. Cerebellar volumes in newly diagnosed and chronic epilepsy. J. Neurol. 2002;249:1651–1658. doi: 10.1007/s00415-002-0843-9. [DOI] [PubMed] [Google Scholar]
- Insausti R, Munoz M. Cortical projections of the non-entorhinal hippocampal formation in the cynomolgus monkey (Macaca fascicularis) Eur J Neurosci. 2001:435–451. doi: 10.1046/j.0953-816x.2001.01662.x. [DOI] [PubMed] [Google Scholar]
- Joo EY, Hong SB, Han HJ, Tae WS, Kim JH, Han SJ, et al. Postoperative alteration of cerebral glucose metabolism in mesial temporal lobe epilepsy. Brain. 2005;128:1802–1810. doi: 10.1093/brain/awh534. [DOI] [PubMed] [Google Scholar]
- Jutila L, Ylinen A, Partanen K, Alafuzoff I, Mervaala E, Partanen J, et al. MR volumetry of the entorhinal, perirhinal and temporopolar cortices in drug refractory temporal lobe epilepsy. Am J Neuroradiol. 2001;22:1490–1501. [PMC free article] [PubMed] [Google Scholar]
- Kaspar B, Stefan H, Paulus W. Microdysgenesis in mesial temporal lobe epilepsy: A clinicoathological study. Ann Neurol. 2003;54:501–506. doi: 10.1002/ana.10694. [DOI] [PubMed] [Google Scholar]
- Keller SS, Wilke M, Wieshmann UC, Sluming VA, Roberts N. Comparison of standard and optimized voxel-based morphometry for analysis of brain changes associated with temporal lobe epilepsy. Neuroimage. 2004;23:860–868. doi: 10.1016/j.neuroimage.2004.07.030. [DOI] [PubMed] [Google Scholar]
- Kim JS, Singh V, Lee JK, Lerch J, Ad-Dab'bagh Y, MacDonald D, et al. Automated 3-D extraction and evaluation of the inner and outer cortical surfaces using a Laplacian map and partial volume effect classification. Neuroimage. 2005;27:210–221. doi: 10.1016/j.neuroimage.2005.03.036. [DOI] [PubMed] [Google Scholar]
- Kim JH, Tien RD, Felsberg GJ, Osumi AK, Lee N. Clinical significance of asymmetry of the fornix and mamillary body on MR in hippocampal sclerosis. Am J Neuroradiol. 1995:509–515. [PMC free article] [PubMed] [Google Scholar]
- Kobayashi Y, Amaral DG. Macaque monkey retrosplenial cortex: III. Cortical efferents. J. Comp Neurol. 2007;502:810–833. doi: 10.1002/cne.21346. [DOI] [PubMed] [Google Scholar]
- Lerch JP, Worsley K, Shaw WP, Greenstein DK, Lenroot, Giedd, et al. Mapping anatomica; correlations across cerebral cortex (MACACC) using cortical thickness from MRI. Neuroimage. 2006;31:993–1003. doi: 10.1016/j.neuroimage.2006.01.042. [DOI] [PubMed] [Google Scholar]
- Lin JJ, Salamon N, Lee AD, Dutton RA, Geaga JA, Hayashi KM, et al. Reduced neocortical thickness and complexity mapped in mesial temporal lobe epilepsy with hippocampal sclerosis. Cereb Cortex. 2007;17:2007–18. doi: 10.1093/cercor/bhl109. [DOI] [PubMed] [Google Scholar]
- Luders E, Narr KL, Thompson PM, Rex DE, Jancke L, Toga AW. Hemispheric asymmetries in cortical thickness. Cereb Cortex. 2006;16:1232–1238. doi: 10.1093/cercor/bhj064. [DOI] [PubMed] [Google Scholar]
- McDonald CR, Hagler DJ, Ahmadi ME, Tecoma E, Iragui V, Gharapetian L, et al. Regional neocortical thinning in temporal lobe epilepsy. Epilepsia. 2008;49:794–803. doi: 10.1111/j.1528-1167.2008.01539.x. [DOI] [PubMed] [Google Scholar]
- Moran NE, Lemieux L, Kitchen ND, Fish DR, Shorvon SD. Extrahippocampal temporal lobe atrophy in temporal lobe epilepsy and mesial temporal sclerosis. Brain. 2001;124:167–175. doi: 10.1093/brain/124.1.167. [DOI] [PubMed] [Google Scholar]
- Mueller SG, Laxer KD, Cashdollar N, Buckley S, Paul C, Weiner MW. Voxel-based optimized Morphometry (VBM) of Gray and White Matter in Temporal Lobe Epilepsy (TLE) with and without Mesial Temporal Sclerosis. Epilepsia. 2006;47:900–907. doi: 10.1111/j.1528-1167.2006.00512.x. [DOI] [PMC free article] [PubMed] [Google Scholar]
- Mueller SG, Laxer KD, Schuff N, Weiner MW. Voxel-based T2 relaxation rate measurements in temporal lobe epilepsy (TLE) with and without mesial temporal sclerosis. Epilepsia. 2007;48:220–280. doi: 10.1111/j.1528-1167.2006.00916.x. [DOI] [PMC free article] [PubMed] [Google Scholar]
- Munoz M, Insausti R. Cortical projections of the entorhinal cortex and the adjacent parahippocampal region in the monkey (Macaca fascicularis) Eur J Neurosci. 2005;22:1368–1388. doi: 10.1111/j.1460-9568.2005.04299.x. [DOI] [PubMed] [Google Scholar]
- Natsume J, Bernasconi N, Andermann F, Bernasconi A. MRI volumety of the thalamus in temporal, extratemporal, and idiopathic generalized epilepsy. Neurology. 2003;60:1298–1300. doi: 10.1212/01.wnl.0000058764.34968.c2. [DOI] [PubMed] [Google Scholar]
- Nelissen N, van Paesschen W, Baete K, Van Laere K, Palmini A, Van Billoen H, et al. Correlations of ictal FDG=PET metabolism and ictal SPECT perfusion changes in human temporal lobe epilepsy with hippocampal sclerosis. Neuroimage. 2006;32:684–695. doi: 10.1016/j.neuroimage.2006.04.185. [DOI] [PubMed] [Google Scholar]
- Norborg C, Eriksson S, Rydenhag B, Uvebrant P, Malmgren K. Microdysgenesis in surgical specimens from patients with epilepsy: occurrence and clinical correlations. J Neurol Neurosurg Psychiatry. 1999;67:521–524. doi: 10.1136/jnnp.67.4.521. [DOI] [PMC free article] [PubMed] [Google Scholar]
- Saleem KS, Kondo H, Price JL. Complementary circuits connecting the orbital and medial prefrontal networks with the temporal, insular and opercular cortex in the macaque monkey. J Comp Neurology. 2008;506:659–693. doi: 10.1002/cne.21577. [DOI] [PubMed] [Google Scholar]
- Ségonne F, Grimson E, Fischl B. A genetic algorithm for the topology correction of cortical surfaces. Inf Process Med Imaging. 2005;19:393–405. doi: 10.1007/11505730_33. [DOI] [PubMed] [Google Scholar]
- Tae WS, Joo EY, Kim JH, Han SJ, Suh YL, Kim BT, et al. Cerebral perfusion changes in mesial temporal lobe epilepsy: SPM analysis of ictal and interictal SPECT. Neuroimage. 2005;24:101–110. doi: 10.1016/j.neuroimage.2004.08.005. [DOI] [PubMed] [Google Scholar]
- Thom M, Sisodiya S, Harkness W, Scaravilli F. Microdysgenesis in temporal lobe epilepsy. A quantitative and immunohistological study of white matter neurons. Brain. 2001;124:2299–2309. doi: 10.1093/brain/124.11.2299. [DOI] [PubMed] [Google Scholar]
- Thompson PM, Lee AD, Dutton RA, Geaga JA, Hayashi KM, Eckert Ma, et al. Abnormal cortical complexity and thickness profiles mapped in Williams syndrome. J. Neurosci. 2005;25:4146–4158. doi: 10.1523/JNEUROSCI.0165-05.2005. [DOI] [PMC free article] [PubMed] [Google Scholar]
- Van Leemput K, Maes F, Vandermeulen D, Suetens P. Automated model-based bias field correction of MR images of the brain. IEEE Trans Med Imaging. 1999 Oct;18(10):885–96. doi: 10.1109/42.811268. [DOI] [PubMed] [Google Scholar]
- Van Leemput K, Maes F, Vandermeulen D, Suetens P. Automated model-based tissue classification of MR images of the brain. IEEE Trans Med Imaging. 1999;18:897–908. doi: 10.1109/42.811270. [DOI] [PubMed] [Google Scholar]
- Van Paesschen W, Dupont P, Van Driel G, Van Billoen H, Maes A. SPECT perfusion changes during complex partial seizure in patients with hippocampal sclerosis. Brain. 2003;126:1103–1111. doi: 10.1093/brain/awg108. [DOI] [PubMed] [Google Scholar]
- Vossler DG, Kramer DL, Haltiner AM, Rostad SW, Kjos BO, Davis BJ, et al. Intracranial EEG in temporal lobe epilepsy: location of seizure onset relates to degree of hippocampal pathology. Epilepsia. 2004;45:497–503. doi: 10.1111/j.0013-9580.2004.47103.x. [DOI] [PubMed] [Google Scholar]
- Woermann GF, Free SL, Koepp MJ, Ashburner J, Duncan JS. Voxel-by-voxel comparison of automatically segmented cerebral gray matter. A rater independent comparison of structural MRI in patients with epilepsy. Neuroimage. 1999;10:373–384. doi: 10.1006/nimg.1999.0481. [DOI] [PubMed] [Google Scholar]