

Abstract
Background
Chronic kidney disease (CKD) is an important risk factor for cardiovascular disease (CVD) events. A high ankle brachial index (ABI) - a marker of lower extremity arterial stiffness – is associated with CVD events and mortality. The association between CKD and high ABI is unknown.
Methods
The Cardiovascular Health Study enrolled community-living persons > 65 years, and measured kidney function and ABI. Glomerular filtration rate (GFR) was estimated using equations that incorporated either cystatin C or creatinine, and CKD was defined by estimated GFR < 60 ml/min/1.73m2. The ABI was categorized as low (< 0.90), low-normal (0.90 – 1.09), normal (1.10 – 1.40), and high (> 1.40 or incompressible). Multinomial logistic regression was used to evaluate the associations of CKD with the ABI categories.
Results
Among 4,513 participants, 23% had CKD, 13% had low ABI, and 3% had high ABI. In models adjusted for age, sex, race, hypertension, diabetes, smoking, BMI, LDL cholesterol, HDL cholesterol, and CRP, cystatin C based CKD was associated with both low ABI (relative risk [RR] 2.0; 95% confidence interval [CI] 1.6 – 2.5; P value < 0.001) and high ABI (RR 1.6; 95% CI 1.0 – 2.3; P = 0.03). Results were similar when CKD was defined by creatinine.
Conclusions
CKD is associated with both the high and low extremes of ABI in community-living older persons. Future studies should evaluate whether arterial stiffness is an important mechanism leading to CVD in persons with CKD.
Keywords: kidney disease, chronic, atherosclerosis, calcium, cardiovascular disease, arterial stiffness
INTRODUCTION
Chronic kidney disease (CKD) affects approximately 13% of adults in the United States,1 and is strongly associated with cardiovascular disease (CVD) events and all-cause mortality.2 These associations are not fully explained by traditional CVD risk factors, and are detected even with modest decrements in kidney function.2, 3 At each stage of CKD, the risk of CVD mortality is several fold higher than the risk of progression to end-stage renal disease (ESRD).4 Despite intense investigation,5 the mechanisms responsible remain largely unknown.
Arterial calcification is one potential mechanism linking CKD and CVD. Arterial calcification is highly prevalent in maintenance dialysis patients,6–8 and its presence and severity predict all-cause mortality.9, 10 However, vascular calcification may be due to either intimal, or medial arterial calcification.11, 12 As part of the atherosclerotic process, calcium is deposited within the tunica intima with lipid-rich plaque and focal arterial narrowing. Alternatively, medial arterial calcification is limited to the tunica media, has a uniform character resembling a ring in vessel cross-section and tram-tracks in longitudinal view, is not inflammatory or flow limiting,12 and directly contributes to arterial stiffness in animal models.13, 14 Medial arterial calcification is particularly prevalent in the distal arteries of the lower extremities and is correlated with higher pulse-wave velocity, left ventricular hypertrophy, and mortality in maintenance dialysis populations.9, 11
The ankle-brachial index (ABI) is a non-invasive measure of subclinical CVD which may allow for determination of the predominant pattern of arterial disease in the lower limbs. A low ABI is sensitive and specific for angiographically determined atherosclerosis of the lower extremeties,15, 16 and is strongly associated with CVD events and mortality in a variety of populations.17–23 Alternatively, a high ABI reflects generalized stiffening of the lower limb arteries,24, 25 and an elevated ankle systolic blood pressure has high specificity for medial arterial calcification.26 Recent studies demonstrate U-shaped relationships between ABI and mortality, wherein subjects with a high ABI had nearly equal mortality risk to subjects with a low ABI, and both groups were at approximately 2-fold mortality risk compared to subjects with intermediate ABI scores.27–29
While prior studies have demonstrated that CKD is associated with low ABI,30–33 the association of CKD with high ABI has not been studied. Such an association would suggest that medial arterial calcification may begin early in the process of kidney dysfunction. Here, we evaluate the association of CKD with high ABI, and compare the strength of association to that with low ABI in the Cardiovascular Health Study (CHS); a community-based cohort of older adults. We hypothesized that CKD would be associated with both low and high ABI, independent of traditional CVD risk factors.
METHODS
Participants
The CHS is a community-based study of older adults, designed to evaluate risk factors for development and progression of CVD. Its tudy design has been described previously.34, 35 In brief, eligibility required age ≥ 65 years, expectation to remain in the area for 3 years after recruitment, no active cancer treatment, and the ability to provide consent. Between 1989 and 1990, 5201 participants were recruited from 4 communities (Sacramento, CA; Forsyth County, NC; Washington County, MD; and Allegheny County, PN). An additional 687 African-Americans were recruited in 1992 to 1993. Participants were sampled from Medicare eligibility lists in each area. The present study represents a cross-sectional analysis using data from the 1992 to 1993 study visit, where ABI and kidney function were measured concurrently. Among the 5,265 subjects who participated at that visit, 488 (9%) were excluded due to missing ABI measurements, and 246 (5%) were excluded due to missing kidney function measurement, resulting in a study sample of 4,531 subjects for this analysis.
All participants provided written informed consent, and the study was approved by the investigational review boards of the 4 clinical sites and the Data Coordinating Center at the University of Washington.
Measurements
Kidney Function
Fasting (8 hour) blood specimens were collected at the 1992–93 study visit, and were stored at −70º Celsius. Cystatin C concentrations were measured using a BNII nephelometer (Dade Behring Inc., Deerfield, IL) as described elsewhere.36 The intra-assay and inter-assay coefficients of variation (CV) were < 2.9 and < 3.2%, respectively. Cystatin C based estimated GFR was calculated using the equation eGFRcys=76.7*cystatin C [mg/L]−1.19.37
Serum creatinine concentrations were measured using the Kodak Ektachem 700 Analyzer (Eastman Kodak, Rochester, NY), a colorimetric method. The intra-assay CV was < 2%. Creatinine measurements were indirectly calibrated to the reference standard at the Cleveland Clinical laboratory – the core lab of the Modification of Diet and Renal Disease (MDRD) study – as previously described.38 The abbreviated (4 variable) MDRD study formula to estimate GFR,39 (eGFRCr). CKD was defined by an eGFR < 60 ml/min/1.73m2 by either equation.40
Ankle Brachial Index
The ABI protocol has been described previously.20 Briefly, after at least 5 minutes of rest and with the subject in supine position, standard mercury sphygmomanometers and a Doppler stethoscope (8 MHz, Huntleigh Technology, Inc., PLC, Luton, UK) determined the right brachial artery and right and left leg posterior tibial artery systolic blood pressures. Duplicate measurements were obtained and averaged. When a blood pressure could not be taken in the right arm, the left arm was used. The ratio of the systolic blood pressure in the leg to the arm defined the leg-specific ABI. The lower of the leg-specific ABIs was used as the patient specific ABI for this analysis. When arterial flow was not abolished with the leg blood pressure cuff inflated to > 300mmHg, the artery was deemed incompressible.
Secondary Predictors
Age, sex, and race/ethnicity were determined by self report. After 5 minutes of rest, seated blood pressure was determined in duplicate using standard mercury sphygmomanometers (Hawksley & Sons Ltd, Sussex, UK).41 Results were averaged. Prevalent hypertension was defined by a seated systolic blood pressure ≥ 140 mmHg, diastolic blood pressure ≥ 90mmHg, or treatment for hypertension. Prevalent diabetes was defined by history of physician’s diagnosis, use of hypoglycemic agents or insulin, or fasting glucose level ≥ 126 mg/dL. Smoking history was determined by questionnaire and categorized as former, past, or never. Height (cm) and weight (kg) were recorded without shoes and with the patient wearing light clothes, and body mass index (BMI) was calculated (kg/m2). The Olympus Demand System (Olympus, Lake Success, NY) determined serum total and HDL cholesterol and triglyceride concentrations; LDL cholesterol concentrations were calculated by the Friedewald equation.42 C-reactive protein (CRP) was determined by an ultra-sensitive enzyme linked immunosorbent assay as described previously.43, 44
Statistical Analysis
We developed natural piecewise-cubic spline functions to evaluate parametric nonlinear functions for eGFRcys and ABI measurements. Pre-specified interior knots were placed at the quartiles of the distribution of eGFRcys. Subjects with the 2.5% highest and lowest extreme eGFRcys measurements were excluded from spline functions to avoid clinically implausible extrapolation by extreme values. Because prior studies consistently demonstrated higher risk for all-cause mortality and CVD events among persons with ABI < 0.9 or > 1.4,27–29 we developed mutually exclusive categories that simultaneously captured the functional form of the spline analysis and also utilized these cut-points (< 0.90, 0.90 – 1.09, 1.10 – 1.40, and > 1.40/incompressible). Subjects with ABI measurements of 1.10 – 1.40 served as the reference group for subsequent analyses.
We compared the distribution of demographic characteristics and traditional CVD risk factors across ABI groups by analysis of variance (ANOVA) for continuous variables and Chi-Square for categorical variables. When statistically significant difference were observed across groups, pair-wise comparisons between groups were evaluated by the T-test or Wilcoxon rank sum test for continuous variables, and by the Chi-Square test or Fisher’s Exact test for categorical variables. We adjusted for multiple comparisons using the Holm-Sidak test.45
Multinomial logistic regression evaluated the associations of CKD with low and high ABI simultaneously. It utilizes a log-, rather than logit-link, and therefore provides estimates of the relative risk (RR). The initial model was unadjusted, and a subsequent model was adjusted for age, sex, and race. The final model evaluated these variables and all other variables that were significantly different across ABI categories, providing a parsimonious list of covariates to facilitate comparison of the relative strength of associations of CKD with high and low ABI. We performed a sensitivity analyses evaluating ankle systolic blood pressure as the outcome, adjusting for the identical covariates and brachial blood pressure, because previous studies provide test characteristics of ankle blood pressure for medial arterial calcification, rather than the high ABI.26 Results were similar, so data are presented for ABI only. Last, we created multiplicative interaction terms to evaluate whether the observed relationships differed by diabetes status, selected a priori due to prior published research.46, 47
S-Plus (version 8.0) and SPSS statistical software (version 15.0.1.1, SPSS, Inc., Chicago, IL) were used for the analyses.
RESULTS
Among the 4,513 study participants, the mean age was 75 years, 58% were female, and 83% were Caucasian. The mean eGFRcys was 73 ± 19 and mean eGFRMDRD was 76 ± 20 ml/min/1.73m2, respectively. CKD was detected among 23% (N=1,042) by eGFRcys, and 21% (N=939) by eGFRMDRD. Thirteen percent of participants (N=579) had ABI measurements < 0.90, 33% (N=1,478) had ABI between 0.90 and 1.09, 51% (N=2,304) had ABI between 1.10 and 1.40, and 3% (N=152) had ABI > 1.40 or incompressible. Fifty-seven participants were categorized in this latter group on the basis of incompressible lower limb arteries.
Compared to participants with ABI 1.10–1.40, lower ABI participants were older, more frequently male and African-American, had higher prevalence of hypertension, diabetes, and tobacco use, and wre more likely to have an atherogenic lipid profile and higher CRP levels (Table 1). In contrast, participants with higher ABI measurements did not differ significantly by age or race. With the exception of male sex, diabetes, and lower HDL cholesterol, high ABI was not associated with traditional CVD risk factors. Participants with ABI > 1.40 had similar tobacco use and BMI, and had lower prevalence of hypertension, lower total and LDL cholesterol, triglycerides, and CRP levels compared to the reference group.
Table 1.
Participants Categorized by Ankle Brachial Index*
| Ankle Brachial Index |
||||
|---|---|---|---|---|
| < 0.90 | 0.90 – 1.10 | 1.10 – 1.40 | > 1.40/Incompressible | |
| Number (%) | 579 (13%) | 1478 (33%) | 2,304 (51%) | 152 (3%) |
| Demographics | ||||
| Age (years) ± SD | 77 ± 6‡ | 75 ± 5‡ | 74 ± 5 | 75 ± 6 |
| Female (%) | 292 (50%)‡ | 1004 (68%)‡ | 1266 (55%) | 54 (36%)‡ |
| Race/ethnicity (%) | ||||
| White | 410 (71%)‡ | 1182 (80%)‡ | 1980 (86%) | 135 (89%) |
| Black | 163 (28%)‡ | 289 (20%)‡ | 312 (14%) | 17 (11%) |
| Other | 6 (1%)‡ | 7 (1%)‡ | 12 (1%) | 0 (0%) |
| Medical History | ||||
| Hypertension (%) | 428 (74%)‡ | 919 (62%)‡ | 1155 (50%) | 63 (41%)† |
| Diabetes (%) | 140 (24%)‡ | 216 (15%) | 300 (13%) | 34 (22%)‡ |
| Smoking (%) | ||||
| Current | 96 (17%)‡ | 179 (12%)‡ | 151 (7%) | 12 (8%) |
| Past | 284 (50%)‡ | 619 (43%)‡ | 1007 (45%) | 74 (49%) |
| Never | 189 (33%)‡ | 645 (45%)‡ | 151 (7%) | 65 (43%) |
| Measurements | ||||
| Body mass index (kg/m2) ± SD | 26.2 ± 4.7 | 26.4 ± 4.6‡ | 27.2 ± 4.7 | 27.1 ± 5.2 |
| Systolic blood pressure (mmHg) ± SD | 144 ± 24‡ | 140 ± 22‡ | 133 ± 19 | 126 ± 25‡ |
| Diastolic blood pressure (mmHg) ± SD | 70 ± 13‡ | 72 ± 12 | 71 ± 11 | 68 ± 11‡ |
| Total cholesterol (mg/dL) ± SD | 215 ± 43 | 211 ± 37‡ | 207 ± 37 | 195 ± 38‡ |
| LDL cholesterol (mg/dL) ± SD | 134 ± 38‡ | 128 ± 33 | 126 ± 33 | 119 ± 34 |
| HDL cholesterol (mg/dL) ± SD | 50 ± 14‡ | 55 ± 15‡ | 53 ± 14 | 51 ± 13 |
| Triglycerides (mg/dL)§ | 133 [94, 194]‡ | 123 [90, 174] | 122 [88, 169] | 117 [86, 153] |
| C-reactive protein (mg/dL)§ | 3.9 [1.8, 8.4]‡ | 2.8 [1.3, 6.4]‡ | 2.4 [1.1, 5.3] | 1.9 [0.9, 4.7] |
| Kidney Function | ||||
| eGFR MDRD (ml/min/1.73m2) ± SD | 71 ± 24‡ | 77 ± 21 | 77 ± 19 | 75 ± 21 |
| eGFR cysC (ml/min/1.73m2) ± SD | 64 ± 20‡ | 74 ± 19 | 75 ± 18 | 68 ± 19‡ |
| Cystatin C (mg/L) ± SD | 1.27 ± 0.47‡ | 1.09 ± 0.28 | 1.08 ± 0.30 | 1.21 ± 0.55‡ |
Across-groups P-values were < 0.001 for all comparisons.
Median [Interquartile Range]
P < 0.05 compared to the ABI 1.10 to 1.40 category (Sidak adjusted)
P < 0.01 compared to the ABI 1.10 to 1.40 category (Sidak adjusted)
We evaluated the association of kidney function as a continuous variable with ABI measurements. Adjusted spline functions demonstrated a U-shaped relationship, wherein persons with either high or low ABI had lower eGFR, compared to persons with intermediate ABI measurements (Figure 1). Subjects with the most preserved kidney function (highest eGFR) were centered at an ABI measurement of 1.20.
Figure 1. Estimated Glomerular Filtration Rate by Ankle-Brachial Index.
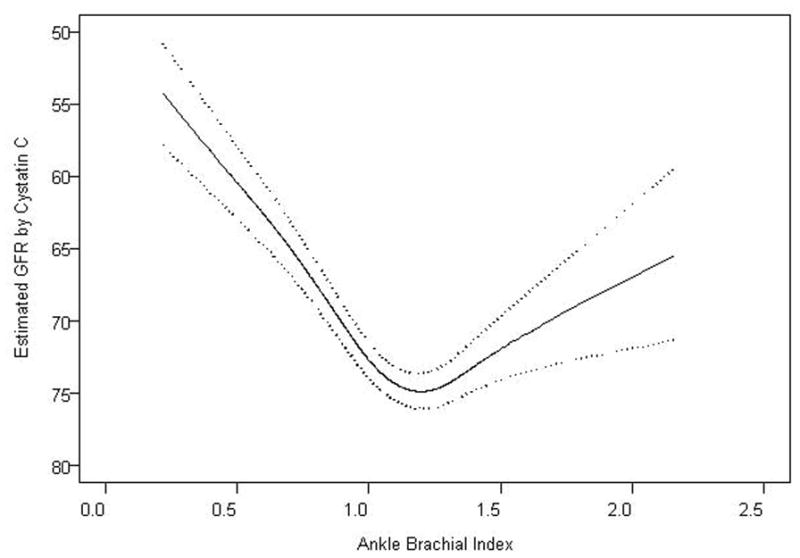
Figure depicts a natural cubic spline function. The solid line represents mean adjusted GFR, and dotted lines represent 95% confidence intervals. The spline function was adjusted for age, sex, race, hypertension, diabetes, smoking, BMI, LDL, HDL, and CRP.
When defined by eGFRcys, CKD was associated with an approximate 3-fold greater risk of ABI < 0.90, and an approximate 1.5 fold risk of high ABI compared to subjects with ABI measurements of 1.10 to 1.40 in unadjusted analyses (Table 2). The association of CKD with ABI < 0.90 was moderately attenuated in the fully adjusted model, but CKD remained significantly associated with a 2 fold risk for low ABI. In contrast, statistical adjustment for traditional CVD risk factors had minimal effect on the association of CKD with ABI > 1.40. Results were similar when CKD was defined by creatinine, as well as in companion analyses that evaluated ankle systolic blood pressure as the dependent variable, rather than ABI (Data not shown).
Table 2.
Associations of Chronic Kidney Disease* with High and Low Ankle Brachial Index
| ABI Groups |
||||
|---|---|---|---|---|
| < 0.90 |
0.90–1.10 |
1.10–1.40 |
> 1.40/Incompressible |
|
| RR (95% CI) | RR (95% CI) | Reference | RR (95% CI) | |
| Number | 579 (13%) | 1478 (33%) | 2304 (51%) | 152 (3%) |
| Moderate CKD by Cystatin based eGFR (N=1042, 23%) | ||||
| Unadjusted | 3.07 (2.53, 3.74) | 1.22 (1.03, 1.43) | -- | 1.65 (1.14, 2.38) |
| Age, sex, race adjusted | 2.55 (2.06, 3.15) | 1.18 (1.00, 1.40) | -- | 1.57 (1.06, 2.32) |
| Fully adjusted† | 2.00 (1.60, 2.51) | 1.11 (0.93, 1.33) | -- | 1.55 (1.04, 2.33) |
| Moderate CKD by MDRD based eGFR (N=936, 21%) | ||||
| Unadjusted | 2.12 (1.73, 2.61) | 1.19 (1.01, 1.41) | -- | 1.43 (0.97, 2.10) |
| Age, sex, race adjusted | 1.83 (1.48, 2.28) | 1.13 (0.96, 1.34) | -- | 1.45 (0.97, 2.16) |
| Fully adjusted† | 1.59 (1.26, 2.01) | 1.07 (0.90, 1.28) | -- | 1.50 (1.00, 2.24) |
Defined as eGFR < 60 ml/min/1.73m2.
Adjusted for age, gender, race, hypertension, diabetes, smoking, BMI, LDL, HDL and CRP.
To determine the severity of CKD at which these associations became evident, we evaluated the association of kidney function as a continuous measure with low and high ABI. For each outcome, there was a modest linear association at early decrements in kidney function that became generally steeper among subjects with estimated GFR values < 80 ml/min/1.73m2 (Figure 2).
Figure 2. The Association of the Spectrum of Glomerular Filtration Rate with High and Low Ankle Brachial Index.

Natural cubic spline function. The solid line represents relative risk, and dotted lines represent 95% confidence intervals. The spline function was adjusted for age, sex, race/ethnicity, hypertension, diabetes, smoking, BMI, LDL, HDL, and CRP.
Next, we evaluated the association of each kidney function measure with the ABI categories, stratified by diabetes status. The associations of CKD with low ABI appeared similar in persons with or without diabetes (Table 3). The association of CKD with high ABI, however, was qualitatively stronger among persons with diabetes, and the interaction was of borderline significance for cystatin, though less so for creatinine (Interaction P-values 0.07 and 0.24, respectively). Due to the small numbers in the high ABI group, the power to detect such an interaction was low.
Table 3.
Association of Chronic Kidney Disease with High and Low ABI, Stratified by Diabetes Status
| ABI Groups |
||||
|---|---|---|---|---|
| < 0.90 | 0.90–1.10 | 1.10–1.40 | > 1.40/Incompressible | |
| Moderate CKD by Cystatin* (N=1042, 23%) | ||||
| Diabetes, N (%) | 56 (40%) | 56 (26%) | 65 (22%) | 14 (41%) |
| Adjusted Association† | 1.78 (1.04, 3.05) | 1.03 (0.63, 1.68) | -- | 3.94 (1.71, 9.09) |
| No Diabetes, N (%) | 185 (42%) | 269 (21%) | 369 (18%) | 28 (24%) |
| Adjusted Association† | 2.08 (1.62, 2.68) | 1.12 (0.92, 1.36) | -- | 1.15 (0.71, 1.85) |
| Interaction P-Values (cystatin[continuous]* DM) | 0.60 | 0.65 | -- | 0.07 |
| Moderate CKD by MDRD* (N=936, 21%) | ||||
| Diabetes, N (%) | 38 (27%) | 44 (20%) | 50 (17%) | 10 (29%) |
| Adjusted Association† | 1.43 (0.82, 2.49) | 1.07 (0.64, 1.77) | -- | 2.56 (1.11, 5.90) |
| No Diabetes, N (%) | 145 (33%) | 261 (21%) | 362 (18%) | 26 (22%) |
| Adjusted Association† | 1.63 (1.27, 2.11) | 1.06 (0.88, 1.28) | -- | 1.26 (0.79, 2.00) |
| Interaction P-Values (MDRD [continuous]* DM) | 0.84 | 0.61 | -- | 0.27 |
Defined as eGFR < 60 ml/min/1.73m2.
Adjusted for age, gender, race, hypertension, smoking, BMI, LDL, HDL and CRP.
DISCUSSION
The primary finding of this study is that moderate CKD is associated with high ABI in community-living older persons. Participants with CKD had an approximately 50% greater risk of high ABI in adjusted models; an association of approximately equal strength to the association of CKD with low ABI. High ABI has predicted all-cause27–29 and CVD mortality,28, 29 stroke, and heart failure29 in prior studies. Therefore, this association may provide novel insights to the underlying mechanisms of arterial disease among persons with CKD.
The association of kidney function with high ABI was evident at an eGFR of approximately 80 ml/min/1.73m2 or lower in this study. This observation may be important to elucidating mechanisms linking early decrements in kidney function with CVD risk. A prior study from our group demonstrated that subjects with early decrements in kidney function not sufficiently severe to result in elevated serum creatinine levels are strongly associated with future CVD events in the CHS cohort.3 The mechanisms responsible for this relatively strong association, despite only modest decrements in kidney function, remain uncertain. Therefore, if the association of mild kidney dysfunction and high ABI is confirmed, future studies elucidating the responsible mechanisms may provide novel insights to the link between CKD and CVD events.
Medial arterial calcification is thought to lead to high ABI measurements in the majority of cases.24, 25 Indeed, Young and colleagues demonstrated that high ABI scores were directly correlated to medial arterial calcification severity as determined by lower limb plain x-ray, and that an ankle systolic blood pressure ≥ 190 mmHg had greater than 90% specificity for x-ray determined medial arterial calcification.26 Medial arterial calcification is characterized by a diffuse distribution that may directly contribute to arterial stiffness.13, 14, 48, 49 Among maintenance dialysis patients, medial arterial calcification has been associated with increased left ventricular mass and aortic pulse-wave velocity,13 which may lead to cardiac fibrosis and increased arrhythmia risk. If similar relations extend to persons without severe kidney disease, high ABI might indicate elevated risk for CVD events and mortality by mechanisms entirely distinct from atherosclerosis. These hypotheses require future study, but may be particularly relevant in persons with CKD, where the prevalence of arterial calcification is high,50, 51 and where traditional CVD risk factors only partially account for CVD risk.2, 52
Although a high ABI may identify individuals at higher risk for CVD events, it is uncertain whether or not this association is entirely independent of atherosclerosis. Atherosclerotic peripheral arterial disease (PAD) and medial arterial calcification may co-exist within individuals.53, 54 When this occurs, the stiff lower limb arteries may increase the ABI measurements, thus precluding the detection of atherosclerotic disease via a low ABI. Therefore, the associations of high ABI with CKD in this analyses, and with CVD events and all-cause mortality in prior reports. may in part reflect residual confounding by undetected peripheral atherosclerosis. Future studies with confirmatory tests for atherosclerotic PAD that are less effected by concomitant medial arterial calcification such as toe brachial index measurement25 are required to evaluate the contributions of medial arterial calcification to CVD events, independent of atherosclerosis.
With the exception of age, diabetes, and lower HDL, traditional CVD risk factors were not associated with high ABI in this study. Similar findings have been observed in other community-based studies.28, 29 Future research should evaluate risk factors for high ABI and, by extension, risk factors for arterial stiffness. Small studies among persons with advanced CKD have suggested that alterations in mineral metabolism may be associated with medial arterial calcification or high ABI.13, 55 Whether or not such associations extend to populations with normal to moderate decrements in kidney function is unknown. In addition, future studies should evaluate the associations of high ABI with cardiac structure and function, both at rest and with stress, as prior studies suggest that subjects with high ABI may have a more pronounced vasoreactive response to exercise.56
Strengths of this study include its community-based setting, large sample size, and uniform measurement of creatinine, cystatin C, ABI, and multiple potential confounding variables. The simultaneous availability of creatinine and cystatin C has specific advantages. eGFR by creatinine is commonly available in clinical practice and many observational studies, improving generalizability of our study and allowing comparison of strengths of association across studies if these associations are evaluated in other settings in the future. Alternatively, cystatin C provides a more accurate measure of kidney function among persons with normal or near-normal kidney function;57–60 the range of kidney function observed in the majority of CHS study participants. Its availability in this study allows us to evaluate more accurately whether or not early decrements in kidney function were associated with high and low ABI.
This study also has important limitations. First, the cross-sectional study design does not allow evaluation of temporality. Next, we lacked measurements of urine albumin excretion. A prior study demonstrated that albuminuria was associated with high ABI in bivariate analysis, but this was not subjected to multivariable models; an area that requires further investigation.61 ABI was defined by right arm blood pressures and without dorsalis pedis blood pressures. This may have introduced some misclassification in ABI categories. Future studies should include both ABI and toe brachial index measurements to evaluate more completely the respective associations of atherosclerotic PAD and arterial stiffness to CVD events. Next, because the prevalence of high ABI was only 3% (N=152) in our study sample, we had imprecise estimates of strengths of association, as demonstrated by relatively wide confidence intervals (Table 2). This was particularly true when analyses were stratified by diabetes status. While the association of CKD with high ABI was qualitatively stronger in persons with diabetes, future studies are required to determine if this observation is reproducible or may have been observed by chance. Last, participants in this study were older, community-living, and few had advanced CKD. Results may not generalize to younger persons or those with late stage CKD.
In conclusion, we demonstrate that diminished kidney function is associated with high ABI measurements. The relationship of kidney function with high ABI was not explained by traditional CVD risk factors. While much is known about risk factors and consequences of atherosclerotic PAD, future studies are needed to elucidate mechanisms leading to high ABI and medial arterial calcification, and to understand mechanisms linking them to CVD events. Such studies may ultimately provide novel insights to mechanisms of CVD in subjects with kidney disease.
Acknowledgments
This manuscript was supported by an American Heart Association Fellow to Faculty Transition Award (JHI) and the National Institutes on Aging R01AG027002 (MJS). The Cardiovascular Health Study was supported by contract numbers N01-HC-85079 through N01-HC-85086, N01-HC-35129, N01 HC-15103, N01 HC-55222, N01-HC-75150, N01-HC-45133, grant number U01 HL080295 from the National Heart, Lung, and Blood Institute, with additional contribution from the National Institute of Neurological Disorders and Stroke. A full list of principal CHS investigators and institutions can be found at http://www.chs-nhlbi.org/pi.htm.
Footnotes
DISCLOSURES: Dr. Kestenbaum: Honoraria (<$5,000) from Shire Inc. All other authors have no disclosures.
Publisher's Disclaimer: This is a PDF file of an unedited manuscript that has been accepted for publication. As a service to our customers we are providing this early version of the manuscript. The manuscript will undergo copyediting, typesetting, and review of the resulting proof before it is published in its final citable form. Please note that during the production process errors may be discovered which could affect the content, and all legal disclaimers that apply to the journal pertain.
References
- 1.Coresh J, Selvin E, Stevens LA, Manzi J, Kusek JW, Eggers P, Van Lente F, Levey AS. Prevalence of chronic kidney disease in the United States. Jama. 2007;298:2038–2047. doi: 10.1001/jama.298.17.2038. [DOI] [PubMed] [Google Scholar]
- 2.Go AS, Chertow GM, Fan D, McCulloch CE, Hsu CY. Chronic kidney disease and the risks of death, cardiovascular events, and hospitalization. N Engl J Med. 2004;351:1296–1305. doi: 10.1056/NEJMoa041031. [DOI] [PubMed] [Google Scholar]
- 3.Shlipak MG, Katz R, Sarnak MJ, Fried LF, Newman AB, Stehman-Breen C, Seliger SL, Kestenbaum B, Psaty B, Tracy RP, Siscovick DS. Cystatin C and prognosis for cardiovascular and kidney outcomes in elderly persons without chronic kidney disease. Ann Intern Med. 2006;145:237–246. doi: 10.7326/0003-4819-145-4-200608150-00003. [DOI] [PubMed] [Google Scholar]
- 4.Keith DS, Nichols GA, Gullion CM, Brown JB, Smith DH. Longitudinal follow-up and outcomes among a population with chronic kidney disease in a large managed care organization. Arch Intern Med. 2004;164:659–663. doi: 10.1001/archinte.164.6.659. [DOI] [PubMed] [Google Scholar]
- 5.Feldman HI, Appel LJ, Chertow GM, Cifelli D, Cizman B, Daugirdas J, Fink JC, Franklin-Becker ED, Go AS, Hamm LL, He J, Hostetter T, Hsu CY, Jamerson K, Joffe M, Kusek JW, Landis JR, Lash JP, Miller ER, Mohler ER, 3rd, Muntner P, Ojo AO, Rahman M, Townsend RR, Wright JT. The Chronic Renal Insufficiency Cohort (CRIC) Study: Design and Methods. J Am Soc Nephrol. 2003;14:S148–153. doi: 10.1097/01.asn.0000070149.78399.ce. [DOI] [PubMed] [Google Scholar]
- 6.Braun J, Oldendorf M, Moshage W, Heidler R, Zeitler E, Luft FC. Electron beam computed tomography in the evaluation of cardiac calcification in chronic dialysis patients. Am J Kidney Dis. 1996;27:394–401. doi: 10.1016/s0272-6386(96)90363-7. [DOI] [PubMed] [Google Scholar]
- 7.Goodman WG, Goldin J, Kuizon BD, Yoon C, Gales B, Sider D, Wang Y, Chung J, Emerick A, Greaser L, Elashoff RM, Salusky IB. Coronary-artery calcification in young adults with end-stage renal disease who are undergoing dialysis. N Engl J Med. 2000;342:1478–1483. doi: 10.1056/NEJM200005183422003. [DOI] [PubMed] [Google Scholar]
- 8.Flegal KM, Carroll MD, Ogden CL, Johnson CL. Prevalence and trends in obesity among US adults, 1999–2000. Jama. 2002;288:1723–1727. doi: 10.1001/jama.288.14.1723. [DOI] [PubMed] [Google Scholar]
- 9.Raggi P, Bellasi A, Ferramosca E, Islam T, Muntner P, Block GA. Association of pulse wave velocity with vascular and valvular calcification in hemodialysis patients. Kidney Int. 2007;71:802–807. doi: 10.1038/sj.ki.5002164. [DOI] [PubMed] [Google Scholar]
- 10.Matsuoka M, Iseki K, Tamashiro M, Fujimoto N, Higa N, Touma T, Takishita S. Impact of high coronary artery calcification score (CACS) on survival in patients on chronic hemodialysis. Clin Exp Nephrol. 2004;8:54–58. doi: 10.1007/s10157-003-0260-0. [DOI] [PubMed] [Google Scholar]
- 11.London GM, Marchais SJ, Guerin AP, Metivier F, Adda H. Arterial structure and function in end-stage renal disease. Nephrol Dial Transplant. 2002;17:1713–1724. doi: 10.1093/ndt/17.10.1713. [DOI] [PubMed] [Google Scholar]
- 12.Monckeberg J. Uber die reine mediaverkalkung der extremitatenarterien und ihr verhalten zur arteriosklerose. Virchows Arch Pathol Anat. 1902;171:141–167. [Google Scholar]
- 13.London GM, Guerin AP, Marchais SJ, Metivier F, Pannier B, Adda H. Arterial media calcification in end-stage renal disease: impact on all-cause and cardiovascular mortality. Nephrol Dial Transplant. 2003;18:1731–1740. doi: 10.1093/ndt/gfg414. [DOI] [PubMed] [Google Scholar]
- 14.Dao HH, Essalihi R, Bouvet C, Moreau P. Evolution and modulation of age-related medial elastocalcinosis: impact on large artery stiffness and isolated systolic hypertension. Cardiovasc Res. 2005;66:307–317. doi: 10.1016/j.cardiores.2005.01.012. [DOI] [PubMed] [Google Scholar]
- 15.Ouriel K, Zarins CK. Doppler ankle pressure: an evaluation of three methods of expression. Arch Surg. 1982;117:1297–1300. doi: 10.1001/archsurg.1982.01380340031008. [DOI] [PubMed] [Google Scholar]
- 16.Yao ST, Hobbs JT, Irvine WT. Ankle systolic pressure measurements in arterial disease affecting the lower extremities. Br J Surg. 1969;56:676–679. doi: 10.1002/bjs.1800560910. [DOI] [PubMed] [Google Scholar]
- 17.Leng GC, Lee AJ, Fowkes FG, Whiteman M, Dunbar J, Housley E, Ruckley CV. Incidence, natural history and cardiovascular events in symptomatic and asymptomatic peripheral arterial disease in the general population. Int J Epidemiol. 1996;25:1172–1181. doi: 10.1093/ije/25.6.1172. [DOI] [PubMed] [Google Scholar]
- 18.McDermott MM, Feinglass J, Slavensky R, Pearce WH. The ankle-brachial index as a predictor of survival in patients with peripheral vascular disease. J Gen Intern Med. 1994;9:445–449. doi: 10.1007/BF02599061. [DOI] [PubMed] [Google Scholar]
- 19.McKenna M, Wolfson S, Kuller L. The ratio of ankle and arm arterial pressure as an independent predictor of mortality. Atherosclerosis. 1991;87:119–128. doi: 10.1016/0021-9150(91)90014-t. [DOI] [PubMed] [Google Scholar]
- 20.Newman AB, Shemanski L, Manolio TA, Cushman M, Mittelmark M, Polak JF, Powe NR, Siscovick D. Ankle-arm index as a predictor of cardiovascular disease and mortality in the Cardiovascular Health Study. The Cardiovascular Health Study Group. Arterioscler Thromb Vasc Biol. 1999;19:538–545. doi: 10.1161/01.atv.19.3.538. [DOI] [PubMed] [Google Scholar]
- 21.Newman AB, Tyrrell KS, Kuller LH. Mortality over four years in SHEP participants with a low ankle-arm index. J Am Geriatr Soc. 1997;45:1472–1478. doi: 10.1111/j.1532-5415.1997.tb03198.x. [DOI] [PubMed] [Google Scholar]
- 22.Vogt MT, McKenna M, Anderson SJ, Wolfson SK, Kuller LH. The relationship between ankle-arm index and mortality in older men and women. J Am Geriatr Soc. 1993;41:523–530. doi: 10.1111/j.1532-5415.1993.tb01889.x. [DOI] [PubMed] [Google Scholar]
- 23.Fowkes FG, Murray GD, Butcher I, Heald CL, Lee RJ, Chambless LE, Folsom AR, Hirsch AT, Dramaix M, deBacker G, Wautrecht JC, Kornitzer M, Newman AB, Cushman M, Sutton-Tyrrell K, Fowkes FG, Lee AJ, Price JF, d’Agostino RB, Murabito JM, Norman PE, Jamrozik K, Curb JD, Masaki KH, Rodriguez BL, Dekker JM, Bouter LM, Heine RJ, Nijpels G, Stehouwer CD, Ferrucci L, McDermott MM, Stoffers HE, Hooi JD, Knottnerus JA, Ogren M, Hedblad B, Witteman JC, Breteler MM, Hunink MG, Hofman A, Criqui MH, Langer RD, Fronek A, Hiatt WR, Hamman R, Resnick HE, Guralnik J, McDermott MM. Ankle brachial index combined with Framingham Risk Score to predict cardiovascular events and mortality: a meta-analysis. Jama. 2008;300:197–208. doi: 10.1001/jama.300.2.197. [DOI] [PMC free article] [PubMed] [Google Scholar]
- 24.Hiatt WR. Medical treatment of peripheral arterial disease and claudication. N Engl J Med. 2001;344:1608–1621. doi: 10.1056/NEJM200105243442108. [DOI] [PubMed] [Google Scholar]
- 25.Orchard TJ, Strandness DE., Jr Assessment of peripheral vascular disease in diabetes. Circulation; Report and recommendations of an international workshop sponsored by the American Diabetes Association and the American Heart Association; September 18–20, 1992; New Orleans, Louisiana. 1993. pp. 819–828. [DOI] [PubMed] [Google Scholar]
- 26.Young MJ, Adams JE, Anderson GF, Boulton AJ, Cavanagh PR. Medial arterial calcification in the feet of diabetic patients and matched non-diabetic control subjects. Diabetologia. 1993;36:615–621. doi: 10.1007/BF00404070. [DOI] [PubMed] [Google Scholar]
- 27.O’Hare AM, Katz R, Shlipak MG, Cushman M, Newman AB. Mortality and cardiovascular risk across the ankle-arm index spectrum: results from the Cardiovascular Health Study. Circulation. 2006;113:388–393. doi: 10.1161/CIRCULATIONAHA.105.570903. [DOI] [PubMed] [Google Scholar]
- 28.Resnick HE, Lindsay RS, McDermott MM, Devereux RB, Jones KL, Fabsitz RR, Howard BV. Relationship of high and low ankle brachial index to all-cause and cardiovascular disease mortality: the Strong Heart Study. Circulation. 2004;109:733–739. doi: 10.1161/01.CIR.0000112642.63927.54. [DOI] [PubMed] [Google Scholar]
- 29.Sutton-Tyrrell K, Venkitachalam L, Kanaya AM, Boudreau R, Harris T, Thompson T, Mackey RH, Visser M, Vaidean GD, Newman AB. Relationship of ankle blood pressures to cardiovascular events in older adults. Stroke. 2008;39:863–869. doi: 10.1161/STROKEAHA.107.487439. [DOI] [PubMed] [Google Scholar]
- 30.O’Hare AM, Glidden DV, Fox CS, Hsu CY. High prevalence of peripheral arterial disease in persons with renal insufficiency: results from the National Health and Nutrition Examination Survey 1999–2000. Circulation. 2004;109:320–323. doi: 10.1161/01.CIR.0000114519.75433.DD. [DOI] [PubMed] [Google Scholar]
- 31.O’Hare AM, Vittinghoff E, Hsia J, Shlipak MG. Renal insufficiency and the risk of lower extremity peripheral arterial disease: results from the Heart and Estrogen/Progestin Replacement Study (HERS) J Am Soc Nephrol. 2004;15:1046–1051. doi: 10.1097/01.asn.0000119574.27772.fd. [DOI] [PubMed] [Google Scholar]
- 32.Shlipak MG, Fried LF, Crump C, Bleyer AJ, Manolio TA, Tracy RP, Furberg CD, Psaty BM. Cardiovascular disease risk status in elderly persons with renal insufficiency. Kidney Int. 2002;62:997–1004. doi: 10.1046/j.1523-1755.2002.00522.x. [DOI] [PubMed] [Google Scholar]
- 33.Wattanakit K, Folsom AR, Selvin E, Coresh J, Hirsch AT, Weatherley BD. Kidney function and risk of peripheral arterial disease: results from the Atherosclerosis Risk in Communities (ARIC) Study. J Am Soc Nephrol. 2007;18:629–636. doi: 10.1681/ASN.2005111204. [DOI] [PubMed] [Google Scholar]
- 34.Fried LP, Borhani NO, Enright P, Furberg CD, Gardin JM, Kronmal RA, Kuller LH, Manolio TA, Mittelmark MB, Newman A, et al. The Cardiovascular Health Study: design and rationale. Ann Epidemiol. 1991;1:263–276. doi: 10.1016/1047-2797(91)90005-w. [DOI] [PubMed] [Google Scholar]
- 35.Tell GS, Fried LP, Hermanson B, Manolio TA, Newman AB, Borhani NO. Recruitment of adults 65 years and older as participants in the Cardiovascular Health Study. Ann Epidemiol. 1993;3:358–366. doi: 10.1016/1047-2797(93)90062-9. [DOI] [PubMed] [Google Scholar]
- 36.Erlandsen EJ, Randers E, Kristensen JH. Evaluation of the Dade Behring N Latex Cystatin C assay on the Dade Behring Nephelometer II System. Scand J Clin Lab Invest. 1999;59:1–8. doi: 10.1080/00365519950185940. [DOI] [PubMed] [Google Scholar]
- 37.Stevens LA, Coresh J, Schmid CH, Feldman HI, Froissart M, Kusek J, Rossert J, Van Lente F, Bruce RD, 3rd, Zhang YL, Greene T, Levey AS. Estimating GFR using serum cystatin C alone and in combination with serum creatinine: a pooled analysis of 3,418 individuals with CKD. Am J Kidney Dis. 2008;51:395–406. doi: 10.1053/j.ajkd.2007.11.018. [DOI] [PMC free article] [PubMed] [Google Scholar]
- 38.Shlipak MG, Fried LF, Cushman M, Manolio TA, Peterson D, Stehman-Breen C, Bleyer A, Newman A, Siscovick D, Psaty B. Cardiovascular mortality risk in chronic kidney disease: comparison of traditional and novel risk factors. Jama. 2005;293:1737–1745. doi: 10.1001/jama.293.14.1737. [DOI] [PubMed] [Google Scholar]
- 39.Levey AS, Greene T, Kusek JW, Beck GJ. A simplified equation to predict glomerular filtration rate from serum creatinine [Abstract] J Am Soc Nephrol. 2001;11:A0828. [Google Scholar]
- 40.K/DOQI clinical practice guidelines for chronic kidney disease: evaluation, classification, and stratification. Am J Kidney Dis. 2002;39:S1–266. [PubMed] [Google Scholar]
- 41.Tell GS, Rutan GH, Kronmal RA, Bild DE, Polak JF, Wong ND, Borhani NO. Correlates of blood pressure in community-dwelling older adults. The Cardiovascular Health Study. Cardiovascular Health Study (CHS) Collaborative Research Group. Hypertension. 1994;23:59–67. doi: 10.1161/01.hyp.23.1.59. [DOI] [PubMed] [Google Scholar]
- 42.Friedewald WT, Levy RI, Fredrickson DS. Estimation of the concentration of low-density lipoprotein cholesterol in plasma, without use of the preparative ultracentrifuge. Clin Chem. 1972;18:499–502. [PubMed] [Google Scholar]
- 43.Barzilay JI, Abraham L, Heckbert SR, Cushman M, Kuller LH, Resnick HE, Tracy RP. The relation of markers of inflammation to the development of glucose disorders in the elderly: the Cardiovascular Health Study. Diabetes. 2001;50:2384–2389. doi: 10.2337/diabetes.50.10.2384. [DOI] [PubMed] [Google Scholar]
- 44.Macy EM, Hayes TE, Tracy RP. Variability in the measurement of C-reactive protein in healthy subjects: implications for reference intervals and epidemiological applications. Clin Chem. 1997;43:52–58. [PubMed] [Google Scholar]
- 45.Sidak Z. Rectangular confidence regions for the means of multivariate normal distributions. J Am Stat Assoc. 1967;62:626–633. [Google Scholar]
- 46.Ix JH, Chertow GM, Shlipak MG, Brandenburg VM, Ketteler M, Whooley MA. Association of fetuin-A with mitral annular calcification and aortic stenosis among persons with coronary heart disease: data from the Heart and Soul Study. Circulation. 2007;115:2533–2539. doi: 10.1161/CIRCULATIONAHA.106.682450. [DOI] [PMC free article] [PubMed] [Google Scholar]
- 47.Kramer H, Toto R, Peshock R, Cooper R, Victor R. Association between chronic kidney disease and coronary artery calcification: the Dallas Heart Study. J Am Soc Nephrol. 2005;16:507–513. doi: 10.1681/ASN.2004070610. [DOI] [PubMed] [Google Scholar]
- 48.Essalihi R, Dao HH, Yamaguchi N, Moreau P. A new model of isolated systolic hypertension induced by chronic warfarin and vitamin K1 treatment. Am J Hypertens. 2003;16:103–110. doi: 10.1016/s0895-7061(02)03204-1. [DOI] [PubMed] [Google Scholar]
- 49.Niederhoffer N, Lartaud-Idjouadiene I, Giummelly P, Duvivier C, Peslin R, Atkinson J. Calcification of medial elastic fibers and aortic elasticity. Hypertension. 1997;29:999–1006. doi: 10.1161/01.hyp.29.4.999. [DOI] [PubMed] [Google Scholar]
- 50.Ix JH, Katz R, Kestenbaum B, Fried LF, Kramer H, Stehman-Breen C, Shlipak MG. Association of mild to moderate kidney dysfunction and coronary calcification. J Am Soc Nephrol. 2008;19:579–585. doi: 10.1681/ASN.2007070765. [DOI] [PMC free article] [PubMed] [Google Scholar]
- 51.Gross ML, Meyer HP, Ziebart H, Rieger P, Wenzel U, Amann K, Berger I, Adamczak M, Schirmacher P, Ritz E. Calcification of coronary intima and media: immunohistochemistry, backscatter imaging, and x-ray analysis in renal and nonrenal patients. Clin J Am Soc Nephrol. 2007;2:121–134. doi: 10.2215/CJN.01760506. [DOI] [PubMed] [Google Scholar]
- 52.Shlipak MG, Sarnak MJ, Katz R, Fried LF, Seliger SL, Newman AB, Siscovick DS, Stehman-Breen C. Cystatin C and the risk of death and cardiovascular events among elderly persons. N Engl J Med. 2005;352:2049–2060. doi: 10.1056/NEJMoa043161. [DOI] [PubMed] [Google Scholar]
- 53.Suominen V, Rantanen T, Venermo M, Saarinen J, Salenius J. Prevalence and Risk Factors of PAD among Patients with Elevated ABI. Eur J Vasc Endovasc Surg. 2008;35:709–714. doi: 10.1016/j.ejvs.2008.01.013. [DOI] [PubMed] [Google Scholar]
- 54.Aboyans V, Ho E, Denenberg JO, Ho LA, Natarajan L, Criqui MH. The association between elevated ankle systolic pressures and peripheral occlusive arterial disease in diabetic and nondiabetic subjects. J Vasc Surg. 2008 doi: 10.1016/j.jvs.2008.06.005. [DOI] [PubMed] [Google Scholar]
- 55.de Vinuesa SG, Ortega M, Martinez P, Goicoechea M, Campdera FG, Luno J. Subclinical peripheral arterial disease in patients with chronic kidney disease: prevalence and related risk factors. Kidney Int Suppl. 2005:S44–47. doi: 10.1111/j.1523-1755.2005.09310.x. [DOI] [PubMed] [Google Scholar]
- 56.Sigurdsson G, Duprez DA, Hirsch AT, Florea N, Hoke L, Cohn JN. Supranormal ankle brachial index is associated with favorable exercise blood pressure response. American Journal of Hypertension [Abstract] 2003;16:161A. [Google Scholar]
- 57.Rule AD, Larson TS, Bergstralh EJ, Slezak JM, Jacobsen SJ, Cosio FG. Using serum creatinine to estimate glomerular filtration rate: accuracy in good health and in chronic kidney disease. Ann Intern Med. 2004;141:929–937. doi: 10.7326/0003-4819-141-12-200412210-00009. [DOI] [PubMed] [Google Scholar]
- 58.Perkins BA, Nelson RG, Ostrander BE, Blouch KL, Krolewski AS, Myers BD, Warram JH. Detection of renal function decline in patients with diabetes and normal or elevated GFR by serial measurements of serum cystatin C concentration: results of a 4-year follow-up study. J Am Soc Nephrol. 2005;16:1404–1412. doi: 10.1681/ASN.2004100854. [DOI] [PMC free article] [PubMed] [Google Scholar]
- 59.Mussap M, Dalla Vestra M, Fioretto P, Saller A, Varagnolo M, Nosadini R, Plebani M. Cystatin C is a more sensitive marker than creatinine for the estimation of GFR in type 2 diabetic patients. Kidney Int. 2002;61:1453–1461. doi: 10.1046/j.1523-1755.2002.00253.x. [DOI] [PubMed] [Google Scholar]
- 60.Randers E, Erlandsen EJ, Pedersen OL, Hasling C, Danielsen H. Serum cystatin C as an endogenous parameter of the renal function in patients with normal to moderately impaired kidney function. Clin Nephrol. 2000;54:203–209. [PubMed] [Google Scholar]
- 61.Resnick HE, Foster GL. Prevalence of elevated ankle-brachial index in the United States 1999 to 2002. Am J Med. 2005;118:676–679. doi: 10.1016/j.amjmed.2004.11.025. [DOI] [PubMed] [Google Scholar]