Abstract
Background
The close relationship between human health, performance, well-being and the thermal environment is obvious. Nevertheless, most studies of climate and climate change impacts show amazing shortcomings in the assessment of the environment. Populations living in different climates have different susceptibilities, due to socio-economic reasons, and different customary behavioural adaptations. The global distribution of risks of hazardous thermal exposure has not been analysed before.
Objective
To produce maps of the baseline and future bioclimate that allows a direct comparison of the differences in the vulnerability of populations to thermal stress across the world.
Design
The required climatological data fields are obtained from climate simulations with the global General Circulation Model ECHAM4 in T106-resolution. For the thermo-physiologically relevant assessment of these climate data a complete heat budget model of the human being, the ‘Perceived Temperature’ procedure has been applied which already comprises adaptation by clothing to a certain degree. Short-term physiological acclimatisation is considered via Health Related Assessment of the Thermal Environment.
Results
The global maps 1971–1980 (control run, assumed as baseline climate) show a pattern of thermal stress intensities as frequencies of heat. The heat load for people living in warm–humid climates is the highest. Climate change will lead to clear differences in health-related thermal stress between baseline climate and the future bioclimate 2041–2050 based on the ‘business-as-usual’ greenhouse gas scenario IS92a. The majority of the world's population will be faced with more frequent and more intense heat strain in spite of an assumed level of acclimatisation. Further adaptation measures are crucial in order to reduce the vulnerability of the populations.
Conclusions
This bioclimatology analysis provides a tool for various questions in climate and climate change impact research. Considerations of regional or local scale require climate simulations with higher resolution. As adaptation is the key term in understanding the role of climate/climate change for human health, performance and well-being, further research in this field is crucial.
Keywords: climate impact research, thermal assessment, acclimatisation, heat load, cold stress, bioclimate mapping, Perceived Temperature
Climate and climate change is predominately considered based on standard climate parameters such as air temperature or precipitation in time and space. Even in epidemiology, most of the studies relate just air temperature to data of health outcome (e.g. ‘temperature-related mortality’) (1). This is remarkable since the relationship of human beings to the thermal environment requires a more comprehensive consideration. The term ‘thermal environment’ encompasses both the atmospheric heat exchanges with the body (thermal stress) and the body's physiological response (thermal strain).
The close relationship of humans to the thermal component of the atmospheric environment belongs to everybody's daily experience. The hot summer of 2003 in Europe (2) when about 55,000 heat-related extra deaths occurred (3) is a good example of the significance of the thermal environment for human health (1, 4, 5). Balancing the human heat budget to variable environmental and metabolic heat loads is controlled by a very efficient (for healthy people) autonomous thermoregulatory system. This is supported by behavioural adaptation (e.g. eating and drinking, activity and resting, clothing, exposure, housing and migration) driven by conscious sensations of thermal discomfort. Such adaptation enables the human being to live and work in virtually any climate zone on Earth, albeit with varying degrees of discomfort and strain.
Internal heat is produced via metabolic activity required to perform mental and physical activities. The body exchanges heat by convection (sensible heat flux), conduction (contact with solids), evaporation (latent heat flux), radiation (long and short-wave) and respiration (latent and sensible). Thus, assessing the human thermal environment requires application of a complete heat budget model that takes all mechanisms of heat exchange into account (6–9).
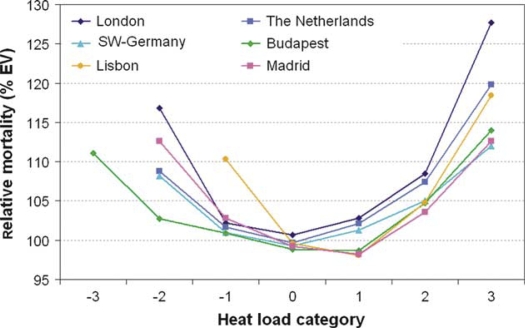
Similar statistical relationships between mortality and thermal stress are found across the world (10, 11). However, populations living in different climates respond differently to heat stress due to some degree of physiological and behavioural acclimatisation. Fig. 1 shows, based on the application of a complete heat budget, that the impact of different thermal stress categories on relative mortality (defined as the number of deaths relative to the expected mortality) varies between European cities and areas (10). During days with no thermal stress or only slight deviation to the warm side (i.e. no thermal strain), small deviations of mortality from the expected value EV = 100% occur (Fig. 1). As thermal stress (heat or cold) becomes more extreme, mortality increases in different ways for ‘Normally cold’ places and ‘Normally hot’ places.
Fig. 1.
Thermal stress-related mortality as deviation from the expected value for selected European cities and areas 1986–1996 during different thermal stress categories (after 36 and 37). −3, strong cold stress; −2, moderate cold stress; −1, slight cold stress; 0, thermal comfort (no thermal stress); 1, slight heat load; 2, moderate heat load; 3, strong heat load, taking acclimatisation into account.
With the help of thermal assessment models, climatological information can be transformed into bioclimatological information. The climate data (observations at weather stations or output of numerical modelling) can be spatially presented in maps using geographical information system (GIS) techniques or grid data from model outputs. In this way, the bioclimate of heat and/or cold stress has been presented for New Zealand (12), Canada (13), Northern China (14) and Germany (15, 16). The German bioclimate maps were based on Fanger's (6) Predicted Mean Vote (PMV)-equation using 30 years of hourly data from weather stations. A similar approach was used for Greece (17) and Austria (18). Some modern approaches were also combined for the human bioclimatic atlas for Mexico (19). Based on 30 years time series of three-hourly meteorological data of more than 900 weather stations across Europe, Perceived Temperature (PT) maps were produced presenting the frequency of heat load and cold stress using an acclimatisation approach (20).
In a first attempt to describe human thermal stress on a global scale the PMV-equation was applied to simulation data from the global General Circulation Model (GCM) ECHAM4/T106 of the Max Planck-Institute for Meteorology Hamburg/Germany (21). However, the PMV approach underestimated the role of humidity in warm conditions. Recently, global maps of the distribution of seasonal mean values of the Physiological Equivalent Temperature (PET) (22) for the current and a future climate were published (23). These are an improvement, but from a health impact point of view the frequency of exceeding thresholds may be more appropriate than the mean PET values. This report will demonstrate maps of the global distribution of threshold exceeding using improved thermal stress estimates.
Materials and methods
The thermal assessment procedure
The heat exchange between the human body and the thermal environment can be described in the form of the energy balance equation, an application of the first theorem of thermodynamics applied to the body's heat sources (metabolism and environmental) and the various avenues of heat loss to environment (see Method box 1) (24).
Among the advanced heat budget models, Fanger's PMV-equation (6, 26) can be considered as appropriate if Gagge et al.'s (27) improvement in the description of latent heat fluxes by the introduction of PMV* is applied. Together with a radiation model this approach combines the operational thermal assessment procedure ‘Klima–Michel’-model (KMM) (28–30) of the German national weather service Deutscher Wetterdienst (DWD) with the output parameter (descriptive term) ‘Perceived Temperature, PT’ (31). PT follows the PET approach (22, 32), Standard Effective Temperature (SET) (27), or Outdoor Standard Effective Temperature (Out_SET) (33, 34) in order to achieve a descriptive term in °C. PT is defined as the air temperature of a standard environment (wind calm, air temperature = mean radiant temperature, relative humidity (RH) = 50%, metabolic rate 2.3 MET = 135 Wm−2, which means walking at 4 kmh−1) that would produce the same thermal stress as the actual environment (Table 1). Additionally, optimal behavioural adaptation by clothing (along the scale from the thermal resistance of summer clothing (0.5 clo) to winter clothing (1.75 clo) (1 clo = 0.155 Km2W−1) is considered based on ISO 9920 (35). It is assumed that people adapt their behaviour in order to gain comfortable conditions. The PT scale (Table 1) refers to the ASHRAE-Scale (ISO 7730) (26) extended to a nine-step scale.
Table 1.
Perceived Temperature, Predicted Mean Vote (According to (6)), and corresponding thermal stress (Initial conditions without acclimatisation; negative values are ‘cold stress’ and positive values are ‘heat load’)
| Thermal stress category | Perceived Temperature (PT) in °C | Predicted Mean Vote (PMV) | Thermo-physiological stress |
|---|---|---|---|
| 4 | PT≥ +38 | Very hot | Extreme heat load |
| 3 | +32≤ PT<+38 | Hot | Strong heat load |
| 2 | +26≤ PT<+32 | Warm | Moderate heat load |
| 1 | +20≤ PT<+26 | Slightly warm | Slight heat load |
| 0 | 0<PT<+20 | Comfortable | None |
| −1 | −13<PT≤ 0 | Slightly cool | Slight cold stress |
| −2 | −26<PT≤−13 | Cool | Moderate cold stress |
| −3 | −39<PT≤ −26 | Cold | Strong cold stress |
| −4 | PT≤ −39 | Very cold | Extreme cold stress |
Method box 1. Heat exchange.
| 1 |
- M
metabolic rate (activity)
- W
mechanical power
- S
storage (change in heat content of the body)
Peripheral (skin) heat exchanges
- QH
turbulent flux of sensible heat
- Q*
radiation budget
- QL
turbulent flux of latent heat (diffusion of water vapour)
- QSW
turbulent flux of latent heat (sweat evaporation)
Respiratory heat exchanges
- QRe
respiratory heat flux (sensible and latent)
Thermal environmental parameters
- Ta
air temperature
- Tmrt
mean radiant temperature
- v
wind velocity relative to the body
- e
water vapour pressure
The meteorological input variables include air temperature T a, water vapour pressure e, wind velocity v and mean radiant temperature T mrt including short and long-wave radiation fluxes, in addition to metabolic rate and clothing insulation. In Eq. (1) the appropriate meteorological variables are attached to the relevant energy fluxes in W/m2. The physiological (internal) variables, such as the temperature of the core or the skin, the sweat rate, and the skin wetness, which all interact with the environmental heat conditions, are not mentioned here. An overview on the basics in thermo-physiology and heat exchange modelling with respect to adaptation is given e.g. in (25).
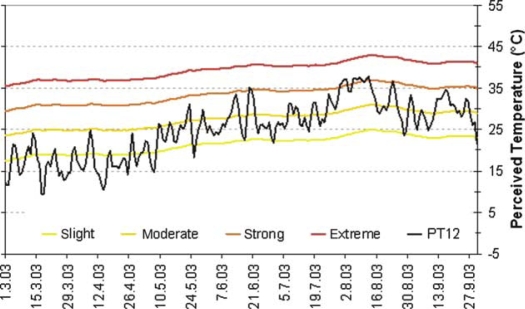
The PT procedure incorporates the acclimatisation approach Health Related Assessment of the Thermal Environment (HeRATE) (36). HeRATE is a conceptual model of short-term acclimatisation based on findings in adaptation studies. The procedure modifies the absolute PT thresholds of Table 1 by superimposing the (relative) historic experience of the population in terms of PT of the previous weeks. Using the example of Lisbon 2003, Fig. 2 shows how the actual thresholds for the different thermal stress categories change from the initial values of Table 1. This procedure has the advantage that the index can be used without modification in different climate regions and during different times of the year without the need to artificially define seasons and calibrate it to a particular locale.
Fig. 2.
Example of daily values of Perceived Temperature at 12 UTC (black line) for the weather station Lisbon (Portugal) from March to September 2003 (36). Compared to Table 1 the coloured lines indicate the variable thresholds for the different thermal stress categories specifying acclimatisation.
Climatological input
For global bioclimate maps no sufficient observational data base is available. However, the necessary meteorological input data for the global scale can be taken either from global GCMs or from reanalyses of Numerical Weather Prediction (NWP) models (e.g. European Centre for Medium-Range Weather Forecasts (ECMWF), Reading/UK, or National Centers for Environmental Prediction (NCEP), Camp Springs/USA). In this investigation we use two runs of the global GCM ECHAM4 (38) at the relatively high resolution T106 (39), about 100 km grid-point distance in middle latitudes (see Method box 2).
Due to restricted computer power, only two ‘time slices’ with a length of 10 years each are available in the high-resolution version of the GCM. In the first experiment (control run) the concentration of greenhouse gases is set constant at the observed level 1971–1980 (recent climate conditions). In the second run the concentration of greenhouse gases is taken from the IPCC-scenario IS92a ‘business-as-usual’ (40) for the period 2041–2050. This scenario is between the two middle range scenarios A1B and A2 used in the report of the Intergovernmental Panel on Climate Change (IPCC) (41).
Calculation of the thermal environment
Using the model output data of ECHAM4/T106, the values of PT were calculated for the different time periods for each land-grid point and four Universal Times (UTC) at 00.00, 06.00, 12.00 and 18.00. In order to obtain comparable PT values, the predominant effect of the daily thermal variation was considered by recalculating corrected PT values for 12 Mean Local Time (MLT) for all grid points by a nonlinear interpolation procedure centred around the four neighbouring PT values at the given UTC times. For the given six-hour intervals the maximum mean error of this procedure is in the order of 1 K (=1°C), which was tested with observational data of a couple of European weather stations with a time resolution of one hour.
Method box 2. ECHAM4-details.
The global GCM ECHAM4 applies the relatively high resolution T106, about 100 km grid-point distance in middle latitudes (39). In both experiments (time slices), the surface of the earth is represented by 320×160 grid points which means a distance of about 1.1° in zonal and meridional direction. The GCM-data are available at fixed times 00.00, 06.00, 12.00 and 18.00 Universal Time (UTC). The meteorological variables required for the assessment are air temperature T a, dew point T d (to derive water vapour pressure) and wind velocity v, which are directly used to calculate the sensible and latent heat flux. In addition to these, for the parameterisation of the long-wave and short-wave radiant fluxes, cloudiness information such as total cloud cover N and cloud cover in the different tropospheric levels (low, middle and high) are used to calculate mean radiant temperature Tmrt.
The maps of PT values are related to people staying outdoors at noon (12 MLT). Because PTmax usually occurs one or two hours later, the PT value at 12 MLT can be considered as a mean value over a certain time period starting some time before 12 MLT until some time after the same PT value as at 12 MLT occurs once more in the afternoon.
From these 12 MLT PT-time-series at every land-grid point the mean annual frequency (number of days p.a.) of comfort conditions (no thermal stress) or different intensities of thermal stress, respectively, has been derived for the two ECHAM4 time slices 1971–1980 and 2041–2050, taking acclimatisation into account according to HeRATE. The actual PT value for a certain thermal stress level at a given point and a given date always depends on the previous thermal conditions. The difference between the time periods (2041–2050) and (1971–1980) can be interpreted as the change in the bioclimate.
Results
The current thermal conditions
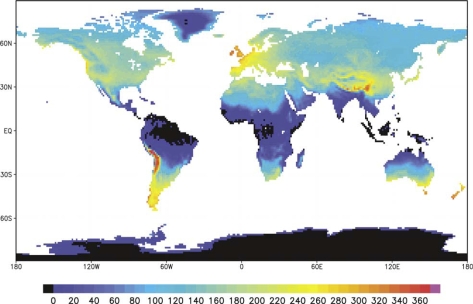
The map of the frequency distribution of thermal comfort (i.e. no thermal stress) 1971–1980 shows that the mid-latitude regions are most comfortable, in particular in the maritime affected areas (Fig. 3). This is true for Western Europe, New Zealand, the southern parts of Australia, Chile and Argentina as well as a narrow coast strip in the west of North-America where 300 days with thermal comfort at 12 MLT can be taken as typical. Similar conditions can be found in higher elevations of the Andes and in the area of the foothills of the Himalayas. With increasing continental influence in mid-latitudes or increasing subtropical influence, the number of days with comfort conditions decreases considerably. In the lowlands of the humid tropics thermal comfort is not possible at 12 MLT. This is also true for the ice shield regions of Antarctica and Greenland due to the limit to maximum clothing insulation of 1.75 clo which is used here.
Fig. 3.
Mean annual frequency of comfortable conditions (no thermal stress) at 12 MLT (=noon) taking acclimatisation into account based on ECHAM4/T106-data 1971–1980.
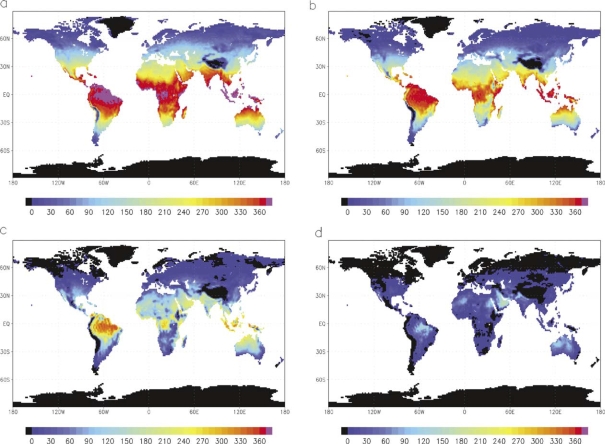
The general relationship of heat load conditions to latitude (solar climate) is evident (Fig. 4a), although it is influenced by altitude. Heat load is the predominant thermal state in the tropics throughout the year. With increasing latitude the heat load probability declines, but even in moderate climates a considerable number of days with heat load can still be expected. Here the maritime influence in the area of the western coast lines is reproduced.
Fig. 4.
(a–d) Mean annual frequency of exceeding the threshold for (a) heat load, (b) moderate heat load, (c) strong heat load and (d) extreme heat load at 12 MLT taking acclimatisation into account, based on ECHAM4/T106-data 1971–1980.
From a health point of view, higher heat load intensities become more relevant. Compared to Fig. 4a the area with at least moderate heat load conditions (Fig. 4b) is of course smaller and now almost covers those regions of the world known for tropical or subtropical climate. In the equator region even moderate heat load occurs almost every day. The presentations of the frequency of at least strong (Fig. 4c) and extreme (Fig. 4d) heat load isolate the regions further. It is interesting, for example, that Saudi Arabia shows the most days with extreme heat load (>170 days) while the threshold for at least strong heat load is more frequently exceeded in the Amazon basin and in Indonesia (>300 days).
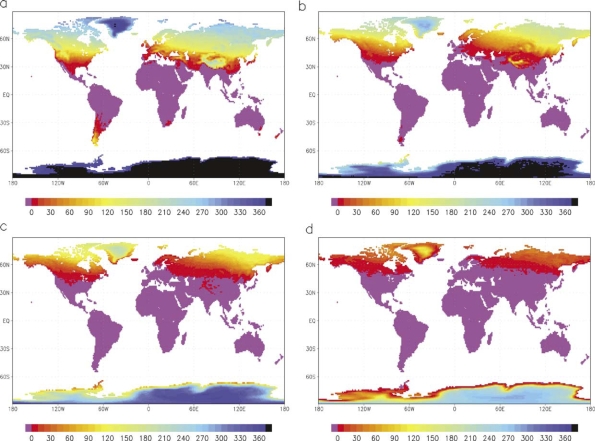
The zonal variation in the thermal conditions is also found in the distribution of cold stress (‘in spite of winter clothing with 1.75 clo!’; Fig. 5a). While almost every day cold stress occurs in Antarctica, followed by less than one-third of the time span of a year over the southern tip of South-America (Tierra del Fuego), the northern hemisphere shows a more differentiated pattern due to superimposed topography and position relative to the sea. The frequency of cold stress in the tropical and subtropical regions is zero or close to that. When the thresholds for cold stress are tightened in the given definitions (Fig. 5b–d) the borders recede considerably step by step. Extreme cold stress can only be found some distance away from the coast over the ice shields of Antarctica almost every day (Fig. 5d). In central Greenland, the most extreme region in the northern hemisphere, the frequency of such cold conditions is ‘only’ marginally above 200 days a year. With respect to health consequences it is interesting to note that the regions showing at least moderate cold stress (Fig. 5b) have low population densities.
Fig. 5.
(a–d) Mean annual frequency of exceeding the threshold for (a) cold stress, (b) moderate cold stress, (c) strong cold stress and (d) extreme cold stress at 12 MLT taking acclimatisation into account, based on ECHAM4/T106-data 1971–1980.
The spatial distribution of the thermal conditions across Europe looks very similar to maps based on data from 918 European weather stations 1971/2000 (20, 21).
Thermal stress conditions in a future climate
The ECHAM4/T106 simulation of the climate in the period 2041–2050 (‘Future’) uses the IPCC IS92a ‘business-as-usual’ scenario. Figs. 6–8 show the difference between the predicted future bioclimate and the 1971–1980 thermal conditions.
Fig. 6.
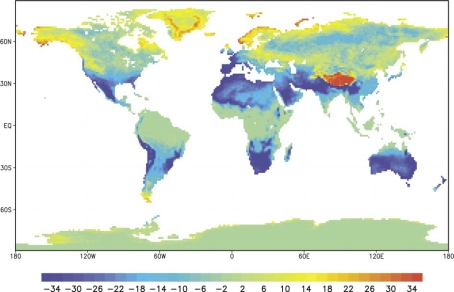
Difference of the mean annual frequency of comfortable conditions (no thermal stress) at 12 MLT between future and recent climate taking acclimatisation into account, based on ECHAM4/T106-data (2041–2050 and 1971–1980).
Fig. 8.
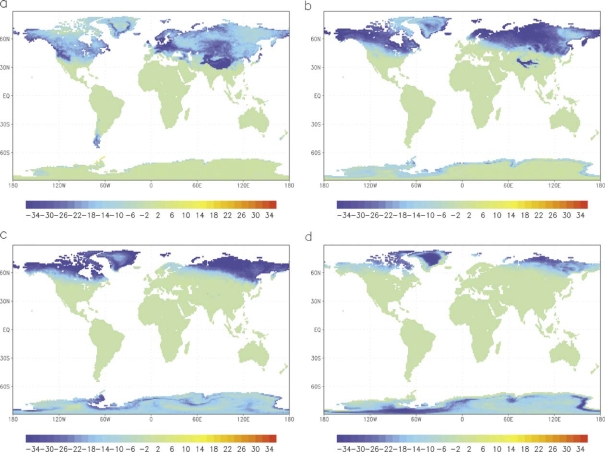
(a–d) Difference of the mean annual frequency of exceeding the threshold for (a) cold stress, (b) moderate cold stress, (c) strong cold stress and (d) extreme cold stress at 12 MLT taking acclimatisation into account, based on ECHAM4/T106-data (2041–2050 and 1971–1980).
Both the humid tropics and Antarctica are characterised by already lacking comfort conditions (permanent heat load or cold stress conditions, respectively) (Fig. 6), and these will remain. The most pronounced decrease in comfort will happen in the subtropics up to the middle latitudes (moderate climate). An increase in comfortable conditions is mainly limited to cold areas with low population density, maybe with the exception of southern Scandinavia, parts of Russia, China, the northwest of the USA, and British Columbia in Canada.
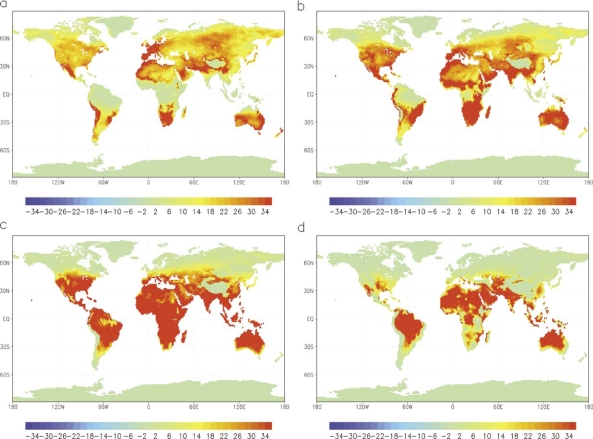
The distribution of the changes of the annual frequencies of heat load (Fig. 7a–d) shows that almost all regions will become hotter. In the tropics there is no increase of the ‘all heat load conditions’ (Fig. 7a) or ‘at least moderate heat load’ (Fig. 7b) as these are already exceeded. There is a considerable increase in heat load in the subtropics and higher latitudes. While the affected areas are becoming smaller with tightening thresholds the opposite is the case in the tropics and subtropics (Fig. 7c and d). Although the characteristics are different, almost all densely populated areas are affected by the increase of adverse thermal conditions due to climate change.
Fig. 7.
(a–d) Difference of the mean annual frequency of exceeding the threshold for (a) heat load, (b) moderate heat load, (c) strong heat load and (d) extreme heat load at 12 MLT taking acclimatisation into account, based on ECHAM4/T106-data (2041–2050 and 1971–1980).
As is nowadays the case, no cold stress will occur in the tropics and subtropics also in a future climate (Fig. 8a–d). The most densely populated areas will never be affected by extreme or even strong cold stress. In moderate climates a considerable reduction in the frequency of cold stress can be expected (Fig. 8a). The ‘at least moderate cold stress’ situation in the area of the Great Lake District in North-America, Scandinavia and Russia will be improved (Fig. 8b) while a significant decrease in stronger cold stress will occur in practically non-populated regions (Fig. 8c and d).
Discussion
Climate modelling provides global-wide time series of grid data for every day at several (here four) hourly time points, and here we used ECHAM4 time-slice modelling assuming the ‘business-as-usual’ green house gas scenario. In order to estimate impacts of climate or climate change on human health and well-being, a specific physiologically relevant assessment of the climate data is required. This assessment must be based on heat exchange theory taking all mechanism of heat exchange into account, which results in heat budget models such as the PT procedure. Such models have the ability to correctly assess the climatological variables: air temperature, mean radiant temperature, wind velocity and water vapour pressure. It is likely that our assessment procedure can be applied across the world because thermo-physiology functions are fundamentally the same in all populations. At the population level (neglecting age, gender and inter-individual differences) the susceptibility to thermal stress is mainly controlled by physiological and behavioural adaptation. The psychological aspects of how people assess and prefer climate sensation (see e.g. 42, 43) are not subject of this study. Thermal comfort in our study stands for ‘no stress’ which means no physiological strain.
Societies have always adapted their cultures to meet the climate requirements (11, 44). Clothing (see e.g. ‘adaptive model’ by 45, 46), building design, food and drinking habits, working hours (siesta), avoiding outdoors activities during the hottest time of the day, lowering metabolic rate, etc. are some examples of behavioural adaptation that reduces exposure to thermal stress. If acclimatisation were perfect no adverse health effects of climate would be expected, but numerous publications report health impacts of climate indicating that societies are not able to adapt completely.
Acclimatisation (=adaptation to climate) is here considered firstly by assuming reasonable behaviour of the target group ‘general population’ with respect to clothing. The range of clo-values between 0.5 and 1.75 refers to moderate climate experience. Although there is some evidence that in cold winter climates the general population is not used to wearing more protective clothing thus limiting obviously their time for staying outdoors, this is certainly not true for people (not considered here) with particular activities such as soldiers, rangers, hunters, skiers who are able to avoid any cold stress by appropriate special clothing. Typical Inuit clothing (4.0 clo) would actually produce approximate comfort under the predominant conditions in extreme cold winter climates. The applied lower value 0.5 clo is already almost at the lower possible end. Shorts instead of jeans as often used by people in the tropics reduce the clo-value to 0.4 which would slightly reduce heat load.
Secondly, the acclimatisation approach HeRATE adjusts the initial thermal thresholds automatically to the prevailing local climate. In the warm–humid tropics and in the hot subtropics this often results in an increase of the thresholds for the different heat load intensities of 6–8°C. However, possible long-term (over years and decades) acclimatisation has not been considered due to the lack of a quantitative approach. Additionally the assessment procedure focuses on the population level which means people walking outdoors with a given metabolic rate of 2.3 MET (135 Wm−2). Reducing the MET activity could be assumed under heat load conditions as an adaptation measure of the population if no specific work intensities are required. This was not included in the PT standardisation. Thus, the calculated heat load conditions are probably overestimated. On the other hand there are many outdoor working conditions requiring much higher metabolic rates. In tropical and sub-tropical climates the obstruction of heat release from the body can very quickly produce extreme heat load conditions in a working individual which significantly differ from the assessments in our analysis for an assumed general public.
With the help of PT and HeRATE, the current and predicted thermal environment is described in health-related frequencies of exceeding locally adapted thresholds based on daily values at a fixed time (noon = 12 MLT) which is representative for a few hours around noon. This makes a big difference to the usual consideration of climate and climate change based on monthly or annual mean values of air temperature. In terms of both comfort and the absence of intense thermal stress, the mid-latitude areas are ‘privileged’ while comfortable or only slight heat load conditions only rarely occur in the humid tropics. The distribution of heat load follows the solar climate to a great extent, while it is modified by maritime or continental influences and altitude. In the tropics and subtropics a huge number of human beings are affected by heat stress, particularly in Asia and Africa. In tropical and sub-tropical areas, where extreme heat load is already common, climate change will make ‘extreme heat load’ even more ‘extreme’ with significant impacts on health and well-being of populations living in these areas.
Of course these societies apply some behavioural adaptation measures but the dramatically increased – and from a greenhouse gas point of view contra productive – use of air-conditioning systems in these countries by those who have the financial capabilities indicates that they are not satisfied with the existing climate. The problem increases because in rapidly growing cities traditional buildings which relied on local experience in climate-related building design, is no longer realised. In addition, the urban heat island effect in large cities is already greater than the predicted climate change until the end of this century, and the public health risks are significant. By contrast, major cold stress is limited to sparsely populated areas.
When considering the fact that (a) almost the entire population of the world lives in areas indicated by yellow or red colours in the presentation of the changes (see Fig. 7c) and (b) already exceeding the threshold for moderate heat load would increase mortality (at least based on studies in moderate climates), the public health issue of this aspect of climate change becomes evident. This would also be true if, due to an underestimation of the effect of acclimatisation in the applied procedure, the thresholds for the different heat load intensities were actually somewhat higher. The predominant part of the world's population will belong to the ‘climate losers,’ being faced with more frequent and more intense adverse thermal conditions, while few countries or areas will belong to the ‘climate winners,’ a view on the problem that first was introduced by Auliciems in 1994 (47).
The interpretation of the results must consider the geographic scale. When looking at individual pixels, the coarse resolution (approx. 100 km in middle latitudes, 125 km at the equator) becomes evident. The daily living and working space of a human being is much smaller. The described assessment procedure can also be applied to regional climate models (see e.g. 48) are nested into global models, thus providing bioclimatological conditions with higher resolution (down-scaling). An important aspect that could be added is the urban heat island effect. Further improvements of these assessments can be expected by applying the almost finalised Universal Thermal Climate Index (UTCI; (COST 730) (49)), which is based on human response-related thermo-physiological modelling with the help of a multi-segmental, multi-layered representation of the human body (50, 51), to the new generation of climate simulation models including down-scaling.
Conclusions
The application of the thermo-physiological assessment procedure PT to climate data broadens the usual consideration of climate maps presenting only single climate data such as air temperature. The approach results in a spatial assessment of thermal stress categories which relate climate to the health and well-being of humans. This provides specific problem-oriented information to the climate and climate change, and human health relationships in general and for the estimation of the vulnerability of different populations.
Optimal conditions in terms of no or at most slight thermal stress differ significantly between the individual continents. Europe is obviously ‘privileged’ while particularly Africa and Australia suffer from heat load with highest frequency at the extremes. Asia and both the Americas lie approximately in between. In the predicted future climate, based on the ECHAM4 simulations, the most pronounced changes will occur at the extreme heat load category which will then become the most frequent condition for America as it is already now for Africa and Australia. Favourable conditions will decrease basically all over the world.
A better understanding of acclimatisation as the adaptation to climate and climate change in different time scales remains an important research issue.
Acknowledgements
We would like to thank all institutions which supported the work with data, e.g. German Weather Service (DMD) Offenbach, Max Planck-Institute for Meteorology (MPI), and German High Performance Computing Centre for Climate and Earth System Research (DKRZ) Hamburg/Germany. Special thanks to the reviewer for the numerous helpful suggestions and to Dr. David Engert, Berlin and Mrs. Bärbel Burkhardt, Freiburg, for the final check of the paper.
Conflict of interest and funding
The authors have not received any funding or benefits from industry to conduct this study.
References
- 1.Kovats SR, Jendritzky G. Heat-waves and human health. In: Menne B, Ebi KL, editors. Climate change and adaptation strategies for human health. Darmstadt, Germany: Steinkopff; 2006. pp. 63–97. [Google Scholar]
- 2.Schär C, Jendritzky G. Hot news from summer 2003. News and views. Nature. 2004;432:559–60. doi: 10.1038/432559a. [DOI] [PubMed] [Google Scholar]
- 3.Kosatsky T. The 2003 European heat waves. Euro Surveill. 2005;10:148–9. [PubMed] [Google Scholar]
- 4.Laschewski G, Jendritzky G. Effects of the thermal environment on human health: an investigation of 30 years of daily mortality data from SW Germany. Clim Res. 2002;21:91–103. [Google Scholar]
- 5.Koppe C, Kovats S, Jendritzky G, Menne B, Baumüller J, Bitan A, et al. Copenhagen, Denmark: World Health Organization, Regional Office for Europe; 2004. Heat waves – risks and responses. Health and global environmental change, Series, 2. [Google Scholar]
- 6.Fanger PO. Thermal comfort, analysis and application in environment engineering. Copenhagen, Denmark: Danish Technical Press; 1970. [Google Scholar]
- 7.Landsberg HE. The assessment of human bioclimate, a limited review of physical parameters; World Meteorological Organization, Technical Note No. 123, WMO-No. 331; 1972. [Google Scholar]
- 8.Driscoll DM. Thermal comfort indexes. Current uses and abuses. Nat Weather Digest. 1992;17:33–8. [Google Scholar]
- 9.Parsons KC. Human thermal environments: the effects of hot, moderate, and cold environments on human health, comfort and performance. London and New York: Taylor & Francis; 2003. [Google Scholar]
- 10.Kirch W, Menne B, Bertollini R. WHO. Heidelberg, Germany: Springer; 2005. Extreme weather events and public health responses. [Google Scholar]
- 11.Menne B, Ebi KL, editors. WHO. Darmstadt, Germany: Steinkopff; 2006. Climate change and adaptation strategies for human health. [Google Scholar]
- 12.de Freitas CR. Bioclimates of heat and cold stress in New Zealand. Weath Climat. 1987;7:55–60. [Google Scholar]
- 13.Auliciems A, de Freitas CR. Cold stress in Canada: a human climatic classification. Int J Biometeorol. 1976;20:287–94. doi: 10.1007/BF01553585. [DOI] [PubMed] [Google Scholar]
- 14.de Freitas CR. Human climates of Northern China. Atm Env. 1979;13:71–7. doi: 10.1016/0004-6981(79)90246-4. [DOI] [PubMed] [Google Scholar]
- 15.Jendritzky G. Das Bioklima in der Bundesrepublik Deutschland [The bioclimate of FR Germany] Gütersloh: Flöttmann; 1988. [Google Scholar]
- 16.Grätz A, Jendritzky G. Nationalatlas Bundesrepublik Deutschland. Klima, Pflanzen- und Tierwelt [National atlas of FR Germany. Climate, flora and fauna]. Leibniz-Institut für Länderkunde (Hrsg.) Heidelberg, Berlin: Spektrum Akad Verl; 2003. Bioklima – die Bedeutung des Klimas für den Menschen [Bioclimate – the significance of climate for the human being] [Google Scholar]
- 17.Matzarakis A. Human-biometeorological assessment of the climate of Greece; Dissertation in Greece, School of Geology, Aristotelian University of Thessaloniki; 1995. [Google Scholar]
- 18.Koch E, Matzarakis A, Rudel E, Zygmuntowski M. Human-Bioklima in Österreich – Die thermische Komponente [Human bioclimate in Austria – the thermal component] In: Koch E, Marktl W, Matzarakis A, Nefzger H, Rudel E, Schunder-Tatzber S, Zygmuntowski M, editors. Klimatherapie in Österreich. Broschüre zu den Potentialen der Klimatherapie in Österreich [Climate therapy in Austria. Brochure on the potentials of climate therapy in Austria] Vienna: Bundesministerium für Wirtschaft und Arbeit; 2005. pp. 7–26. [Google Scholar]
- 19.Morillon-Galvez D, Saldana-Flores R, Tejeda-Martinez A. Human bioclimatic atlas for Mexico. Sol Energy. 2004;76:781–92. [Google Scholar]
- 20.Tinz B, Jendritzky G. Macro- and mesoscale maps of the thermal environment. 17th International Congress of Biometeorology. Ann Meteorol. 2005;41:641–3. [Google Scholar]
- 21.Jendritzky G, Tinz B. Human bioclimate maps for climate impact research; Proceedings of International Conference of Biomet and International Conference on Urban Climate. ICB-ICUC '99, Sydney 1999; Geneva: WCASP; 2000. pp. 63–83. WMO/TD No. 1026. [Google Scholar]
- 22.Höppe P. The physiological equivalent temperature – a universal index for the biometeorological assessment of the thermal environment. Int J Biometeorol. 1999;43:71–5. doi: 10.1007/s004840050118. [DOI] [PubMed] [Google Scholar]
- 23.Matzarakis A, Amelung B. Physiologically equivalent temperature as indicator for impacts of climate change on thermal comfort of humans. In: Thomson MC, Garcia-Herrera R, Beniston M, editors. Seasonal forecasts, climate change and human health. Advances in global change research 30. Berlin: Springer Sciences and Business Media; 2008. pp. 161–72. [Google Scholar]
- 24.Büttner K. Leipzig, Germany: Akad Verl Ges; 1938. Physikalische Bioklimatologie. Probleme und Methoden. [Physical bioclimatology. Problems and methods] [Google Scholar]
- 25.Jendritzky G, de Dear R. Adaptation and the thermal environment. In: Ebi KL, Burton I, McGregor G, editors. Biometeorology for adaptation to climate variability and change: research frontiers and perspectives. Heidelberg, Germany: Springer; 2009. pp. 9–32. [Google Scholar]
- 26.ISO 7730. Ergonomics of the thermal environment – analytical determination and interpretation of thermal comfort using calculation of the PMV and PPD indices and local thermal comfort criteria; 2005. [Google Scholar]
- 27.Gagge AP, Fobelets AP, Berglund PE. A standard predictive index of human response to the thermal environment. ASHRAE Trans. 1986;92:709–31. [Google Scholar]
- 28.Jendritzky G, Sönning W, Swantes HJ. Ein objektives Bewertungsverfahren zur Beschreibung des thermischen Milieus in der Stadt- und Landschaftsplanung (‘Klima-Michel-Modell’). [An objective assessment procedure to specify the thermal environment in urban and landscape plannung (‘Klima-Michel model’)] Beiträge Akad Raumforschung Landesplanung Hannover. 1979;28:1–85. [Google Scholar]
- 29.Jendritzky G, Nübler W. A model analysing the urban thermal environment in physiologically significant terms. Arch Met Geoph Biokl B. 1981;29:313–26. [Google Scholar]
- 30.Jendritzky G. Bioklimatische Bewertungsgrundlage der Räume am Beispiel von mesoskaligen Bioklimakarten [Regional bioclimatological assessment procedure using meso-scale bioclimate maps as example] In: Jendritzky G, Schirmer H, Menz G, Schmidt-Kessen W, editors. Methode zur raumbezogenen Bewertung der thermischen Komponente im Bioklima des Menschen (Fortgeschriebenes Klima-Michel-Modell). [Method of a region-oriented assessment of the thermal component of human bioclimate (Updated Klima-Michel model)] Vol. 114. Beiträge Akad Raumforschung Landesplanung Hannover; 1990. pp. 7–69. [Google Scholar]
- 31.Staiger H, Bucher K, Jendritzky G. Gefühlte Temperatur. Die physiologisch gerechte Bewertung von Wärmebelastung und Kältestress beim Aufenthalt im Freien in der Maßzahl Grad Celsius [The physiological adequate assessment of heat load and cold stress in outdoor conditions in terms of degree Celsius] Ann Meteorol. 1990;33:100–7. [Google Scholar]
- 32.Mayer H, Holst J, Dostal P, Imbery F, Schindler D. Human thermal comfort in summer within an urban street canyon in Central Europe. Meteorol Z. 2008;17:241–50. [Google Scholar]
- 33.Pickup J, de Dear R. An outdoor thermal comfort index (OUT_SET*) – part I – the model and its assumptions. In: de Dear R, Kalma J, Oke T, Auliciems A, editors. Biometeorology and urban climatology at the turn of the millennium. 2000. pp. 279–83. Geneva: WCASP 50: WMO/TD No. 1026. [Google Scholar]
- 34.De Dear R, Pickup J. An outdoor thermal environment index (OUT_SET*) – part II – applications. In: De Dear R, Kalma J, Oke T, Auliciems A, editors. Biometeorology and urban climatology at the turn of the millennium. Selected Papers from the Conference ICB-ICUC'99, Sydney, 8–12 November 1999. Vol. 50. Geneva: WMO, WCASP; 2000. pp. 258–90. [Google Scholar]
- 35.ISO 9920. Ergonomics of the thermal environment – estimation of the thermal insulation and evaporative resistance of a clothing ensemble; 1995. [Google Scholar]
- 36.Koppe C, Jendritzky G. Inclusion of short-term adaptation to thermal stresses in a heat load warning procedure. Meteorol Z. 2005;14:271–8. [Google Scholar]
- 37.Koppe C. Gesundheitsrelevante Bewertung von thermischer Belastung unter Berücksichtigung der kurzfristigen Anpassung der Bevölkerung an die lokalen Witterungsverhältnisse [Health related assessment of thermal stress considering short-term adaptation of the population to local climate] Ber d Deutschen Wetterdienstes Offenbach. 2005;226:1–168. [Google Scholar]
- 38.Roeckner E, Arpe K, Bengtsson L, Christoph M, Claussen M, Dümenil L, et al. The atmospheric general circulation model ECHAM4: model description and simulation of present-day climate. Reports of the Max-Planck-Institute. Hamburg. 1996;218:1–90. [Google Scholar]
- 39.Stendel M, Roeckner E. Impacts of horizontal resolution on simulated climate statistics in ECHAM4. Reports of the Max-Planck-Institute. Hamburg. 1998;253:1–57. [Google Scholar]
- 40.Kattenberg A, Giorgi F, Grassl H, Meehl GA, Mitchell JFB, Stouffer RJ, et al. Climate models – projections of future climate. In: Houghton JT, MeiraFilho LG, Callander BA, Harris N, Kattenberg A, Maskell K, editors. Climate change 1995: the science of climate change. New York: Cambridge University Press; 1996. p. 572. [Google Scholar]
- 41.Solomon S, Qin D, Manning M, Chen Z, Marquis M, Averyt KB, et al., editors. Cambridge, UK and New York: Cambridge University Press; 2007. Climate change 2007: the physical science basis. Contribution of Working Group I to the fourth assessment report of the intergovernmental panel on climate change. Available from: http://www.ipcc.ch/ipccreports/ar4-wgl.htm [cited 27 September 2009]. [Google Scholar]
- 42.Nikolopoulou M, Baker N, Steemers K. Thermal comfort in outdoor urban spaces: understanding the human parameter. Sol Energy. 2001;3:227–35. [Google Scholar]
- 43.Knez I, Thorsson S, Eliasson I. Psychological mechanism in outdoor place and weather assessment: towards a conceptual model. Int J Biometeorol. 2009;53:101–11. doi: 10.1007/s00484-008-0194-z. [DOI] [PubMed] [Google Scholar]
- 44.Parry ML, Canziani OF, Palutikof JP, van der Linden PJ, Hanson CE, editors. Contribution of Working Group II to the Fourth Assessment Report of the Intergovernmental Panel on Climate Change. Cambridge, UK and New York: Cambridge University Press; 2007. Climate change 2007. Impacts, adaptation and vulnerability. Available from: http://www.ipcc.ch/ipccreports/ar4-wg2.htm [cited 27 September 2009]. [Google Scholar]
- 45.De Dear R, Brager G. Developing an adaptive model of thermal comfort and preference. ASHRAE Trans. 1998;104:145–67. [Google Scholar]
- 46.Brager GS, Paliaga G, de Dear R. Operable windows, personal control and occupant comfort. ASHRAE Trans. 2004;110:510–26. [Google Scholar]
- 47.Auliciems A. Thermoregulatory adaptation to global warming – winners and losers; Proceedings of the 13th International Congress of Biometeorology, Calgary, Canada; 1993. Sep 12–18, pp. 109–122. [Google Scholar]
- 48.Jacob D, Bärring L, Christensen OB, Christensen JH, Hagemann S, Hirschi M, et al. An inter-comparison of regional climate models for Europe: design of the experiments and model performance. Clim Chang. 2007;81:31–52. [Google Scholar]
- 49.COST 730. Towards a Universal Thermal Climate Index UTCI for assessing the thermal environment of the human being. MoU of COST Action 730. 2004. Available from: http://www.utci.org; [cited 27 September 2009].
- 50.Fiala D, Lomas KJ, Stohrer M. Computer prediction of human thermoregulatory and temperature responses to a wide range of environmental conditions. Int J Biometeorol. 2001;45:143–59. doi: 10.1007/s004840100099. [DOI] [PubMed] [Google Scholar]
- 51.Fiala D, Lomas KJ, Stohrer M. First principles modelling of thermal sensation responses in steady-state and transient conditions. ASHRAE Trans: Res. 2003;109:179–86. [Google Scholar]


