Abstract
Introduction
Malaria control measures such as early diagnosis and treatment, intermittent treatment of pregnant women, impregnated bed nets, indoor spraying and larval control measures are difficult to target specifically because of imprecise estimates of risk at a small-scale level. Ways of estimating local risks for malaria are therefore important.
Methods
A high-resolution satellite view from the SPOT 5 satellite during 2008 was used to generate a land cover classification in the malaria endemic lowland of North-Western Burkina Faso. For the area of a complete satellite view of 60 × 60 km, a supervised land cover classification was carried out. Ten classes were built and correlated to land cover types known for acting as Anopheles mosquito breeding sites.
Results
According to known correlations of Anopheles larvae presence and surface water-related land cover, cultivated areas in the riverine vicinity of Kossi River were shown to be one of the most favourable sites for Anopheles production. Similar conditions prevail in the South of the study region, where clayey soils and higher precipitations benefit the occurrence of surface water. Besides pools, which are often directly detectable, rice fields and occasionally flooded crops represent most appropriate habitats. On the other hand, forests, elevated regions on porous soils, grasslands and the dryer, sandy soils in the north-western part turned out to deliver fewer mosquito breeding opportunities.
Conclusions
Potential high and low risks for malaria at the village level can be differentiated from satellite data. While much remains to be done in terms of establishing correlations between remotely sensed risks and malaria disease patterns, this is a potentially useful approach which could lead to more focused disease control programmes.
Keywords: high spatial resolution, remote sensing, malaria, West Africa, Burkina Faso, Anopheles, risk mapping, SPOT 5 satellite
There is a widespread consensus on malaria control measures, including early diagnosis and treatment, intermittent treatment of pregnant women, impregnated bed nets, in-door spraying and larval control measures. The policy conundrum, however, is the low and often unfocused coverage with these measures. In the study district of Nouna, Burkina Faso, only 8% of children actually sleep under insecticide treated bed nets (and about 20% of children with fever present at health centres get appropriate treatment in case of malaria) (1, 2). Neither larval control measures nor indoor spraying is practised.
There are two different policy options to respond to this unfortunate situation in a holo-endemic area. One would propose an overall improvement of the effectiveness of health systems to deliver the control measures to the entire population. This is based on good public health practice and theory which stipulates that when conditions or risk factors are highly prevalent in a population, it is best to offer control measures to everyone irrespective of the level of risk exposure.
The alternative – unorthodox – approach proposed here is based on the assumption that the financial and logistical constraints of health systems in districts such as the one under study are so formidable that focusing measures on populations at high risk of transmission is justified. No one would challenge a temporal focus in an area of highly seasonal transmission. Following this rationale, the recent WHO malaria report (3) suggests distributing bed nets and drugs before the rainy season so that populations have better access during the peak transmission season.
In this paper, we argue that an additional spatial focus should be considered. This is based on consistent findings in the study area of very varied malaria incidence rates between even adjacent villages (4). Regions in and close to Sahel are known for very focal and seasonal transmission (5–8). The combination of the advent of low-cost high-resolution remote sensing and reports of different malaria transmission risks based on different surface water quality, size and land cover led us to carry out the current study. The main objective of this paper is to answer the question to which extent remote sensing can validly identify different larval habitats producing different malaria transmission risks. The spatial resolution of sensors is still limited to habitats at least several metres in diameter, and the revisit rate of high-resolution satellites is too low to map dynamic changes.
We are of course aware that, having answered this question, further studies would be needed on
the statistical associations between remotely sensed risk zones and actual entomological data within them;
the relationship between both entomological and remotely sensed data, and incident malaria cases and their severity, together with malaria mortality; and
the evaluation of cost effectiveness of interventions in a target area. These could be raising bed net coverage in high-risk areas, coupled with larval control and indoor spraying. This should be carried out through cluster-randomised and controlled intervention studies.
The next generation of satellites will deliver new dimensions of spatial resolution within the sub-metre range and hence allow detection of even smaller habitats. The more limiting factor will still be the flyover frequency, so even usage of a higher spatial resolution will require temporal modelling of habitat dynamics. New and original approaches on dynamics have been set up for others diseases such as Rift Valley fever in Senegal (9). The predominant percentage of prevalent surface water and related land cover is already detectable with current technology. Risks emerging from small-scale water agglomerations, e.g. puddles, skid marks, etc. that often do not evaporate completely for periods of several weeks has to be modelled from the implications of their characteristic larvae production, occurrence and duration since they cannot be detected directly via remote sensing.
Materials and methods
The study site lies in the north-western part of Burkina Faso in the Kossi district and correlates to the satellite view of the SPOT 5 satellite from 2008. In the centre of this area, which is 60 × 60 km, the village of Nouna is located at 12° 44′ N; 3° 51′ W. Most areas in this region lie on an altitude of 150–250 m above the sea level and belong to a Precambrian peneplain. Mean precipitation for Nouna during the last 10 years has been 817 mm per year. The monthly maxima during the rainy season between May and September can reach up to 350 mm. The yearly average temperature of Nouna is 27.8°C.
While some studies (10) have dealt with an extensive collection of ground data for a relatively small study site of few square kilometres, for this study wide parts of a 3,600 km2 satellite view were used to map habitats which are known to be appropriate for Anopheles gambiae breeding from other studies. A SPOT 5 (Satellite Pour l'Observation de la Terre) satellite image was utilised for this study. Since the study area was visited during late rainy season and the collection of ground truth points had to be close in time to the flyover, a satellite view of 1 September 2008 was programmed. The multispectral image used consists of three bands (red, green and near infrared) and resolution is 2.5 m per pixel. Images were received orthorectified and georeferenced (level 3) in UTM system (zone 30P).
Training zones
During the six-week field phase from August to October 2008, an overall number of 45 ground truth points were taken in different geographic regions within the satellite view in order to produce a classification scheme (Fig. 1). These ground truth points are objects in the terrain that are needed for recognising different land cover in the satellite image. Knowing the location and land cover type of ground truth points in the terrain allows the determination of similar zones in the satellite image. Ground truth points contained rice fields, sorghum, water pools, bare soil, buildings, bush, etc. Most locations were visited contemporaneously with satellite overflight; positions being recorded using GPS handheld receivers (Garmin GPS Map 76s). All ground truth objects were saved as waypoints, and some additionally as polylines using the track recording function of the GPS.
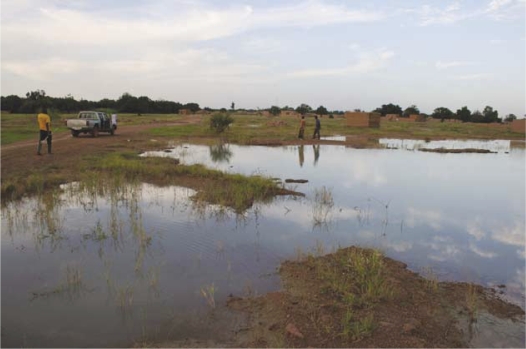
Fig. 1.
Characteristic pool in the vicinity of Nouna. In some parts it is used as brickyard while other parts show lateritic substratum on the ground. (Location: see Fig. 5).
Supervised classification
For analysis of the SPOT image ITTVIS, ENVI image processing software was used. The image was classified by using validation data collected during a six-week field study in 2008. Using the Region of Interest-Tool (ROI) in ENVI, 45 ground truthing points were used for spectral reference. These training signatures were distributed in 15 classes, which were merged later into 10 classes to run the classification. Using three bands (red, green and near infrared), the image was processed using the maximum likelihood calculation for supervised classifications. The maximum likelihood classification assumes that the statistics for each class in each band are normally distributed and calculates the probability that a given pixel belongs to a specific class. During the process each pixel is assigned to the class that has the highest probability; if the highest probability is smaller than a specified threshold, the pixel remains unclassified.
Data analysis
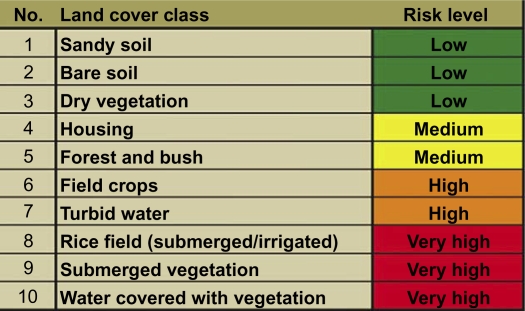
The classified satellite image was saved in ENVI as an ASCII file. The ASCII format was then transformed into a raster file using ArcMaps integrated conversion tools. This procedure allowed keeping the calculated classes in ArcMap in a selectable raster dataset. Classes were renamed and fitted to original colour set. For 30 villages, buffers of 500 m radius were constructed around the centre using ArcMaps buffer wizard. These buffer zones represent the assumed Anopheles mosquito flying range (11, 12). The surface of each class within the radius around each village was calculated. This was performed using the ‘zonal histogram’ tool in the ‘spatial analyst’ extension in ArcMap. According to data from the 2008 study, as well as to typical Anopheles presence in different land cover types known from literature, the land cover types have been evaluated (10, 13–23). Since for this region there are no existing studies that deal with absolute numbers of mosquito larvae per habitat per time, a relative risk classification was constructed. Four classes of relative mosquito larvae presence in environmental habitats from low to very high were incremented (see Fig. 2).
Fig. 2.
Land cover classes and risk levels according to various literature (10, 13–23).
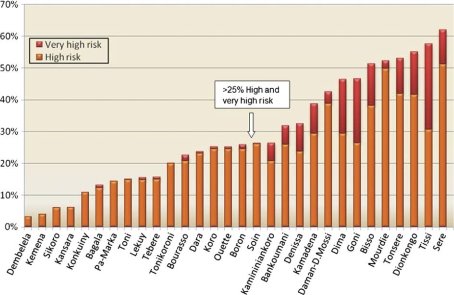
The percentage of very high and high-risk land cover within the 500 m buffer zone of all villages was compared in a diagram and sorted by percentage (see Fig. 4). On the base of this graduation, two groups of villages were featured, one with a percentage of risk-related land cover lower than 25% of area with high and very high risk, another with more than 25%. This threshold marks at the same time a significant increase in very high risk land cover per village. In ArcMap, villages were redrawn on the satellite image indicating their calculated risk (see Fig. 5).
Fig. 4.
Percentage of land cover areas with elevated risk for Anopheles larvae breeding of total surface in 500 m buffer zones around 30 villages.
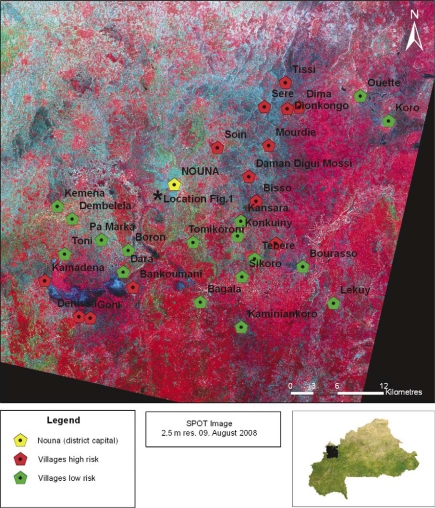
Fig. 5.
Villages with similar land cover risk in their 500 m buffer zones. Similar risks show spatial agglomeration in certain zones. Villages with high-risk habitats exceeding the 25% threshold in Fig. 4 have significantly higher land cover with very high risk (red columns in Fig. 4). The asterisk marks the position where Fig. 1 was photographed.
Results
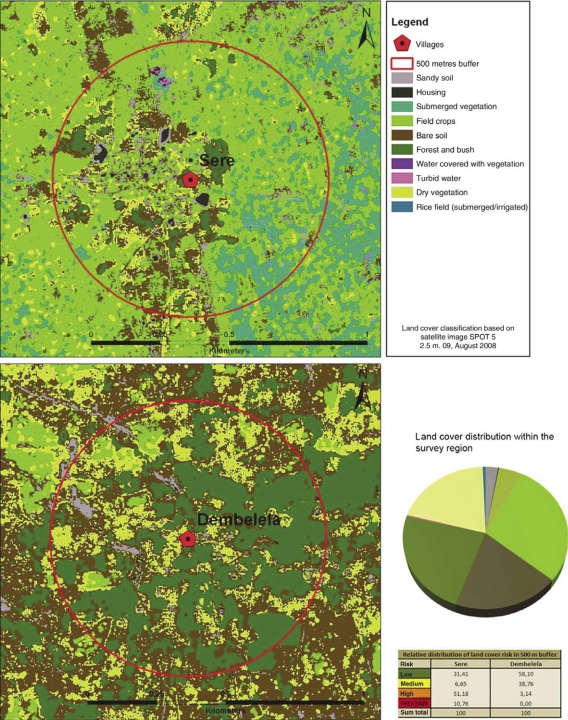
For the 30 villages included in the local demographic surveillance system, the area of potential habitats with very high risk (submerged and irrigated rice fields, water covered with vegetation and submerged vegetation) and high risk (field crops with clayey soil and turbid water) was calculated for the 500 m buffer zone. The share of total surface accounted for by very high and high-risk habitats within the buffers showed a difference between the lowest and highest by nearly a factor of 20. Some villages (Dembelela) had around 3% of surface within the 500 m buffer covered with very high and high-risk habitats, while it reached up to 60% in the vicinity of other villages (Sere, Tissi). This is shown in Fig. 3.
Fig. 3.
Land cover distribution in 500 m buffer zone around the villages of Sere (highest risk) and Dembelela (lowest risk). Land cover risk within the survey region (pie diagram, same legend).
Villages that already showed a high percentage of high-risk land cover within their 500 m buffer zone also had a higher percentage of very high-risk land cover types (see Fig. 4). Since risk is defined as appropriateness for larvae breeding, which is bound to surface water, the results show that an underlying factor exists that influences the presence or absence of both risk types at the same time.
Villages with similar risks turned out not to be randomly distributed over the survey area but lay together in certain regions. Two zones around villages with elevated risk (risk-related land cover share higher than 25%) and three zones containing villages at lower risk could be separated (see Fig. 5). These zones alternated from South-West to North-East. This remarkable difference in distribution of natural and anthropogenic land cover between regions seems to have its origin in the natural distribution of geographic and geologic factors. Suitable factors could be the prevailing type of soil and or as additional effect depressions in topography. Those depressions played a role in regional water distribution although only showing height differences of 15 m or less. Since the survey region was relatively small and risk zones alternated within it, climatic differences do not seem capable of explaining those distributions. Soil types in this region often vary within small areas and show considerable differences in infiltration behaviour and water retention capacity. Some areas have mostly sandy soils, which leads to less environmental water reservoirs. Regions with clayey soils often show swampy characteristics during the rainy season and keep water for several days or weeks. Lateritic crusts at the surface are a prevalent type of substratum as well and allow nearly no infiltration but high runoff rates (see Fig. 5).
Discussion
We showed and validated with ground data that high-resolution satellite images can indeed identify small-scale habitats with sizes of only few metres diameter conducive to Anopheles larvae development. Micro habitats in the sub-metre scale are not directly detectable at the current state of technology, but need imputation via modelling in further studies. Those micro-habitats mainly play a role within villages where they are close to the population and this mostly during the peak of the rainy season. After more than one week without precipitation they mostly evaporate or are infiltrated and cannot act as productive habitats. Being not directly detectable, these micro-habitats need to be estimated by their average occurrence in typical villages and their occurrence attached to different land cover types. The extremely varied micro-distribution of risks between villages is compatible with the findings of Yé et al. (24), who reported considerable differences in malaria incidence between villages in the region.
The most extensive work on geographical variation of malaria risk in Africa has been made at the continental scale, based on meteorological data and historical ground data from various sites across the continent (25, 26), but using a much coarser resolution and were not useful for malaria control at the district level. At the time those studies were carried out, the current resolution was not available. Studies mapping Anopheles mosquito breeding habitats, transmission or disease, partly with higher resolution, have been made in Africa (8, 22, 25, 27–31) and South and Central America (32–35). Reliable information about vector density and malaria transmission risk is essential for understanding variations in local disease epidemiology and to stratify intervention programmes. The next step is to correlate malaria case data from the demographic surveillance system with the risk modelled by using high-resolution satellite imagery.
We are aware that there is a long and non-linear causal pathway between the number of larvae in a given habitat and the incidence, severity and cause-specific mortality of malaria so we urge for prudence in interpreting our data. Our mapping of villages into two risk categories for malaria transmission is a first step towards exploring the usefulness of targeted control measures. As pointed out in the introduction, our findings need to be connected with entomological and clinical data. On the basis of further results the application of counter measures can be considered. Since risk seems to be focused on certain zones, interventions like bed net distribution and indoor-spraying, but also the use of bacteria produced toxins that selectively kill larvae of certain mosquito species (36) seem to be putative approaches. It will only be after carefully designed intervention studies that any policy implications can be considered.
Conflict of interest and funding
The authors have not received any funding or benefits from industry to conduct this study.
References
- 1.Krause G, Sauerborn R. Comprehensive community effectiveness of health care. A study of malaria treatment in children and adults in rural Burkina Faso. Ann Trop Paediatr. 2000;20:273–82. doi: 10.1080/02724936.2000.11748147. [DOI] [PubMed] [Google Scholar]
- 2.Pfeiffer K, Somé F, Müller O, Sie A, Kouyate B, Haefeli WE, et al. Clinical diagnosis of malaria and the risk of chloroquine self-medication in rural health centres in Burkina Faso. Trop Med Int Health. 2008;13:418–26. doi: 10.1111/j.1365-3156.2008.02017.x. [DOI] [PubMed] [Google Scholar]
- 3.WHO. World malaria report. Geneva, Switzerland: WHO; 2008. [Google Scholar]
- 4.Yé Y, Hoshen M, Louis V, Simboro S, Traoré I, Sauerborn R. Housing conditions and Plasmodium falciparum infection: protective effect of iron-sheet roofed houses. Malar J. 2006;5:8–15. doi: 10.1186/1475-2875-5-8. [DOI] [PMC free article] [PubMed] [Google Scholar]
- 5.Briet OJT, Dossou-Yovo J, Akodo E, van de Giesen N, Teuscher TM. The relationship between Anopheles gambiae density and rice cultivation in the savannah zone and forest zone of Cote d'Ivoire. Trop Med Int Health. 2003;8:439–48. doi: 10.1046/j.1365-3156.2003.01054.x. [DOI] [PubMed] [Google Scholar]
- 6.Diuk-Wasser MA, Toure MB, Dolo G, Bagayoko M, Sogoba N, Sissoko I, et al. Effect of rice cultivation patterns on malaria vector abundance in rice-growing villages in Mali. Am J Trop Med Hyg. 2007;76:869–74. [PMC free article] [PubMed] [Google Scholar]
- 7.Robert V, Gazin P, Carnevale P. Malaria transmission in three sites surrounding the area of Bobo Dioulasso (Burkina Faso): the savanna, a rice field and the city. Bull Soc Vec Ecol. 1987;12:41–3. [Google Scholar]
- 8.Thomas CJ, Lindsay SW. Local-scale variation in malaria infection amongst rural Gambian children estimated by satellite remote sensing. Trans R Soc Trop Med Hyg. 2000;94:159–63. doi: 10.1016/s0035-9203(00)90257-8. [DOI] [PubMed] [Google Scholar]
- 9.Vignolles C, Lacaux JP, Tourre YM, Bigeard G, Ndione JA, Lafaye M. Rift Valley fever in a zone potentially occupied by Aedes vexans in Senegal: dynamics and risk mapping. Geospat Health. 2009;3:211–20. doi: 10.4081/gh.2009.221. [DOI] [PubMed] [Google Scholar]
- 10.Mutuku FM, Bayoh MN, Hightower AW, Vulule JM, Gimnig JE, Mueke JM, et al. A supervised land cover classification of a western Kenya lowland endemic for human malaria: associations of land cover with larval Anopheles habitats. Int J Health Geogr. 2009;8:19–32. doi: 10.1186/1476-072X-8-19. [DOI] [PMC free article] [PubMed] [Google Scholar]
- 11.Costantini C, Li SG, DellaTorre A, Sagnon N, Coluzzi M, Taylor CE. Density, survival and dispersal of Anopheles gambiae complex mosquitoes in a West African Sudan savanna village. Med Vet Entomol. 1996;10:203–19. doi: 10.1111/j.1365-2915.1996.tb00733.x. [DOI] [PubMed] [Google Scholar]
- 12.Ejercito A, Urbino M. Flight range of gravid and newly emerged Anopheles. Bull World Health Organ. 1951;3:663–71. [PMC free article] [PubMed] [Google Scholar]
- 13.Charoenpanyanet A, Chen X. Satellite-based modeling of Anopheles mosquito densities on heterogeneous land cover in Western Thailand. The International Archives of the Photogrammetry. Remote Sensing and Spatial Information Sciences. 2008;27:159–164. [Google Scholar]
- 14.Gimnig JE, Ombok M, Otieno S, Kaufman MG, Vulule JM, Walker ED. Density-dependent development of Anopheles gambiae (Diptera: Culicidae) larvae in artificial habitats. J Med Entomol. 2002;39:162–72. doi: 10.1603/0022-2585-39.1.162. [DOI] [PubMed] [Google Scholar]
- 15.Minakawa N, Mutero CM, Githure JI, Beier JC, Yan GY. Spatial distribution and habitat characterization of Anopheline mosquito larvae in Western Kenya. Am J Trop Med Hyg. 1999;61:1010–6. doi: 10.4269/ajtmh.1999.61.1010. [DOI] [PubMed] [Google Scholar]
- 16.Minakawa N, Sonye G, Mogi M, Yan G. Habitat characteristics of Anopheles gambiae s.s. larvae in a Kenyan highland. Med Vet Entomol. 2004;18:301–5. doi: 10.1111/j.0269-283X.2004.00503.x. [DOI] [PubMed] [Google Scholar]
- 17.Minakawa N, Munga S, Atieli F, Mushinzimana E, Zhou G, Githeko A.K, et al. Spatial distribution of anopheline larval habitats in Western Kenyan highlands: effects of land cover types and topography. Am J Trop Med Hyg. 2005;73:157–65. [PubMed] [Google Scholar]
- 18.Minakawa N, Sonye G, Yan GY. Relationships between occurrence of Anopheles gambiae s.l. (Diptera: Culicidae) and size and stability of larval habitats. J Med Entomol. 2005;42:295–300. doi: 10.1093/jmedent/42.3.295. [DOI] [PubMed] [Google Scholar]
- 19.Mohr KI. Interannual, monthly, and regional variability in the wet season diurnal cycle of precipitation in sub-Saharan Africa. J Climate. 2004;17:2441–53. [Google Scholar]
- 20.Munga S, Minakawa N, Zhou GF, Barrack OOJ, Githeko AK, Yan GY. Oviposition site preference and egg hatchability of Anopheles gambiae: effects of land cover types. J Med Entomol. 2005;42:993–7. doi: 10.1093/jmedent/42.6.993. [DOI] [PubMed] [Google Scholar]
- 21.Munga S, Minakawa N, Zhou GF, Mushinzimana E, Barrack OOJ, Githeko AK, et al. Association between land cover and habitat productivity of malaria vectors in western Kenyan highlands. Am J Trop Med Hyg. 2006;74:69–75. [PubMed] [Google Scholar]
- 22.Machault V, Gadiaga L, Vignolles C, Jarjaval F, Bouzid S, Sokhna C, et al. Highly focused anopheline breeding sites and malaria transmission in Dakar. Malar J. 2009;8:138–59. doi: 10.1186/1475-2875-8-138. [DOI] [PMC free article] [PubMed] [Google Scholar]
- 23.Pages F, Texier G, Pradines B, Gadiaga L, Machault V, Jarjaval F, et al. Malaria transmission in Dakar: a two-year survey. Malar J. 2008;7:178–89. doi: 10.1186/1475-2875-7-178. [DOI] [PMC free article] [PubMed] [Google Scholar]
- 24.Yé Y, Kyobutungi C, Louis VR, Sauerborn R. Micro-epidemiology of Plasmodium falciparum malaria: is there any difference in transmission risk between neighbouring villages? Malar J. 2007:6. doi: 10.1186/1475-2875-6-46. [DOI] [PMC free article] [PubMed] [Google Scholar]
- 25.Craig MH, Snow RW, le Sueur D. A climate-based distribution model of malaria transmission in sub-Saharan Africa. Parasitol Today. 1999;15:105–11. doi: 10.1016/s0169-4758(99)01396-4. [DOI] [PubMed] [Google Scholar]
- 26.Snow RW, Craig MH, Deichmann U, le Sueur D. A preliminary continental risk map for malaria mortality among African children. Parasitol Today. 1999;15:99–104. doi: 10.1016/s0169-4758(99)01395-2. [DOI] [PubMed] [Google Scholar]
- 27.Diuk-Wasser MA, Bagayoko M, Sogoba N, Dolo G, Toure MB, Traore SF, et al. Mapping rice field anopheline breeding habitats in Mali, West Africa, using Landsat ETM+ sensor data. Int J Remote Sens. 2004;25:359–76. doi: 10.1080/01431160310001598944. [DOI] [PMC free article] [PubMed] [Google Scholar]
- 28.Hay SI, Snow RW, Rogers DJ. Predicting malaria seasons in Kenya using multitemporal meteorological satellite sensor data. Trans R Soc Trop Med Hyg. 1998;92:12–20. doi: 10.1016/s0035-9203(98)90936-1. [DOI] [PubMed] [Google Scholar]
- 29.Hay SI, Guerra CA, Gething PW, Patil AP, Tatem AJ, Noor AM, et al. A world malaria map: Plasmodium falciparum endemicity in 2007. PLoS Med. 2009;6:e1000048. doi: 10.1371/journal.pmed.1000048. [DOI] [PMC free article] [PubMed] [Google Scholar]
- 30.Machault V, Orlandi-Pradines E, Michel R, Pages F, Texier G, Pradines B, et al. Remote sensing and malaria risk for military personnel in Africa (Reprinted) J Trav Med. 2008;15:216–20. doi: 10.1111/j.1708-8305.2008.00202.x. [DOI] [PubMed] [Google Scholar]
- 31.Machault V. Master 2: géographic de la santé. Paludisme urbain et télédécetion. Paris X et Paris XII, 2007, [Urban malaria and remote sensing. Master 2 thesis (health geography) at Paris Universities X and XII in 2007]. [Google Scholar]
- 32.Beck LR, Rodriguez MH, Dister SW, Rodriguez AD, Rejmankova E, Ulloa A, et al. Remote-sensing as a landscape epidemiologic tool to identify villages at high-risk for malaria transmission. Am J Trop Med Hyg. 1994;51:271–80. doi: 10.4269/ajtmh.1994.51.271. [DOI] [PubMed] [Google Scholar]
- 33.Beck LR, Rodriguez MH, Dister SW, Rodriguez AD, Washino RK, Roberts DR, et al. Assessment of a remote sensing-based model for predicting malaria transmission risk in villages of Chiapas, Mexico. Am J Trop Med Hyg. 1997;56:99–106. doi: 10.4269/ajtmh.1997.56.99. [DOI] [PubMed] [Google Scholar]
- 34.Rejmankova E, Roberts DR, Pawley A, Manguin S, Polanco J. Predictions of adult Anopheles-albimanus densities in villages based on distances to remotely-sensed larval habitats. Am J Trop Med Hyg. 1995;53:482–8. doi: 10.4269/ajtmh.1995.53.482. [DOI] [PubMed] [Google Scholar]
- 35.Roberts DR, Paris JF, Manguin S, Harbach RE, Woodruff R, Rejmankova E, et al. Predictions of malaria vector distribution in Belize based on multispectral satellite data. Am J Trop Med Hyg. 1996;54:304–8. doi: 10.4269/ajtmh.1996.54.304. [DOI] [PubMed] [Google Scholar]
- 36.Fillinger U, Knols BG, Becker N. Efficacy and efficiency of new Bacillus thuringiensis var israelensis and Bacillus sphaericus formulations against Afrotropical Anophelines in Western Kenya. Trop Med Int Health. 2003;8:37–47. doi: 10.1046/j.1365-3156.2003.00979.x. [DOI] [PubMed] [Google Scholar]


