Abstract
Rapid multi-tracer PET, where two to three PET tracers are rapidly scanned with staggered injections, can recover certain imaging measures for each tracer based on differences in tracer kinetics and decay. We previously showed that single-tracer imaging measures can be recovered to a certain extent from rapid dual-tracer 62Cu – PTSM (blood flow) + 62Cu — ATSM (hypoxia) tumor imaging. In this work, the feasibility of rapidly imaging 18F-FDG plus one or two of these shorter-lived secondary tracers was evaluated in the same tumor model. Dynamic PET imaging was performed in four dogs with pre-existing tumors, and the raw scan data was combined to emulate 60 minute long dual- and triple-tracer scans, using the single-tracer scans as gold standards. The multi-tracer data were processed for static (SUV) and kinetic (K1, Knet) endpoints for each tracer, followed by linear regression analysis of multi-tracer versus single-tracer results. Static and quantitative dynamic imaging measures of FDG were both accurately recovered from the multi-tracer scans, closely matching the single-tracer FDG standards (R > 0.99). Quantitative blood flow information, as measured by PTSM K1 and SUV, was also accurately recovered from the multi-tracer scans (R = 0.97). Recovery of ATSM kinetic parameters proved more difficult, though the ATSM SUV was reasonably well recovered (R = 0.92). We conclude that certain additional information from one to two shorter-lived PET tracers may be measured in a rapid multi-tracer scan alongside FDG without compromising the assessment of glucose metabolism. Such additional and complementary information has the potential to improve tumor characterization in vivo, warranting further investigation of rapid multi-tracer techniques.
Index Terms: Multi-tracer imaging, positron emission tomography (PET)
I. Introduction
The role of Positron emission tomography (PET) as a physiological imaging modality that can characterize, and to some extent quantify, tumor status in vivo is well known, and a number of tracers have been developed for imaging different aspects of tumor function. 18F – fluorodeoxyglucose (FDG), a marker for hexokinase activity and glucose metabolism, is the most commonly used PET tracer. It is valuable for tumor detection, staging, and treatment evaluation because most tumors are marked by increased glucose uptake. It would be highly valuable to have information regarding other aspects of tumor physiology in addition to those measured by FDG. The possibility of obtaining information from multiple tracers in a single dynamic PET scan with sequential tracer administrations is worthy of investigation. In particular, a determination of whether information from FDG imaging is retained in a multi-tracer scan, and to what extent information can be obtained from additional tracers imaged in conjunction with FDG, is of central interest.
Imaging multiple PET tracers together in a single scan is problematic because each PET tracer gives rise to indistinguishable 511 keV photon pairs, so that signals from different tracers cannot be discriminated by photon energy as is done in SPECT. It has been shown [1]–[7], however, that signals from tracers injected in rapid succession and imaged dynamically can be separated well enough to obtain certain information by consideration of each tracer's kinetic behavior and radioactive decay, as in Fig. 1 for dual-tracer FDG+PTSM imaging. Rapid multi-tracer scanning has a number of advantages over multiple single-tracer scans, which must be obtained with delays of approximately seven half-lives or more between scans in order to allow each tracer to decay to acceptably low levels before the next tracer is administered. These advantages include increased patient throughput, excellent co-registration of the images for each tracer, reduced scan times, greatly improved patient convenience, and reduced radiation exposure since only one transmission or CT scan is needed for attenuation correction.
Fig. 1.
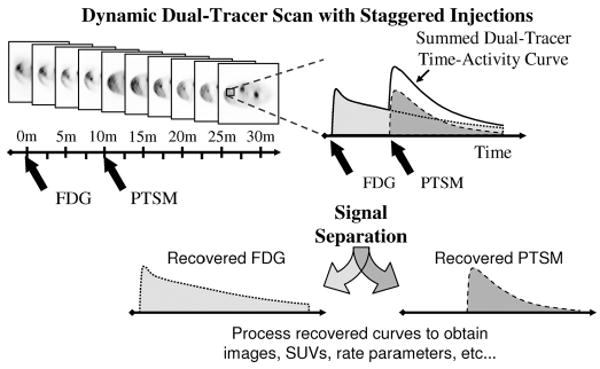
In rapid dual-tracer PET, a dynamic scan is obtained with staggered injections of each tracer. Differences in the kinetic behavior of each tracer, along with the offset injections, permit separation of the dual-tracer time-activity curves into single-tracer components, which can then be analyzed using the usual single-tracer methods to obtain static or dynamic imaging measures as desired.
This work is part of a systematic investigation of rapid multi-tracer PET, the goal of which is to characterize the feasibility of the approach for several classes of PET tracers by determining which imaging measures can be reliably recovered for which tracers and tracer combinations. The potential to accurately recover individual-tracer signals for several tracer combinations staggered by 10–70 minutes was demonstrated in [5], where recovery of information from simulated multi-tracer time-activity curves was studied as a function of injection timing. Rapid dual-tracer imaging of 62Cu-pyruvaldehyde-bis [N4- methyl-thiosemicarbazone] (PTSM)+62Cu-diacetyl-bis [N4- methyl-thiosemicarbazone] (ATSM) was studied with more detailed simulations in [6].
In this work, the feasibility of recovering accurate imaging measures for 18F-FDG imaged concurrently with shorter-lived tracers (62Cu – PTSM, 62Cu – ATSM) is studied in a physiologic tumor model. In [5], [6] the potential for such multi-tracer imaging was demonstrated in simulations, where the simulated data and kinetic models used to perform the multi-tracer signal-separation were mutually consistent. In practice, however, kinetic models are simplified approximations of more complex underlying physiologic processes and are not perfectly consistent with the measured data. Additionally, imperfections in the PET measurement and reconstruction processes can lead to inconsistencies between the kinetic models and image data. Since multi-tracer PET signal-separation relies critically upon predicted differences in kinetic behavior of the tracers, it is important to evaluate multi-tracer methods with real data that includes such model inconsistencies.
Aside from [7], little evaluation of rapid multi-tracer PET with in vivo PET data had been performed until the recent evaluation of rapid dual-tracer 62Cu PTSM + ATSM imaging in a large-animal tumor model under carefully-controlled conditions [8]. There it was shown that certain information about each tracer, such as the standardized uptake value (SUV) for each tracer and K1 for PTSM, can be reliably recovered from dual-tracer imaging for this tracer pair. In this work, the feasibility of imaging FDG in combination with one or two shorter-lived secondary tracers was evaluated in the same tumor model. This represents a more challenging multi-tracer signal-separation problem, where the secondary tracer(s) are administered and imaged while the first (FDG) is still distributing. The ability to recover both static and kinetic imaging measures for each tracer from multi-tracer data was evaluated, using separately-acquired single-tracer scan data as the standard for comparison.
II. Methods
The primary objective of this work was to evaluate the recovery of imaging measures from rapid multi-tracer imaging of FDG along with one or two 62Cu tracers (PTSM, ATSM). Four dual-tracer protocols and one triple-tracer protocol were studied as described in Section II-B. The specific objectives were: (1) to evaluate to what degree quantitative and semi-quantitative FDG imaging measures are degraded by the presence of secondary, shorter-lived tracers administered after FDG; and (2) to determine what imaging measures may be reliably obtained from the 62Cu tracers. Note that the ability of each tracer to measure any specific physiological function or state was not studied; rather, it was determined what information could be obtained from rapid multi-tracer imaging of these tracers as compared to separate, single-tracer scanning of each. The experimental method was to acquire single-tracer scans with each tracer using the multi-tracer scanning sequence, and then to combine the raw data to emulate the corresponding multi-tracer dataset. This allowed comparison of recovered single-tracer imaging measures with measures from the known components of the multi-tracer datasets, avoiding problems due to imperfect reproducibility of repeat PET scans and misregistration effects.
A. Experimental Setup
Four terminally ill canines (39.3 ± 13.9 kg) with pre-existing tumors were recruited for this study from regional animal shelters and veterinarians under a protocol approved by the University Institutional Animal Care and Use Committee. Each dog had multiple large, well developed tumors and had already been prescribed euthanasia. Approximately 50 mg/kg Telazol was injected intramuscularly to initiate anesthetic induction; this was followed by tracheal intubation and mechanical ventilation with isoflurane in oxygen, keeping the end tidal CO2 at 35 mm +/− 5 mm Hg. Intravenous lines were started in the cephalic veins with Lactated Ringer's solution infused at a rate of 15 ml/kg/hr. Pancuronium bromide was administered intravenously in 3 mg doses as needed to maintain muscle relaxation. The recumbent dogs were weighed and tumor vicinities shaved. An arterial-venous (AV) shunt in the femoral artery allowed arterial blood sampling during dynamic scanning, and 1000 units of heparin were given intravenously before each scan to keep the shunt clear. The dog was placed on the bed of the Advance scanner (General Electric Medical) with tumors centered in the field-of-view; tape and Velcro straps secured this positioning throughout the study. Dynamic PET scanning was conducted in 2-D mode, with septa in place, following intravenous administration of radiotracers. Each animal was euthanised after completion of imaging, and tissue samples were obtained for histopathologic analysis.
B. PET Scanning
Single-tracer dynamic scans with 62Cu – PTSM (35 min.), 62Cu – ATSM (35 min.), and 18F – fluorodcoxyglucosc (FDG, 60 min.) were performed in each dog with slow bolus administrations of 4.7 ± 3.2, 5.1 ± 2.8 and 5.1 ± 2.2 mCi of each tracer, respectively. Synthesis of 62Cu – PTSM and 62Cu – ATSM was achieved using a portable 62Zn/62Cu generator and tracer preparation kits provided by Proportional Technologies (Houston, TX) [9]. Scans were separated by at least 70 minutes to allow the 62Cu from the previous scan to decay to a negligible activity level (less than 1% of the administered value), and the FDG scan was performed last. Each emission scan was preceded by a 10 minute transmission scan for attenuation correction and to detect any alignment shift between scans (none was observed). An overview of the experimental method and multi-tracer emulation procedure is given in Fig. 2.
Fig. 2.
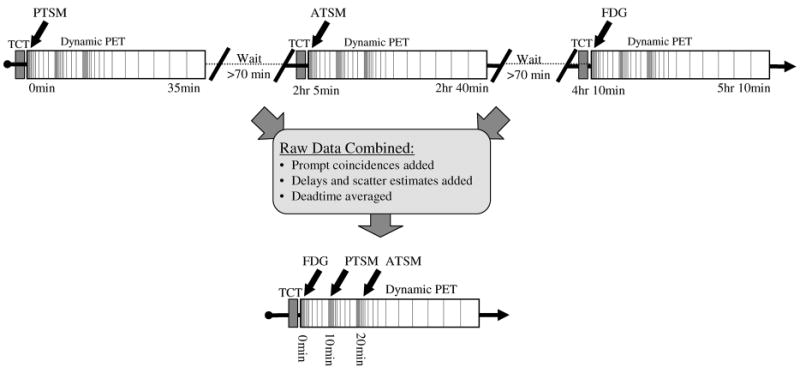
Separate single-tracer scans were acquired using the multi-tracer dynamic scanning protocol (top). The raw data from each scan were then combined to emulate rapid multi-tracer scans (triple-tracer shown at bottom), providing exactly paired single- and multi-tracer components permitting direct evaluation of the accuracy of the multi-tracer signal separation procedure. In practice, separate single-tracer scans would require 5 hr 10 min or longer to complete in order to wait for decay of one tracer before imaging the next, whereas the rapid triple-tracer procedure can be completed in the time required for a single FDG scan alone.
Four dual-tracer scans and one triple-tracer scan were emulated; the protocols were designed based on previous simulation studies [5], [6]. Note that the effect of injection timing and relative dose were investigated in these studies; it was found that injections staggered by 10–20 min. gives a good tradeoff between signal separation performance and short scan duration for these tracers. The dual-tracer scans had FDG injected at time 0 and either PTSM or ATSM injected at 10 or 20 min. The triple-tracer scan had FDG injected at time 0, PTSM injected at 10 min., and ATSM injected at 20 min. The dynamic scanning had rapid sampling (5 second timeframes) at the time of FDG injection, followed by progressively slower sampling as the tracer distribution slowed and stabilized. The sequence with fast sampling was restarted at 10 and 20 min. for the administration of the 62Cu tracer(s). The complete temporal sampling schedule was: 12 × 5 s, 6 × 10 s, 6 × 30 s, 5 × 60 s, 12 × 5 s, 6 × 10 s, 6 × 30 s, 5 × 60 s, 12 × 5 s, 6 × 10 s, 6 × 30 s, 5 × 60 s, 5 × 120 s, 4 × 300 s for a total scan duration of 60 min.
Arterial input functions were determined by drawing 0.4-0.5 ml blood samples from the AV shunt on a schedule similar to the scanning schedule and recorded manually. The freely available fractions for PTSM and ATSM were determined by octanol extraction, which relies on the fact that PTSM and ATSM bind to serum albumin [23], [24]. Blood samples at 1, 5, 10, 15, and 20 min. were added to 1.0 ml octanol in test tubes and centrifuged, thus separating the freely available (octanol separated) and bound (pellet) fractions. Each sample was weighed and counted in a well counter soon after withdrawal. Radioactive decay corrections were applied and the measurements were interpolated to recover time-activity curves for the whole-blood and freely-available arterial input functions for use with compartment modeling. Note that for actual multi-tracer PET studies, measurement of arterial input functions would be complicated by the presence of more than one tracer in the blood samples. This complication has not yet been addressed, though it is likely that accurate estimates of individual input functions for each tracer could be obtained using extrapolation techniques (as in [7]) and/or repeat activity counting to discriminate between tracers with differing rates of radioactive decay.
C. Data Processing
The overall objective of this work was to determine the feasibility of concurrently imaging 18F-FDG along with a second (and/or third) shorter-lived tracer(s) (PTSM, ATSM), using physiologically realistic PET scans where the measured data were not perfectly consistent with the kinetic models used for analysis (due to imperfections and noise in the PET measurement process, as well as inconsistencies between the kinetic models and actual pharmacokinetic behavior of the tracers in vivo). Rather than using repeat single- and multi-tracer scans as a standard for comparison—which would suffer from repeat-scan variability—our experimental design utilized raw-data emulation techniques to combine single-tracer scans into representative multi-tracer datasets.
The primary objective of this emulation was to obtain multi-tracer PET datasets made up of single-tracer components that were exactly paired with the separate single-tracer datasets used as the standard for comparison. As such, any differences between the final imaging measures (SUVs, kinetic rate parameters) obtained from the emulated multi-tracer scans and single-tracer standards would be due to either incomplete multi-tracer signal-separation or differences in noise propagation for multi-versus single-tracer data processing. This approach necessitates that the exact same prompt coincidence data be used for the single-tracer standards and the emulated multi-tracer data. Note that an alternative approach would be to prioritize emulating exactly what would have been obtained from an actual multi-tracer scan, which would require reducing the number of prompt coincidences for each tracer due to the moderately increased dead-time that would be encountered for actual multi-tracer data, as well as increasing the randoms component in the prompt coincidence window due to random coincidences involving photons from two tracers. This alternative approach, however, would result in multi-tracer and single-tracer datasets that were not exactly paired because of differences in the prompt coincidences used for the single-tracer standards and the single-tracer components of the emulated multi-tracer dataset. While the differences between these two emulation approaches are relatively minor in 2-D mode such as used here, larger differences would be expected in 3-D mode where much higher levels of deadtime and randoms would be encountered.
The raw scan data for each tracer were offloaded from the scanner and combined in the following manner to produce emulated raw multi-tracer datasets. First, each single-tracer scan was processed and reconstructed separately, where the scatter and randoms estimates used for reconstruction were saved. The attenuation, deadtime, and normalization factors for each raw line-of-response were also stored for each tracer. Since only 35 min. of scan data were acquired for PTSM and ATSM but up to 60 min. of data were required for these tracers for the emulated multi-tracer scan, it was assumed that these tracers were fully distributed (static) and the extrapolation was performed by applying the appropriate factors for radioactive decay to the final timeframe of the component single-tracer PTSM and ATSM scans. Note that, after 35 min., only 8.2% of the original administered activity for these tracers remained, so the extrapolated portions represent only a very small portion of the total imaging signal for each tracer. The timeframes of the PTSM and ATSM scans were then shifted in time to align with the timeframes of the dual- and triple-tracer protocols described earlier. Multi-tracer data were then emulated by adding the prompt coincidences, scatter and randoms estimates. Detector normalization and attenuation factors were identical for all component scans; though detector deadtimes were slightly different and were averaged for the multi-tracer emulation. Additional details on the emulation procedure and its advantages and limitations can be found in [8].
The emulated multi-tracer raw data were reconstructed in the same manner as the single-tracer scan data, using twelve subsets and four iterations of OSEM.1 The raw line-of-response (LOR) data were reconstructed directly with all corrections (including arc correction) incorporated into the reconstruction matrix (LOR-OSEM, [25]) and with no reconstruction filter applied. Forty-seven regions-of-interest (ROIs) were drawn on ten tumor sites among the four animals studied (11 ± 6 ROIs per animal; sizes 4.5 ± 4.6 cm3), and time-activity curves were obtained for each. The signal separation procedure was applied to the multi-tracer curves, and the recovered single-tracer curves were then processed to recover static and dynamic imaging measures for each tracer.
D. Multi-Tracer Signal Separation
The process of separating dynamic multi-tracer datasets into single-tracer components is termed “multi-tracer signal separation”, and requires that some sort of kinetic constraint be imposed in order to estimate the relative contributions from each tracer to different timepoints in the dynamic sequence. In this work, the expected kinetic behavior of each tracer was constrained to match the compartment models shown in Fig. 3. Radioactive decay of each tracer was explicitly incorporated into the model(s) in order to facilitate tracer separation. The activity concentration A(t) of the extravascular tissue compartments is given in these models as:
Fig. 3.
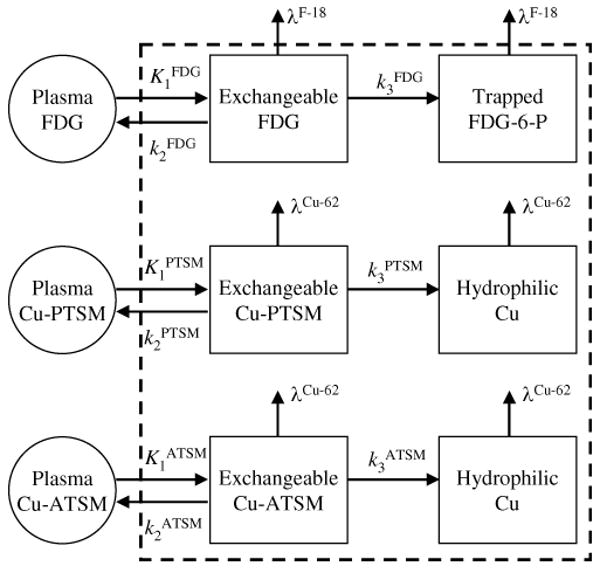
Kinetic models with two tissue compartments and three rate parameters were used for all three tracers studied here, where the second compartment had irreversible trapping. The radioactive decay of each tracer was explicitly incorporated into the model.
| (1) |
where {ki} are the rate constants, λ is the radioactive decay constant, b(t) is the decay-corrected input function (concentration of freely exchangeable tracer in the blood), ⊗ is the convolution operator, and * is used to denote either FDG, PTSM or ATSM since the same model was used for each. For multi-tracer data, b* (t) for each tracer was zero until injection of that tracer (t = 0, 10 or 20 min.). The activity concentration RMulti(t) in a ROI measured by PET for multi-tracer data is modeled as:
| (2) |
where fB is the vascular fraction in the ROI, B(t) is the total activity concentration in the whole blood (including all tracers present), and is the total tissue activity for N tracers.
The signal separation algorithm is shown schematically in Fig. 4 for an example triple-tracer case which has FDG injected at time 0, PTSM at 10 min., and ATSM at 20 min. Eq. (2) was fit to the triple-tracer time-activity curve by Levenberg-Marquardt minimization of chi-squared (Fig. 4, top) to simultaneously obtain best-fitting estimates often parameters ({K1, k3, k3}FDG, {K1, k3, k3}PTSM, {K1, k3, k3}ATSM, fB). The weights used for the fit were based on the number of counts in each timeframe, , where ΔTt is the duration of timeframe t and ω̄ is the average over all timeframes; this choice of fitting weights is routinely used in our group, and it is recognized that these weights may not be optimal for the multi-tracer signal-separation task. The fitted parameters give single-tracer curves (Fig. 4, middle) whose relative values were used to predict the fraction of activity present for each tracer at each time-point. The original (noisy) triple-tracer time-activity curve was split into recovered curves, one for each component tracer, according to these fractions:
Fig. 4.
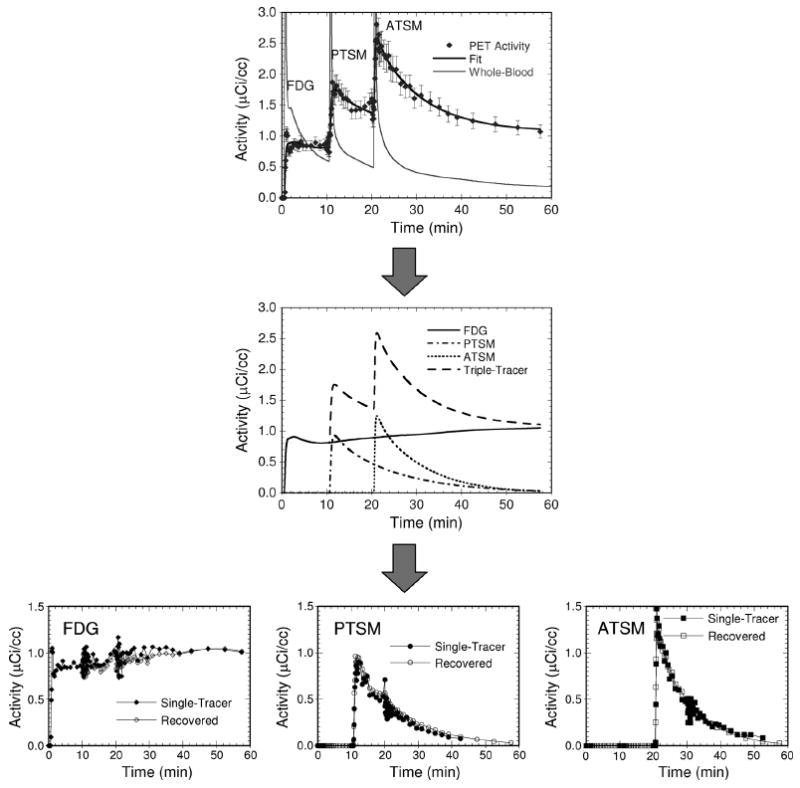
The triple tracer time-activity curve (top) is fit to the triple-tracer compartment model, producing parameterized time-activity curves for each individual tracer (middle). These single-tracer curves are used to predict relative activity values for each tracer at each time-point. These fractions are applied to the original triple-tracer curve to give the recovered single-tracer curves (bottom). The error bars shown on the top plot are the weights used for the multi-tracer compartment-model fit. The variations seen in the recovered FDG curve at 10 and 20 min., and in the PTSM curve at 20 min., are due to the use of fast temporal sampling at the times of injection of the other tracers.
| (3) |
Separating the multi-tracer curve R̃Muiti(t) in this way, as opposed to using the fitted curves R̅n(t) as the recovered signal for each tracer, serves several purposes. It distributes the noise in R̃Muiti(t) among the recovered tracers, rather than regularizing the recovered signals according to the kinetic model used, which may potentially affect the final imaging measures for each tracer. Perhaps more importantly, it does not restrict the recovered signal for each tracer to exactly match the kinetic model used, which reduces the level of accuracy required in both the kinetic model and input function used for the multi-tracer signal-separation task.
The recovered curves, shown together with the input single-tracer curves (Fig. 4, bottom), could be processed in whatever manner desired according to usual single-tracer processing methods. Here, they were integrated to obtain SUVs for each tracer, and also fit to single-tracer compartment models to determine kinetic rate parameters. Note that the rate parameter results for each tracer could also have been estimated directly from the multi-tracer compartment model fit; however we prefer to explicitly separate the signal separation procedure from the data analysis stage. This has implications for, among others, noise propagation and sensitivity to the weighting factors used for the kinetic modeling.
E. Analysis
The goal of the rapid multi-tracer technique is to obtain imaging measures for multiple tracers from a single scan. Evaluation of the method includes determining to what extent the same results can be obtained from multi-tracer scans as can be obtained from multiple separate single-tracer scans. The input single-tracer curves, which are the components for the multi-tracer emulation, were therefore used as the gold standard for comparison with the single-tracer curves recovered from multi-tracer imaging. The question of how accurately each tracer measured its associated physiologic parameter is an entirely separate topic better suited to tracer development work evaluating each individual tracer.
Multi-tracer results for the four canine experiments were pooled and compared to the separate, single-tracer standards by linear regression analysis of several quantitative imaging measures, including: (i) the SUV obtained by integrating the decay-corrected time-activity curve, (15 to 20 minutes post-injection for the 62Cu tracers and from 50 to 60 minutes post-injection for FDG); (ii) the net-uptake parameter, Knet = K1k3/(k2 + k3); and (iii) the individual rate parameters, K1 − k3, obtained from compartment model fits of the recovered time-activity curves. The FDG SUV and Knet provide measures related to glucose utilization. The PTSM SUV, K1, and Knet are potentially useful for blood flow characterization. The ATSM SUV, k3, and Knet are likely related to hypoxia, although a quantitative measure of hypoxia would likely require consideration of the flow-dependence of the tracer delivery. These imaging measures provide well-defined parameters used here to evaluate the performance of the signal separation algorithm.
III. Results
A. Dual-Tracer Imaging With FDG and Another Tracer
Tables I and II summarize the results of linear regression analyses comparing imaging measures recovered from the four dual-tracer imaging protocols versus the single-tracer standards. The FDG imaging measures were recovered very accurately from the dual-tracer scans, as exemplified further by the scatter plots of Fig. 5. This is a critical result in that the “standard” FDG information about glucose metabolism was not adversely affected by the presence of the secondary tracers. As such, the pursuit of additional tumor characterization through the use of additional tracers did not compromise the FDG information.
Table I. Correlation Coefficients and Regression Results for Dual-Tracer FDG (0 min.) + PTSM (10, 20 min.) Imaging Measures.
| PTSM injected at 10min | PTSM injected at 20min | |||
|---|---|---|---|---|
| FDG K1 | y = 1.01x + 0.02 | R = 0.99 | y = 0.98x + 0.01 | R > 0.99 |
| FDG k2 | y = 0.95x + 0.11 | R = 0.99 | y = 0.99x + 0.01 | R > 0.99 |
| FDG k3 | y = 1.00x Š 0.00 | R > 0.99 | y = 1.00x - 0.01 | R > 0.99 |
| FDG Knet | y = 0.93x + 0.00 | R > 0.99 | y = 0.97x + 0.00 | R > 0.99 |
| FDG SUV | y = 0.97x + 0.02 | R > 0.99 | y = 0.99x + 0.01 | R > 0.99 |
| PTSM K1 | y = 1.25x + 0.01 | R = 0.98 | y = 1.06x + 0.01 | R = 0.97 |
| PTSM k2 | y = 0.46x + 0.31 | R = 0.04 | y = -1.18x + 0.32 | R = -0.11 |
| PTSM k3 | y = 0.55x + 1.24 | R = 0.57 | y = 0.40x + 0.84 | R = 0.40 |
| PTSM Knet | y = 1.15x + 0.00 | R = 0.92 | y = 0.53x + 0.04 | R = 0.66 |
| PTSM SUV | y = 1.03x + 0.40 | R = 0.97 | y = 0.89x + 0.23 | R = 0.94 |
Table II. Correlation Coefficients and Regression Results for Dual-Tracer FDG (0 min.) + ATSM (10, 20 min.) Imaging Measures.
| ATSM injected at 10min | ATSM injected at 20min | |||
|---|---|---|---|---|
| FDG K1 | y = 1.02x + 0.02 | R = 0.99 | y = 0.99x + 0.01 | R > 0.99 |
| FDG k2 | y = 0.95x + 0.11 | R = 0.99 | y = 0.99x + 0.02 | R = 0.99 |
| FDG k1 | y = 1.00x Š 0.01 | R > 0.99 | y = 1.00x Š 0.01 | R > 0.99 |
| FDG Knet | y = 0.94x + 0.00 | R > 0.99 | y = 0.97x + 0.00 | R > 0.99 |
| FDG SUV | y = 0.98x Š 0.01 | R > 0.99 | y = 0.99x - 0.00 | R > 0.99 |
| ATSM K1 | y = 0.89x + 0.00 | R = 0.98 | y = 0.83x + 0.03 | R = 0.98 |
| ATSM k2 | y = 0.41x + 0.38 | R = 0.03 | y = 0.11x + 0.31 | R = 0.01 |
| ATSM k3 | y = 0.20x + 0.80 | R = 0.22 | y = 0.21x + 0.50 | R = 0.25 |
| ATSM Knet | y = 0.33x + 0.05 | R = 0.81 | y = 0.30x + 0.02 | R = 0.82 |
| ATSM SUV | y = 0.76x + 084 | R = 0.90 | y = 0.67x + 0.58 | R = 0.92 |
Fig. 5.
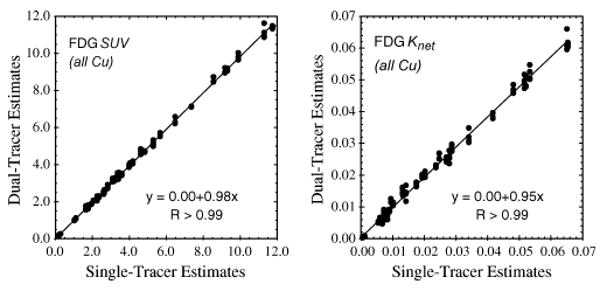
Scatter plots of FDG SUVs and net-uptake parameters recovered from dual-tracer (FDG at 0 min., plus a Cu-tracer at 10 or 20 min.) versus separate single-tracer imaging with PTSM and ATSM. Excellent correlations were obtained, indicating that these broadly-characterizing imaging measures were successfully recovered from the dual-tracer signal-separation procedure.
Relevant information about PTSM or ATSM was also recovered from the dual-tracer FDG + (PTSM, ATSM) protocols. PTSM SUV, K1 (Fig. 6), and Knet were recovered very well, with excellent correlation coefficients; however, some degree of bias was also present (e.g., slopes ≠ 1). The bias differed for injection times of 10 versus 20 min. for PTSM; we postulate that this bias is due to incorrect weights used for the compartment-model fits, and this issue deserves additional investigation. These results demonstrate very good potential for recovering quantitative tumor blood flow information while characterizing glucose metabolism by rapid dual-tracer imaging, provided that algorithmic improvements can overcome the bias observed here. The higher order rate parameters, k2 and k3, for PTSM were not recovered with good accuracy.
Fig. 6.
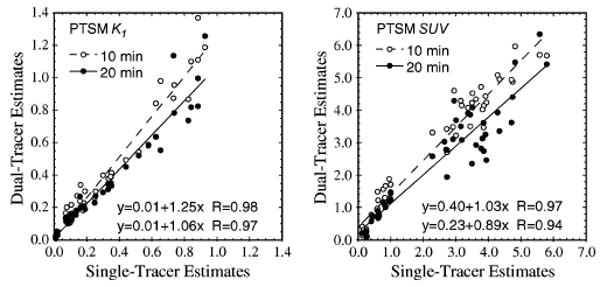
Scatter plots of PTSM SUVs and the wash-in parameter K1 recovered from dual-tracer versus separate single-tracer imaging with FDG. Both PTSM injection times (10 and 20 min.) are shown.
The ATSM imaging measures were in general more difficult to recover. Fig. 7 shows scatter plots for recovery of ATSM SUV and Knet from dual-tracer FDG+ATSM scanning. The SUV and Knet for this tracer were reasonably well recovered, suggesting that some information about the uptake and retention of this tracer can be recovered from dual-tracer imaging with FDG. However, the most relevant rate parameter for characterizing hypoxia (k3) was not well recovered in these data. It appears that the higher order kinetics regarding trapped retention versus slow washout of ATSM were degraded or mixed to some extent with the corresponding portions of the FDG time-activity curve, and thus were poorly recovered from the dual-tracer data. The results for ATSM SUV suggests that gross characterization of hypoxia by, say, SUV tumor:muscle ratios might be possible; however, more precise characterization of hypoxia by ATSM k3 from the dual-tracer protocols studied here does not appear feasible.
Fig. 7.
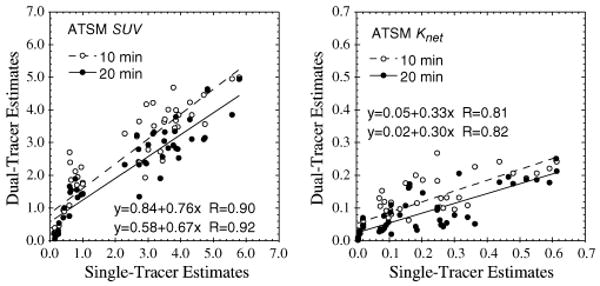
Scatter plots of ATSM SUVs and net-uptake parameter Knet recovered from dual-tracer versus separate single-tracer imaging with FDG. Both ATSM injection times (10 and 20 min.) are shown.
B. Triple-Tracer FDG + PTSM + ATSM Imaging
The imaging results from the triple-tracer imaging protocol were similar to those for the dual-tracer protocols, and are presented as scatter plots in Fig. 8. Again, all FDG imaging measures were accurately recovered and not adversely affected by the presence of the other tracers. The PTSM blood flow measures (SUV, K1, and Knet) correlated strongly with single-tracer measures, but had some bias. Gross characterization of ATSM uptake and retention via SUV showed promise, but more precise information regarding ATSM kinetics was lost by the multi-tracer imaging procedure. Together, these results would suggest that the wash-in kinetics of each tracer are more easily recovered than the later retention/washout phases; however, further work is required to further investigate these phenomena.
Fig. 8.
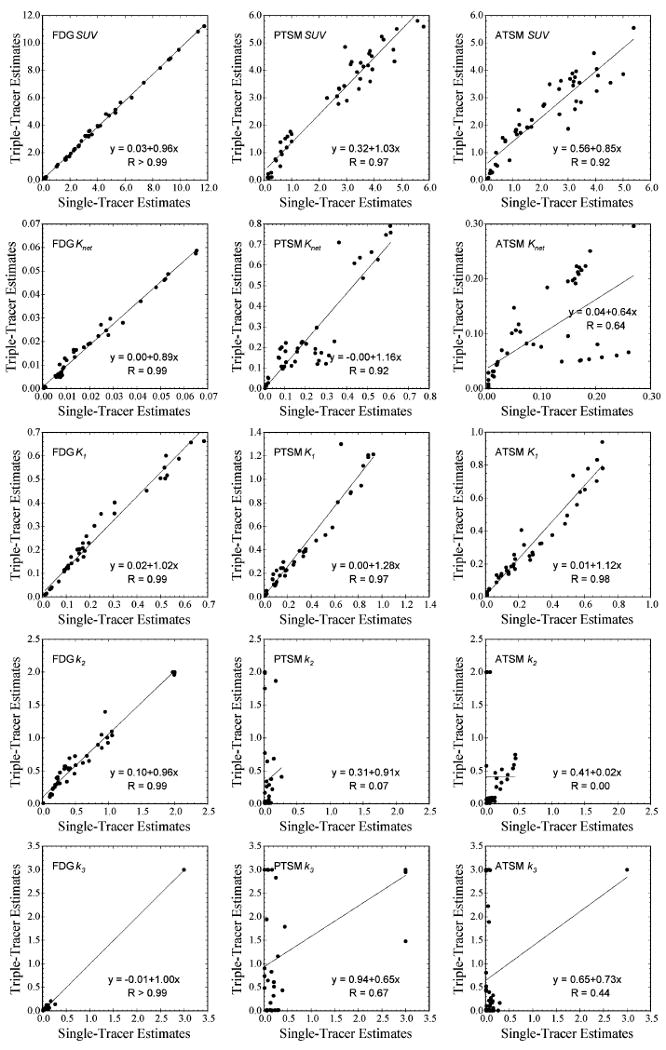
Scatter plots of all triple-tracer imaging measures recovered from triple-tracer versus separate single-tracer imaging with FDG injected at 0 min., PTSM at 10 min., and ATSM at 20 min. The imaging parameter is labeled on the upper-left hand corner of each plot, and the vertical and horizontal axes represent the parameter estimates recovered from triple-tracer imaging and single-tracer imaging, respectively. All FDG measures were well recovered, indicating that imaging two additional 62Cu tracers simultaneously with FDG does not substantially corrupt the FDG information.
IV. Discussion
This work has tested rapid multi-tracer imaging with FDG administered at time 0 with a second (or third) 62Cu-labeled tracer injected at time 10 or 20 min. In contrast to previous simulation work studying the feasibility of such multi-tracer imaging techniques, this work used a canine model with spontaneously-occurring tumors to provide realistic levels of data-model mismatch. Such mismatch is inevitable in practice, arising from both imperfections in the PET measurement and processing as well as approximations in the kinetic models (which simplify the complexity of actual physiologic systems). The results show good potential for recovering certain imaging measures for each tracer from temporally-overlapping multi-tracer datasets. The results are also consistent with the previous simulation work, where the greater degree of variation and presence of bias found here reflect the data-model mismatch just described.
A number of limitations to the study should be considered before drawing conclusions. The canine tumor model provides attenuation and scatter levels much more representative of human imaging than would rodent tumor models; however, the body sizes of these animals are still smaller than most patients. Randoms rates and deadtime levels in actual multi-tracer scans would also be higher than those encountered here for emulated multi-tracer data. While these factors may not be very problematic for 2-D mode scans such as used here, they would be significantly more important when imaging in fully-3D mode without interslice septa. Moreover, dynamic PET imaging with modern 3D-only scanners has not been tested as well as dynamic 2-D mode imaging. Since the multi-tracer PET technique required dynamic imaging, care should be taken to ensure accurate dynamic acquisition and processing can be obtained.
Another significant limitation of this work relates to use of kinetic analysis techniques that require measurement of the arterial input function. We used separately-measured input functions for each tracer in this work, and have not yet addressed the issue of obtaining such inputs for multi-tracer data with more than one tracer present. This will complicate both image-derived and blood sampling techniques, where differences in radioactive decay and/or chemical separation techniques might be necessary to accurately measure the inputs for each tracer. When qualitative (e.g., image) or pseudo-quantitative (e.g., SUV) imaging endpoints are desired, however, it may not be necessary to have a quantitatively-accurate input function for each tracer—provided that sufficient kinetic constraints can be imposed to complete the multi-tracer signal-separation. In such cases, either approximate input functions or non-compartment-model based techniques may potentially be employed.
Rapid multi-tracer PET imaging also brings a number of logistical challenges, such as synthesis and delivery of each tracer in a time-coordinated fashion, and these issues have not yet been addressed. As such, the results of this work relate to the technical feasibility of performing multi-tracer PET imaging, and the overall technique is still in the developmental stages.
V. Conclusions
This work studied four dual-tracer and one triple-tracer imaging protocol for rapidly imaging 62Cu – PTSM and/or 62 Cu – ATSM in conjunction with 18F-FDG. The total scan time for all protocols studied here was 60 min., and thus did not increase the imaging time relative to a 60 min. single-tracer dynamic FDG scan. The results showed, first of all, that both quantitative and semi-quantitative measures of FDG were accurately recovered from the multi-tracer scans, hence information regarding glucose metabolism was not adversely affected by the presence of the secondary tracers. Quantitative measures of PTSM wash-in (K1) and net uptake (Knet) were also accurately recovered, indicating that both blood flow and glucose metabolism can be measured by a single scan. Precise kinetics regarding ATSM retention versus washout were not accurately recovered from these protocols with ATSM administered after FDG; however, gross characterization of ATSM uptake and retention as measured by the SUV showed some promise. This study demonstrates that certain (albeit limited) information about a second, and potentially third, short-lived tracer can be measured alongside FDG by a rapid multi-tracer scan without degrading the FDG results. We note that the multi-tracer signal separation process is sensitive to the particulars (kinetics, half-lives) of the tracers used, and that the results of this study do not predict multi-tracer performance with other tracer combinations. The studies performed here were under carefully controlled conditions, and additional work is necessary before rapid multi-tracer techniques should be applied in the clinic. However, the method shows promise for characterizing 2–3 aspects of tumor physiology from a single, rapid PET exam.
Acknowledgments
The authors would like to thank Regan Butterfield, Melissa Brooks, Thomas Rust, Jonathan Engle, and Paul Christian for their help with the experiments, and Jeffrey Lacy at Proportional Technologies, Inc. for supplying the 62Cu generators and tracer preparation kits used for PTSM and ATSM.
This work was supported in part by Research Scholar Grant 00-200-04-CCE from the American Cancer Society, and by grant R01CA135556 from the National Cancer Institute. The content is solely the responsibility of the authors and does not necessarily represent the views of the American Cancer Society or the National Cancer Institute.
Footnotes
Note that filtered backprojection (FBP) could also have been used for reconstruction, and might be considered preferable when quantification of kinetic rate parameters is the ultimate goal of the imaging. We selected OSEM for this work for two reasons. First, our ultimate goal is not quantitation but rather to compare multi-tracer versus single-tracer results. Second, the non-negativity constraint of OSEM can lead to some inconsistencies between the reconstructed data and the kinetic models; since one of our objectives in this work was to evaluate multi-tracer signal-separation in the presence of such data-model inconsistencies, the use of OSEM provides a more extreme test than FBP would provide.
Contributor Information
Noel F. Black, Email: nblack@ucair.med.utah.edu, Utah Center for Advanced Imaging Research, University of Utah, Salt Lake City, UT 84108-1218 USA
Scott McJames, Email: Scott.Mcjames@hsc.med.utah.edu, Department of Anesthesiology, University of Utah Health Sciences Center, Salt Lake City, UT 84132-2304 USA.
Dan J. Kadrmas, Email: kadrmas@ucair.med.utah.edu, Utah Center for Advanced Imaging Research, University of Utah, Salt Lake City, UT 84108-1218 USA
References
- 1.Huang SC, Carson RE, Hoffman EJ, Kuhl DE, Phelps ME. An investigation of a double-tracer technique for positron computerized tomography. J Nucl Med. 1982;23:816–822. [PubMed] [Google Scholar]
- 2.Ikoma Y, Toyama H, Uemura K, Uchiyama A. Evaluation of the reliability in kinetic analysis for dual tracer injection of FDG and flumazenil PET study. In: Seibert JA, editor. Conf Rec IEEE Nuc Sci Symp and Med Imaging Conf.; Piscataway, NJ, USA: 2001. IEEE. [Google Scholar]
- 3.Koeppe RA, Ficaro EP, Raffel DM, Minoshima S, Kilbourn MR. Temporally overlapping dual-tracer PET studies. In: Carson RE, Daube-Witherspoon ME, Herscovitch P, editors. Quantitative Functional Brain Imaging With Positron Emission Tomography. San Diego, CA: Academic Press; 1998. [Google Scholar]
- 4.Koeppe RA, Raffel DM, Snyder SE, Ficaro EP, Kilbourn MR, Kuhl DE. Dual-[11C]tracer single-acquisition positron emission tomography studies. J Cereb Blood Flow Metab. 2001;21:1480–1492. doi: 10.1097/00004647-200112000-00013. [DOI] [PubMed] [Google Scholar]
- 5.Kadrmas DJ, Rust TC. Feasibility of rapid multi-tracer PET tumor imaging. IEEE Trans Nucl Sci. 2005;52:1341–1347. doi: 10.1109/TNS.2009.2026417. [DOI] [PMC free article] [PubMed] [Google Scholar]
- 6.Rust TC, Kadrmas DJ. Rapid dual-tracer PTSM+ATSM PET imaging of tumour blood flow and hypoxia: A simulation study. Phys Med Biol. 2006;51:61–75. doi: 10.1088/0031-9155/51/1/005. [DOI] [PubMed] [Google Scholar]
- 7.Rust TC, DiBella EV, McGann CJ, Christian PE, Hoffman JM, Kadrmas DJ. Rapid dual-injection single-scan 13N-ammonia PET for quantification of rest and stress myocardial blood flows. Phys Med Biol. 2006;51:5347–5362. doi: 10.1088/0031-9155/51/20/018. [DOI] [PMC free article] [PubMed] [Google Scholar]
- 8.Black NF, McJames S, Rust TC, Kadrmas DJ. Evaluation of rapid dual-tracer 62Cu-PTSM + 62Cu-ATSM PET in dogs with spontaneously-occurring tumors. Phys Med Biol. 2008;53:217–232. doi: 10.1088/0031-9155/53/1/015. [DOI] [PMC free article] [PubMed] [Google Scholar]
- 9.Haynes NG, Lacy JL, Nayak N, Martin CS, Dai D, Mathias CJ, Green MA. Performance of a 62Zn/62Cu generator in clinical trials of PET perfusion agent 62Cu-PTSM. J Nucl Med. 2000;41:309–314. [PubMed] [Google Scholar]
- 10.Bruehlmeier M, Roelcke U, Schubiger PA, Ametamey SM. Assessment of hypoxia and perfusion in human brain tumors using PET with 18F-fluoromisonidazole and 15O-H2O. J Nucl Med. 2004;45:1851–1859. [PubMed] [Google Scholar]
- 11.Lehtio K, Eskola O, Viljanen T, Oikonen V, Gronroos T, Sillanmaki L, Grenman R, Minn H. Imaging perfusion and hypoxia with PET to predict radiotherapy response in head-and-neck cancer. Int J Rad Oncol Biol Phys. 2004;59:971–982. doi: 10.1016/j.ijrobp.2003.12.014. [DOI] [PubMed] [Google Scholar]
- 12.Lehtio K, Oikonen V, Gronroos T, Eskola O, Kalliokoski K, Bergman J, Solin O, Grenman R, Nuutila P, Minn H. Imaging of blood flow and hypoxia in head and neck cancer: Initial evaluation with [(15)O]H(2)O and [(18)F]fluoroerythronitroimidazole PET. J Nucl Med. 2001;42:1643–1652. [PubMed] [Google Scholar]
- 13.Rajendran JG, Krohn KA. Imaging hypoxia and angiogenesis in tumors. Radiol Clin North Am. 2005;43:169–187. doi: 10.1016/j.rcl.2004.08.004. [DOI] [PubMed] [Google Scholar]
- 14.Flower MA, Zweit J, Hall AD, Burke D, Davies MM, Dworkin MJ, Young HE, Mundy J, Ott RJ, McCready VR, Carnochan P, Allen-Mersh TG. 62Cu-PTSM and PET used for the assessment of angiotensin II-induced blood flow changes in patients with colorectal liver metastases. Eur J Nucl Med. 2001;28:99–103. doi: 10.1007/s002590000410. [DOI] [PubMed] [Google Scholar]
- 15.Mathias CJ, Green MA, Morrison WB, Knapp DW. Evaluation of Cu-PTSM as a tracer of tumor perfusion: Comparison with labeled microspheres in spontaneous canine neoplasms. Nucl Med Biol. 1994;21:83–87. doi: 10.1016/0969-8051(94)90133-3. [DOI] [PubMed] [Google Scholar]
- 16.Mathias CJ, Welch MJ, Perry DJ, McGuire AH, Zhu X, Connett JM, Green MA. Investigation of copper-PTSM as a PET tracer for tumor blood flow. Int J Rad Appl Instrum B. 1991;18:807–811. doi: 10.1016/0883-2897(91)90022-d. [DOI] [PubMed] [Google Scholar]
- 17.Dehdashti F, Mintun MA, Lewis JS, Bradley J, Govindan R, Laforest R, Welch MJ, Siegel BA. In vivo assessment of tumor hypoxia in lung cancer with 60Cu-ATSM. Eur J Nucl Med Mol Imaging. 2003;30:844–850. doi: 10.1007/s00259-003-1130-4. [DOI] [PubMed] [Google Scholar]
- 18.Fujibayashi Y, Taniuchi H, Yonekura Y, Ohtani H, Konishi J, Yokoiyama A. Copper-62-ATSM: A new hypoxia imaging agent with high membrane permeability and low redox potential. J Nucl Med. 1997;38:1155–1160. [PubMed] [Google Scholar]
- 19.Lewis JS, McCarthy DW, McCarthy TJ, Fujibayashi Y, Welch MJ. Evaluation of 64Cu-ATSM in vitro and in vivo in a hypoxic tumor model. J Nucl Med. 1999;40:177–183. [PubMed] [Google Scholar]
- 20.Lewis JS, Sharp TL, Laforest R, Fujibayashi Y, Welch MJ. Tumor uptake of copper-diacetyl-bis(N(4)-methylthiosemicarbazone): Effect of changes in tissue oxygenation. J Nucl Med. 2001;42:655–661. [PubMed] [Google Scholar]
- 21.Takahashi N, Fujibayashi Y, Yonekura Y, Welch MJ, Waki A, Tsuchida T, Sadato N, Sugimoto K, Itoh H. Evaluation of 62Cu labeled diacetyl-bis(N4-methylthiosemicarbazone) as a hypoxic tissue tracer in patients with lung cancer. Ann Nucl Med. 2000;14:323–328. doi: 10.1007/BF02988690. [DOI] [PubMed] [Google Scholar]
- 22.Nagamichi S, Czernin J, Kim AS, Sun KT, Bottcher M, Phelps ME, Schelbert H. Reproducibility of measurements of regional resting and hyperemic myocardial blood flow assessed with PET. J Nucl Med. 1996;37:1626–1631. [PubMed] [Google Scholar]
- 23.Herrero P, Hartman JJ, Green MA, Anderson CJ, Welch MJ, Markham J, Bergmann SR. Regional myocardial perfusion assessed with generator-produced copper-62-PTSM and PET. J Nucl Med. 1996;37:1294–1300. [PubMed] [Google Scholar]
- 24.Lewis JS, Herrero P, Sharp TL, Engelbach JA, Fujibayashi Y, Laforest R, Kovacs A, Gropler RJ, Welch MJ. Delineation of hypoxia in canine myocardium using PET and copper(II)-diacetyl-bis(N(4)-methylthiosemicarbazone) J Nucl Med. 2002;43:1557–1569. [PubMed] [Google Scholar]
- 25.Kadrmas DJ. LOR-OSEM: Statistical PET reconstruction from raw line-of-response histograms. Phys Med Biol. 2004;49:4731–4744. doi: 10.1088/0031-9155/49/20/005. [DOI] [PMC free article] [PubMed] [Google Scholar]


