Abstract
The long-term objective of this study is to use MALDI MS and MS/MS to study the fragmentation pattern of in vitro nitrotyrosine-containing peptides in order to assist the interpretation of MS-identification of endogenous nitroproteins in human tissues and fluids. The short-term objective is to study synthetic leucine enkephalin, nitro-Tyr-leucine enkephalin, and d5-Phe-nitro-Tyr-leucine enkephalin with a vacuum matrix-assisted laser desorption/ionization linear ion-trap mass spectrometer (vMALDI-LTQ). The results demonstrated the UV laser-induced photochemical decomposition of the nitro group. Although photochemical decomposition decreased the ion intensity and complicated the MS spectrum, the recognition of that unique decomposition pattern unambiguously identified a nitrotyrosine. The a4- and b4-ions were the most-intense fragment ions found in the MS/MS spectra for those three synthetic peptides. Compared to the unmodified peptides, more collision energy optimized the fragmentation of the nitropeptide, increased the intensity of the a4-ion, and decreased the intensity of the b4-ion. Optimized laser fluence maximized the fragmentation of the nitropeptide. MS3 analysis confirmed the MS2-derived amino acid sequence, but required much more sample. To detect a nitropeptide, the sensitivity of vMALDI-LTQ is 1 fmol for MS detection and 10 fmol for MS2 detection; the S/N ratio was ca. 50:1 in those studies. Those data are important for an analysis of low-abundance endogenous nitroproteins, where preferential enrichment of nitroproteins and optimized mass spectrometry parameters are used.
1. Introduction
Reactive oxygen species and reactive nitrogen species (ROS and RNS, respectively)-mediated oxidative/nitrative stress play important roles in cellular, physiological, and pathological processes [1, 2]. Specific amino acid residues in proteins are sensitive targets that can be modified by ROS/RNS. Tyrosine nitration in a protein is an important redox-related modification that alters the activity of that protein. Endogenous nitrotyrosine-containing proteins and nitrotyrosine-sites have been discovered in a human pituitary [3, 4], a pituitary adenoma [5], a diabetic rat retina [6], a SOD2-knockdown mouse eye-cup [7], sickle cell disease [8], spinal cords of a mouse model of familial amyotrophic lateral sclerosis [9], aging rat skeletal muscle [10, 11], aging rat heart [12], mouse brain [13], human gliomas [14], and a septic patient's rectus abdominis muscle [15]. Most of the nitrotyrosine-sites studied to date are located within a specific functional and structural domains or motifs of a protein. For example, tyrosine nitration occurred within the enzyme-substrate activity region of sphingosine-1-phosphate lyase 1 and within the receptor-ligand region of leukocyte immunoglobulin-like receptor A4 in a human pituitary adenoma [5]. The tyrosine nitration within critical regions (enzyme-substrate; receptor-ligand) of a protein could decrease interactions and interfere with protein functions because the nitro (−NO2) group is a bulky electron-withdrawing group that shifts the pK of a Tyr OH group from ca. 10 to ca. 7 and decreases the electron density of the phenolic ring of a nitrotyrosine residue to diminish protein binding. Tyrosine nitration occurs within a tyrosine phosphorylation motif ([R or K]-x2(3)-[D or E]-x3(2)-[Y]) such as insulin-responsive glucose transporter type 4 and protein tyrosine phosphatase h in the diabetic rat retina [6]; and tyrosine nitration competes with the same tyrosine site with phosphorylation.
Mass spectrometry-based proteomics effectively detects and identifies endogenous nitroprotein and nitrotyrosine-sites. Proteomics is limited by the low-abundance of the endogenous nitrotyrosine sites, which have been estimated to be 1 in 106 tyrosines [16], and the complicated mass spectrometric behavior of a nitrotyrosine-containing peptide. Several protocols to study nitrotyrosine-containing peptides or proteins were developed to be used before mass spectrometry analysis, including (a) the chemical reduction of nitrotyrosine to aminotyrosine [17], (b) derivatization of nitrotyrosine into free sulfhydryl groups followed by enrichment of sulfhydryl-containing peptides with thiopropyl sepharose beads [18], (c) dansyl chloride labeling of the nitration sites in combination with a precursor ion scan and an MS3 analysis [19], (d) 2D-PAGE fractionation in combination with nitrotyrosine Western blot analysis [3, 4, 20], and (e) nitrotyrosine immunoaffinity enrichment of endogenous nitroproteins [5-7]. Protocols (a), (b) and (c) have succeeded only with an in vitro model peptide or protein, and in an in vitro nitrated proteome [17-19], but not with any in vivo studies. Protocols (d) and (e) have succeeded in the identification of endogenous nitrotyrosine-sites [3-7]. Nevertheless, a nitrotyrosine-containing peptide is still low in concentration relative to the tryptic peptides that are derived from a nitroprotein. Most nitroproteins have been identified with only one or two nitropeptides; that low number results in a low protein-coverage [3-15]. Therefore, a high-quality MS/MS-based amino acid sequence is mandatory. However, the complicated mass spectrometric behavior of a nitropeptide makes it difficult to obtain high-quality spectra and to interpret an MS spectrum. Studies have shown that MALDI-induced photochemical decompositions of a nitro group occur in in vitro nitroproteins and synthetic nitropeptides [21, 22], and in endogenous nitroproteins [4]. This present study shows that MALDI-induced photochemical decompositions decrease the precursor-ion intensity of a nitropeptide, and complicate the MS spectrum. Electrospray spectra do not contain those decompositions [21, 22].
This study describes the use of a vMALDI linear ion-trap mass spectrometer to study the fragmentation details of three synthetic peptides – leucine enkephalin, nitro-Tyr-leucine enkephalin, and d5-Phe-nitro-Tyr-leucine enkephalin – to explore the fragmentation behavior of nitrotyrosine-containing peptides during vMALDI-MS and MS/MS with the goal to assist our interpretation of endogenous low-abundance nitropeptides that are derived from human tissues and fluids. The accumulation of hundreds of MS/MS spectra of a nitropeptide significantly optimized the signal-to-noise ratio (S/N) of that spectrum. The spectrum of the 2H (d)-modified nitro-Tyr-leucine enkephalin confirmed the interpretation of the vMALDI MS and MS/MS spectra of nitro-Tyr-leucine enkephalin.
2. Materials and methods
2.1 Synthetic peptides
Leucine enkephalin acetate hydrate (LE1 – Table 1) was purchased (Sigma L9133-10 MG). Nitro-Tyr-leucine enkephalin (LE2) and d5-Phe-Nitro-Tyr-leucine enkephalin (LE3) were synthesized by Dr. Peter Schiller (Clinical Research Institute of Montreal, Canada). Each sample was lyophilized. Table 1 contains the code, amino acid sequence, and theoretical accurate mass of those three peptides.
Table 1.
The amino acid sequence and theoretical mass of the synthesized peptides.
| Code | Sequences | Accurate Mass (Da) |
|
|---|---|---|---|
| LE1 | Tyr-Gly-Gly-Phe-Leu | Y-G-G-F-L | 555.1818 |
| LE2 | (3-NO2)Tyr-Gly-Gly-Phe-Leu | (3-NO2)Y-G-G-F-L | 600.0909 |
| LE3 | (3-NO2)Tyr-Gly-Gly-(d5)Phe-Leu | (3-NO2)Y-G-G-(d5)F-L | 605.1818 |
2.2 Preparation of peptide samples
A separate stock solution (5 pmol/μl) of each peptide was prepared by dissolving 220 μg LE1 (396 pmol) in 79 μl 0.1% trifluoroacetic acid (TFA) with 2% acetonitrile; 350 μg L E2 (490 pmol) in 98 μl 0.1% TFA with 2% acetonitrile; and 505 μg LE3 (702 pmol) in 140 μl 0.1% TFA with 2% acetonitrile. Each solution was stored (4 °C). An aliquot of a peptide stock solution (5 pmol) was diluted with a solution to yield a final concentration of 50% acetonitrile and 0.1 % TFA. A series of dilutions was produced: 5000, 1000, 500, 100, 50, 10, 5, and 1 fmol/μl. The α-cyano-4-hydroxycinnamic acid (CHCA) matrix solution (5 mg/ml) was prepared by dissolving 5 mg CHCA in 1 ml of a solution to yield a final concentration of 50% acetonitrile and 0.1% TFA. Each diluted peptide solution (4 μl) was mixed with 4 μl of the CHCA matrix soluti on. The peptide-CHCA matrix solution (2 μl) was loaded onto a vMALDI 96-well plate (1 pmol/spot), and was dried in ambient air. Each sample was analyzed in triplicate (three separate MALDI spots).
2.3 vMALDI-LTQ mass spectrometer
Each peptide was analyzed with a vacuum matrix-assisted laser desorption/ionization-linear ion-trap mass spectrometer (vMALDI-LTQ) (ThermoFisher Scientific, San Jose, CA, USA) in the tune-page operation mode to obtain the MS and MS/MS spectra. For the vMALDI source, the crystal-positioning system (CPS) was enabled, auto spectrum filter (ASF) disabled, and the number of scans of step 10 for the disabled ASF. The automatic gain control (AGC) was enabled to allow the vMALDI software to automatically adjust the number of laser shots to optimize the quality of the vMALDI spectrum. The number of scans/file was 30. For an MS scan, mass range (m/z 150-700), normal scan-rate, full scan, polarity positive, and 5 microscans of each experiment were used. For an MS/MS scan, normal mass range, normal scan-rate, polarity negative, full scan, isolation width 1.0 Th, activation Q-value 0.25, activation time 30 ms, and 5 microscans of each experiment were used. The laser beam was attenuated to provide a series of fluences (5, 10, 15, 20, 25, 30, 35, 40, and 45 % of the unattenuated beam; arbitrary units). To analyze the effect of laser fluence on the product-ion intensity, the same series of laser fluence was used, and the normalized collision energy (NCE) was fixed at 35 arbitrary units. To analyze the effect of collision energy on the product-ion intensity, the laser fluence was fixed at 30 arbitrary units, and a series of NCE (10, 20, 30, 40, 50, 60, and 70 arbitrary units) was used. For MS2, a laser fluence 30 units, NCE 35 units, isolation width 1.0 Th, activation-Q 0.25, and activation time 30 ms were used. For MS3, the laser fluence 30 units, NCE 35 units, isolation width 1.0 Th, activation-Q 0.25, and activation time 30 ms were used.
The MS and MS/MS data were managed with the Qual Browser that is a part of the Xcalibur software package that is a part of the vMALDI-LTQ system. The spectrum (MS; MS2; MS3) of each scan (n = 30 scans) in each file was processed and accumulated (n = 30) to obtain a synthetic spectrum. The m/z value and peak intensity in the synthetic spectrum were copied into a Microsoft Excel program for data analysis and graph construction. Each experiment was performed in triplicate.
3. Results and Discussion
3.1 MS analysis of LE1, LE2, and LE3
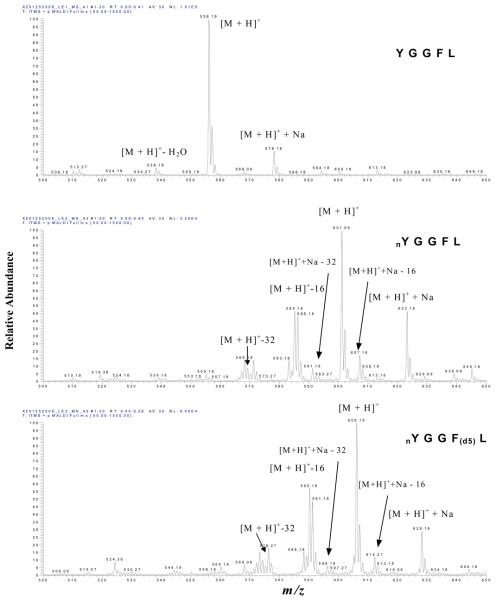
The MALDI MS spectrum of each peptide (1 pmol) was obtained at a laser fluence of 30 units. Figure 1 contains the MS spectrum of LE1 (top; [M+H]+ at m/z 556.2), LE2 (middle; [M+H]+ at m/z 601.1), and LE3 (bottom; [M+H]+ at m/z 606.2). The results clearly showed that the [M+H]+ ion of LE2 shifted 45 mass units (due to the presence of the nitro group) relative to LE1, and that the [M+H]+ of LE3 shifted 5 mass units (d5) relative to LE2 and 50 mass units (nitro group + d5) relative to LE1. Each peptide also has a sodium-adduct ion: for LE1 (m/z 578.2), LE2 (m/z 623.2), and LE3 (m/z 628.2); the mass of each sodium-adduct ion also shifted appropriately.
Figure 1.
MALDI MS spectra of LE1 (top), LE2 (middle), and LE3 (bottom). nY = nitro-Tyr. F(d5) = Phe residue with five 2H (d) atoms.
Compared to LE1, a unique decomposition pattern of ions ([M +H]+ −16, and [M+H]+ −32) was observed in the LE2 and LE3 spectra; that pattern is due to the photodecomposition of the nitro group (−NO2) to lose one and two oxygen atoms [4, 21, 22]. A similar decomposition pattern for the loss of one/two oxygen atoms also occurred for the sodium adduct of LE2 and LE3. A product at [M + H]+ − 30 was also observed in the LE2 and LE3 spectra, which could result from the reduction of the nitro group (NO2) to an amino group (NH2) [22]. Furthermore, the base-peak intensity of the [M + H]+ ion of LE1 (NL = 1.01E5) was higher than that of LE2 (NL = 3.25E4) and LE3 (NL = 9.09E4) (see discussion below; Figure 4A).
Figure 4.
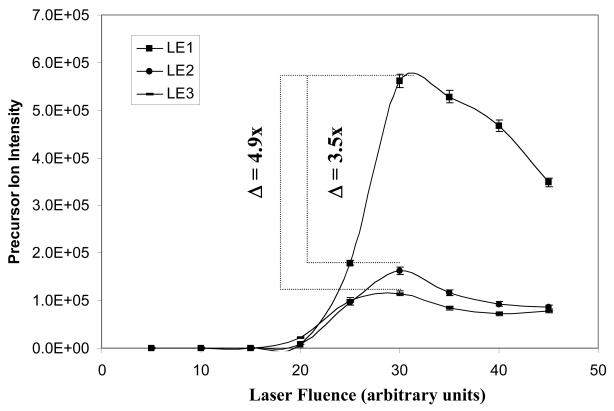
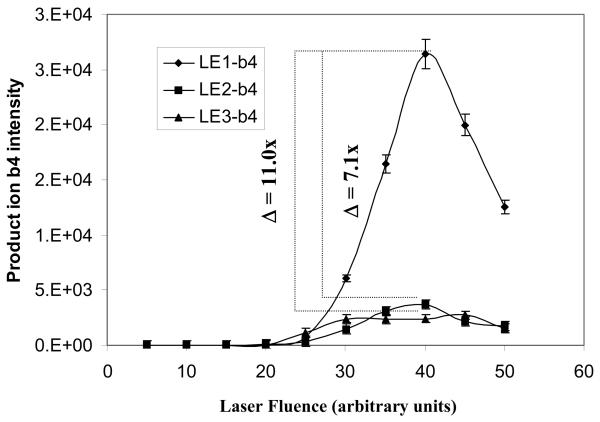
The effect of laser fluence on the fragmentation of nitropeptides. A. Relationship between laser fluence and the precursor-ion intensity (n = 3). B. Relationship between laser fluence and the product-ion b4 intensity (n = 3).
3.2 MS2 analysis of LE1, LE2, and LE3
Each [M+H]+ ion of LE1, LE2, and LE3 was selected as the precursor ion for MS/MS (MS2) analysis (Figure 2). The amino acid sequence of each peptide is listed in the upper-left of each spectrum, and each product ion is underlined. A similar product-ion pattern was found in those three MS/MS spectra; y2, y3; b2, b3, b4, b5; and a4, a5 were detected for each peptide. The b2 (m/z 221.4), b3 (m/z 278.3), b4 (m/z 425.1), and b5 (m/z 538.1) ions of LE2 shifted 45 mass units relative to the corresponding b2, b3, b4, and b5 ions of LE1. Also, the product ions y2 (m/z 279.4) and y3 (m/z 336.2) in LE2 are the same as LE1. This result confirmed that the nitro group (−NO2) was on Y1 in LE2.
Figure 2.
MS2 spectra of LE1 (top), LE2 (middle), and LE3 (bottom). nY = nitro-Tyr. F(d5) = Phe residue with five 2H (d) atoms.
The y2 (m/z 284.4) and y3 (m/z 341.2) ions of LE3 shifted 5 mass units relative to the corresponding y2 and y3 ions of LE1 and LE2. Also, the b2 and b3 ions of LE3 are the same as LE2, but the b4 and b5 ions of LE3 shifted 5 mass units relative to LE2 and shifted 50 mass units relative to LE1. Those results clearly confirmed the d5-F4 in LE3.
Moreover, the abundant a4 and a5 ions in each spectrum (Figure 2) further confirmed the presence of the b4 and b5 ions because an a-ion equals the loss of CO from a b-ion. Compared to the b4 and b5 ion in the MS2 spectra of LE1, LE2, and LE3, the same mass shift occurred in the a4 and a5 ions of LE1, LE2, and LE3. That result further confirmed the nitro group (−NO2) on Y1 in LE2 and LE3, and the d5-F4 in LE3. Furthermore, the base-peak intensity of the product-ion spectrum of LE2 (NL = 1.22E3) and LE3 (NL = 5.59E2) was lower than that of LE1 (NL = 3.36E3) (see discussion below; Figure 4B).
3.3 MS3 analysis of LE1, LE2, and LE3
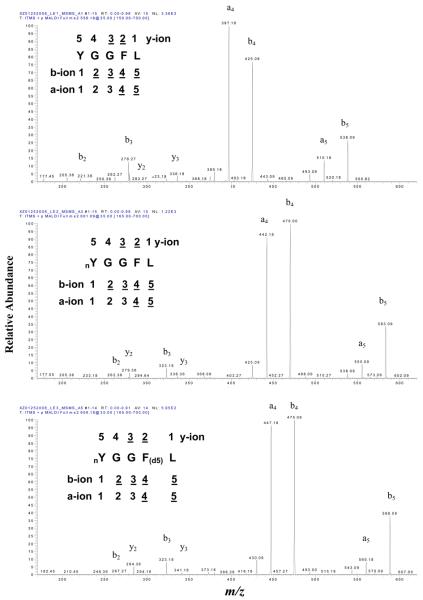
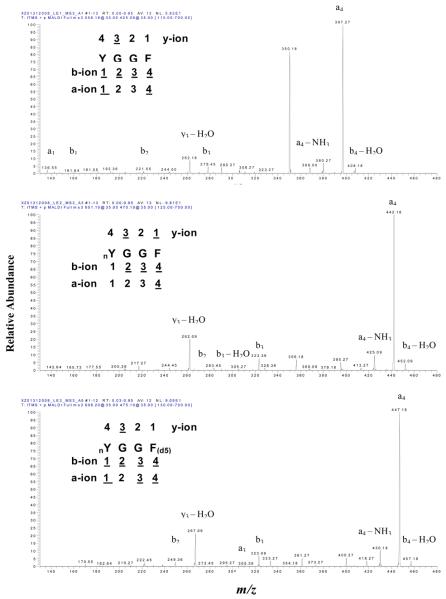
The b4 ion was the second most intense ion in the MS2 spectra of LE1, LE2, and LE3 (Figure 2). MS3 analysis was performed on the b4 product ion of LE1, LE2, and LE3. Figure 3 contains the MS3 spectra of the b4 product ion of LE1 (top), LE2 (middle), and LE3 (bottom). The amino acid sequence is listed in the upper-left corner of each spectrum. The MS3 ions (y, b, and a) are labeled in each spectrum. From those three MS3 spectra, the range of base-peak intensity (5.28E1-9.81E1) was significantly lower than the MS2 base-peak intensity range (5.59E2-3.36E3). No y-ions were detected; only y3-H2O was detected. Ions at b2, b3, a4, and b4-H2O were detected in each MS3 spectrum. Compared to the MS2 product ions (Figure 2), the MS3 product ions demonstrated the same mass shift among LE1, LE2, and LE3.
Figure 3.
MS3 spectra (b4 ion) of LE1 (top), LE2 (middle), and LE3 (bottom). nY = nitro-Tyr. F(d5) = Phe residue with five 2H (d) atoms.
The MS3 b2, b3, b4-H2O, and a4 ions of LE2 shifted 45 mass units relative to LE1. The MS3 b2 and b3 ions of LE3 were the same as LE2, but the b4-H2O and a4 ions of LE3 shifted 5 mass units relative to LE2 and 50 mass units relative to LE1. Also, the MS3 y3-H2O ion was the same between LE1 and LE2, but the y3-H2O ion in LE3 shifted 5 mass units relative to LE1 and LE2. Those MS3 data are consistent with the MS2 data.
3.4 Effect of laser fluence on the fragmentation of LE1, LE2, and LE3
An appropriate laser fluence optimizes the ion signal of a precursor ion and the fragmentation sensitivity of the selected product-ion b4 of LE1, LE2, and LE3. The effect of laser fluence on the intensity of a precursor-ion and product-ion was measured. The b4 product ion (Figure 2) was selected as the index for peptide fragmentation. The normalized collision energy (NCE) was fixed at 35 units for the MS2 laser-fluence analysis. The data in Figure 4A show the effect of laser fluence on the precursor-ion intensity of LE1, LE2, and LE3. Each precursor-ion intensity maximized at a laser fluence of 30 arbitrary units. However, the precursor-ion intensities of LE2 and LE3 were, respectively, 3.5-fold and 4.9-fold lower than LE1 due to the photochemical decompositions described above, because the presence of a nitro group in LE2 and LE3 is the only difference with LE1, and because data described above showed ion losses (−16, −32) that derive only from a nitro group. That photochemical decomposition pattern is consistent with previous studies [4, 21, 22].
Figure 4B shows the effect of laser fluence on the intensity of the b4 product-ion at NCE 35 units. The LE1 and LE2 b4 ions maximized at a laser fluence of 40 units, and the LE3 b4 ion at 45 units. Furthermore, the LE2 and LE3 b4 ion intensities were, respectively, 7.1-fold and 11-fold lower than the LE1 b4 ion; that difference is consistent with the result that the precursor-ion intensity of LE2 and LE3 was much lower than LE1 (Figure 4A).
A laser fluence of 30 units was used for subsequent MS and MS2 experiments.
3.5 Effect of collision energy on the fragmentation of LE1, LE2, and LE3
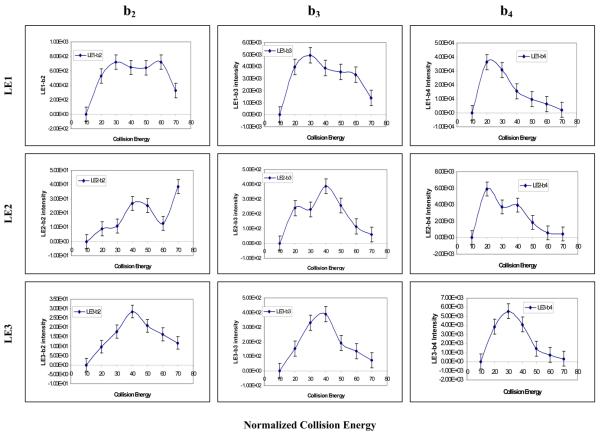
The fragmentation of a precursor ion occurs within the collision-induced dissociation (CID) zone of a mass spectrometer. Collision energy significantly affects fragmentation efficiency [23-25]. Here, we investigated the effect of collision energy on the fragmentation of a nitropeptide, and analyzed whether a nitro group affected the fragmentation at a constant laser fluence of 30 units. Figure 5A shows the effect of NCE on the intensity of the MS2 b2, b3, and b4 product ions. The top three panels (from left to right) show NCE versus intensity of those three product-ions for LE1; the middle three panels for LE2; and the bottom three panels for LE3. The LE1 b2 ion had the (first peak) highest intensity at NCE 30, LE2 at 40, and LE3 at 40 units. The LE1 b3 ion maximized at NCE 30, LE2 at 40, and LE3 at 40 units. The LE1 b4 ion maximized at NCE 20, LE2 at 20, and LE3 at 30 units. These results clearly showed that the generation of the b2 and b3 ions from LE2 and LE3, respectively, required a higher NCE than LE1 because of the presence of the nitro group in LE2 and LE3; and that the generation of the b4 ion of LE3 required a higher NCE than LE1 and LE2 because of the d5-F4 residue in LE3. However, the generation of the b4 ion from LE1, LE2, and LE3 required a lower NCE than the b2 and b3 ions. Perhaps the distance of the F-L bond from the NO2-Y1 residue affected the NCE-versus-intensity relationship. Nevertheless, a higher collision energy is required to fragment a nitropeptide.
Figure 5.
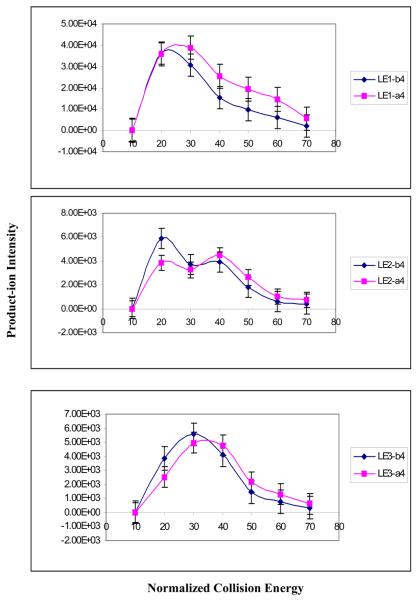
The effect of collision energy on the fragmentation of nitropeptides. A. Relationship between collision energy and the product-ion intensity (n = 3). B. Relationship between collision energy and the product-ion b4 and a4 intensities (n = 3)
Thus, a potential and significant problem is raised that, when an endogenous nitroprotein is MS/MS-identified from a complex proteome, a variable NCE cannot be set for each separate nitropeptide relative to its unmodified species; that limitation could affect the optimized fragmentation of nitropeptide relative to its unmodified species.
Clearly, for an MS/MS identification of an amino acid sequence, the complete b- and y-ion series are optimal. However, for the vMALDI-LTQ experiments on LE1, LE2, and LE3, the a4 and a5 ions are present in the MS/MS spectrum (Figure 2). The [b – CO] ion is an a-ion. Therefore, the effect of NCE on the relative intensity of a- and b-ions was investigated (Figure 5B). For the LE1 b4 and a4 ions, when NCE < 20 units, the b4 ion intensity is slightly higher than the a4 ion intensity, but when NCE > 20 units, the b4 intensity was lower than the a4 ion intensity. For the LE2 b4 and a4 ions, when NCE < 32 units, the b4 ion intensity was higher than the a4 ion intensity, but when NCE > 32 units, the a4 ion intensity was higher than the b4 ion intensity. For the LE3 b4 and a4 ions, when NCE < 35 units, the b4 ion intensity was higher than the a4 ion intensity, but when NCE > 35 units, the a4 ion intensity was higher than the b4 ion intensity. Those results clearly showed that a higher NCE produced more a-ions and fewer b-ions. That result is reasonable, and reflects for the a4 ion, the energetically favorable loss of a molecule (CO; ΔHf = − 26 kCal) from the b4-ions.
3.6 The detection sensitivity of a precursor-ion and product-ion of LE1, LE2, and LE3
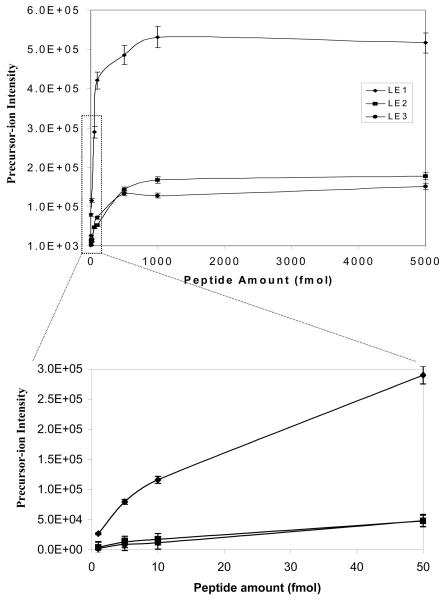
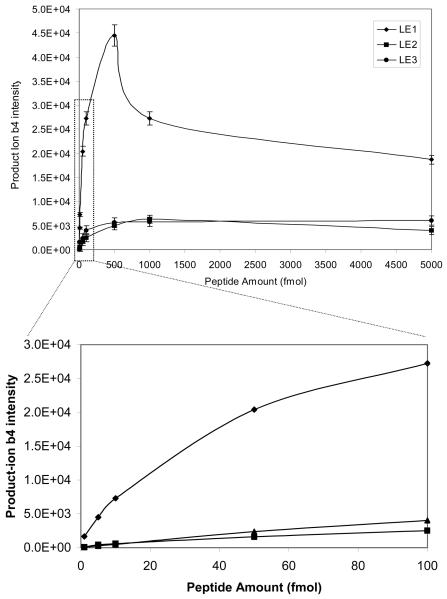
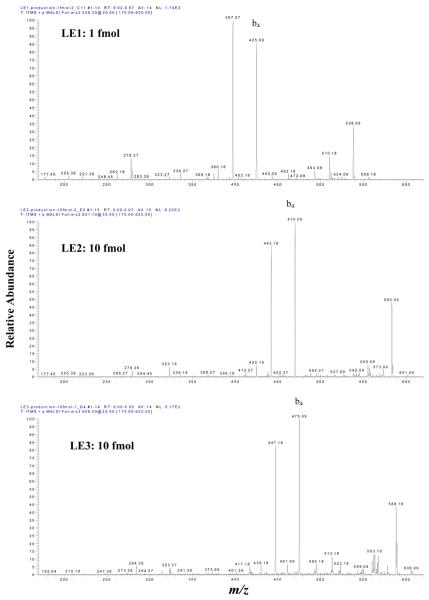
Sensitivity is the key issue for the MS-detection of endogenous low-abundance nitroproteins (and for their future quantification). The optimized experimental conditions described above were used to determine the sensitivity of vMALDI-LTQ to detect the synthetic nitropeptides LE2 and LE3. A series of peptide dilutions (5000, 1000, 500, 100, 50, 5, and 1 fmol) was analyzed. Data in Figure 6A show the sensitivity to detect the precursor ion of LE1, LE2, and LE3. The precursor ion of each peptide at 1 fmol can be effectively detected, and an excellent MS spectrum was obtained. When the peptide amount was > 500 fmol, no linear response relationship existed between the precursor-ion intensity and peptide amount. Figure 6B shows the sensitivity to detect the b4 ion of LE1, LE2, and LE3. The b4 ion can be detected at 1 fmol for LE1, and at 10 fmol for LE2 and LE3; and a good MS2 spectrum was obtained (Figure 7). The S/N of those ions in Figures 7a, b, c are ca. 40-50:1. When the peptide amount was > 500 fmol, no linear response relationship existed between the b4 ion intensity and peptide amount. Therefore, the sensitivity to detect the b4 ion of LE2 and LE3 is lower than for LE1; that difference is consistent with the result that photochemical decomposition decreased the precursor-ion intensity of LE2 and LE3 relative to LE1.
Figure 6.
The vMALDI-LTQ sensitivity in the detection of nitropeptides. A. Relationship between peptide amount and the precursor-ion intensity (n = 3). B. Relationship between peptide amount and the product-ion b4 intensities (n = 3).
Figure 7.
The MS2 sensitivity to detect LE1 (1 fmol), LE2 (10 fmol), and LE3 (10 fmol). The S/N was ca. 50:1.
4. Conclusions
Tyrosine nitration is an important redox-mediated protein post-translatonal modification, is associated with a wide-range of diseases, and is involved in physiological and pathological processes. A variety of protein chemical approaches have been used to detect endogenous nitroproteins and nitropeptides [3, 5, 6, 16, 26-28]. However, mass spectrometry-based proteomics is an effective, sensitive, and specific method to detect and characterize the sites of nitrotyrosines in endogenous proteins. The MS method has been documented [3-15], including studies of human pituitary adenoma, diabetic retina, and lung disease. However, usually only one, or a few, nitropeptides were identified for each endogenous nitroprotein, and a low protein-coverage was found. Therefore, a high-sensitivity mass spectrometer and high-quality MS/MS spectra are needed.
This present study used vMALDI-LTQ to study the fragmentation of a synthetic peptide and two synthetic nitropeptides in order to assist in the interpretation of MS spectra of endogenous nitropeptides. We analyzed synthetic leucine enkephalin (LE1), nitrotyrosine-containing leucine enkephalin (LE2), and nitrotyrosine-containing d5-F4 leucinine enkephalin (LE3). First, the results showed that UV laser-induced photochemical decomposition of the nitro group (loss of 16, 32 Da) decreased the precursor-ion intensity, and complicated the MS spectrum. However, in turn, the recognition of the unique photochemical decomposition pattern significantly assisted in the identification of a nitropeptide and the location of the nitrotyrosine site. Second, the optimal fragmentation of the two nitropeptides (LE2, LE3) required more collision energy compared to the unmodified peptide LE1. However, more collision energy increased the intensity of a-ions and decreased the intensity of b-ions. Third, MS3 analysis confirmed the MS2-derived amino acid sequence, although an MS3 analysis requires a higher amount of peptides relative to MS2. Therefore, MS3 analysis might not be suitable for routine analysis of endogenous low-abundance nitroproteins. Only when a target is determined can MS3 be used for confirmation. Fourth, the optimization of collision energy could depend on the position of nitrotyrosine and length of the peptide, whereas optimization of the laser fluence could rely on the nature of matrix and the ratio of analyte to matrix because laser beam mainly excites the production of the precursor ion ([M + H]+) and might not contribute to the fragmentation of the C-N bond of nitropeptide. Fifth, vMALDI-LTQ MS could detect (with a S/N of ~ 50:1) 1 fmol of a nitropeptide, and MS2 10 fmol nitropeptide and 1 fmol unmodified peptide, because the photochemical decomposition of the nitro group decreased the sensitivity of fragmentation of nitropeptides. Finally, for vMALDI-LTQ, the laser fluence should be evaluated periodically with a standard peptide so that an effective laser energy is used because a laser degrades with time.
Acknowledgments
The authors acknowledge the financial support from Chiesi Pharmaceuticals (Parma, Italy), and NIH (RR016679 to DMD). We thank Dr. Peter Schiller for the synthetic peptides.
Abbreviations
- CHCA
α-cyano-4-hydroxycinnamic acid
- CID
collision-induced dissociation
- LE1
leucine enkephalin
- LE2
nitro-Tyr-leucine enkephalin
- LE3
d5-Phe-nitro-Tyr-leucine enkephalin
- LTQ
linear ion-trap mass spectrometer
- vMALDI
vacuum matrix-assisted laser desorption/ionization
- MS
mass spectrometry
- MS2
MS/MS, tandem mass spectrometry
- MS3
MS/MS/MS
- MW
molecular weight
- m/z
mass-to-charge ratio
- NCE
normalized collision energy
- S/N
signal-to-noise ratio
- RNS
reactive nitrogen species
- ROS
reactive oxygen species
- TFA
trifluoroacetic acid
Footnotes
Publisher's Disclaimer: This is a PDF file of an unedited manuscript that has been accepted for publication. As a service to our customers we are providing this early version of the manuscript. The manuscript will undergo copyediting, typesetting, and review of the resulting proof before it is published in its final citable form. Please note that during the production process errors may be discovered which could affect the content, and all legal disclaimers that apply to the journal pertain.
References
- 1.Dalle-Donne I, Scaloni A, Giustarini D, Cavarra E, Tell G, Lungarella G, Colombo R, Rossi R, Milzani A. Mass Spectrom. Rev. 2005;24:55. doi: 10.1002/mas.20006. [DOI] [PubMed] [Google Scholar]
- 2.Dalle-Donne I, Scaloni A, Butterfield DA, editors. Redox Proteomics: From Protein Modifications to Cellular Dysfunction and Diseases. John Wiley & Sons, Inc.; Hobokein, New Jersey: 2006. [DOI] [PubMed] [Google Scholar]
- 3.Zhan X, Desiderio DM. Biochem. Biophys. Res. Commun. 2004;325:1180. doi: 10.1016/j.bbrc.2004.10.169. [DOI] [PubMed] [Google Scholar]
- 4.Zhan X, Desiderio DM. International J. Mass Spectrom. 2007;259:96. [Google Scholar]
- 5.Zhan X, Desiderio DM. Anal. Biochem. 2006;354:279. doi: 10.1016/j.ab.2006.05.024. [DOI] [PubMed] [Google Scholar]
- 6.Zhan X, Du Y, Crabb JS, Gu X, Kern TS, Crabb JW. Mol. Cell. Proteomics. 2008;7:864. doi: 10.1074/mcp.M700417-MCP200. [DOI] [PMC free article] [PubMed] [Google Scholar] [Retracted]
- 7.Justilien V, Pang JJ, Renganathan K, Zhan X, Crabb JW, Kim SR, Sparrow JR, Hauswirth WW, Lewin AS. Invest. Ophthalmol. Vis. Sci. 2007;48:4407. doi: 10.1167/iovs.07-0432. [DOI] [PMC free article] [PubMed] [Google Scholar]
- 8.Aslan M, Ryan TM, Townes TM, Coward L, Kirk MC, Barnes S, Alexander CB, Rosenfeld SS, Freeman BA. J. Biol. Chem. 2003;278:4194. doi: 10.1074/jbc.M208916200. [DOI] [PubMed] [Google Scholar]
- 9.Casoni F, Basso M, Massignan T, Gianazza E, Cheroni C, Salmona M, Bendotti C, Bonetto V. J. Biol. Chem. 2005;280:16295. doi: 10.1074/jbc.M413111200. [DOI] [PubMed] [Google Scholar]
- 10.Kanski J, Hong SJ, Schoneich C. J. Biol. Chem. 2005;280:24261. doi: 10.1074/jbc.M501773200. [DOI] [PubMed] [Google Scholar]
- 11.Sharov VS, Galeva NA, Kanski J, Williams TD, Schoneich C. Experimental Gerontolgoy. 2006;41:407. doi: 10.1016/j.exger.2006.02.012. [DOI] [PubMed] [Google Scholar]
- 12.Kanski J, Behring A, Pelling J, Schoneich C. Am. J. Physiol. Heart Circ. Physiol. 2005;288:H371. doi: 10.1152/ajpheart.01030.2003. [DOI] [PubMed] [Google Scholar]
- 13.Sacksteder CA, Qian WJ, Knyushko TV, Wang HW, Chin MH, Lacan G, Melega WP, Camp DG, II, Smith RD, Smith DJ, Squier TC, Bigelow DJ. Biochemistry. 2006;45:8009. doi: 10.1021/bi060474w. [DOI] [PubMed] [Google Scholar]
- 14.Fiorce G, Cristo CD, Monti G, Amoresano A, Columbano L, Pucci P, Cioffi FA, Cosmo AD, Palumbo A, d'Ischia M. Neuroscience Letters. 2006;394:57. doi: 10.1016/j.neulet.2005.10.011. [DOI] [PubMed] [Google Scholar]
- 15.Lanone S, Manivet P, Callebert J, Launay JM, Payen D, Aubier M, Boczkowski J, Mebazaa A. Biochem. J. 2002;366:399. doi: 10.1042/BJ20020339. [DOI] [PMC free article] [PubMed] [Google Scholar]
- 16.Shigenaga MK, Lee HH, Blount BC, Christen S, Shigeno ET, Yip H, Ames BN. Proc. Natl. Acad. Sci. USA. 1997;94:3211. doi: 10.1073/pnas.94.7.3211. [DOI] [PMC free article] [PubMed] [Google Scholar]
- 17.Ghesquiere B, Goethals M, Van Damme J, Staes A, Timmerman E, Vandekerckhove J, Gevaert K. Rapid. Commun. Mass Spectrom. 2006;20:2885. doi: 10.1002/rcm.2676. [DOI] [PubMed] [Google Scholar]
- 18.Zhang Q, Qian WJ, Knyushko TV, Claus TR, Purvine SO, Moore RJ, Sacksteder CA, Chin MH, Smith DJ, Camp DG, 2nd, Bigelow DJ, Smith RD. J. Proteome Res. 2007;6:2257. doi: 10.1021/pr0606934. [DOI] [PubMed] [Google Scholar]
- 19.Amoresano A, Chiappetta G, Pucci P, D'Ischia M, Marino G. Anal. Chem. 2007;79:2109. doi: 10.1021/ac0620361. [DOI] [PubMed] [Google Scholar]
- 20.Butt YK, Lo SC. Methods Enzymol. 2008;440:17. doi: 10.1016/S0076-6879(07)00802-6. [DOI] [PubMed] [Google Scholar]
- 21.Petersson AS, Steen H, Kalume DE, Caidahl K, Roepstorff P. J. Mass Spectrom. 2001;36:616. doi: 10.1002/jms.161. [DOI] [PubMed] [Google Scholar]
- 22.Sarver A, Scheffler NK, Shetlar MD, Gibson BW. J. Am. Soc. Mass Spectrom. 2001;12:439. doi: 10.1016/S1044-0305(01)00213-6. [DOI] [PubMed] [Google Scholar]
- 23.Borisov OV, Goshe MB, Conrads TP, Rakov VS, Veenstra TD, Smith RD. Anal. Chem. 2002;74:2284. doi: 10.1021/ac010974p. [DOI] [PubMed] [Google Scholar]
- 24.Yin H, Chacon A, Porter NA, Masterson DS. J. Am. Soc. Mass Spectrom. 2007;18:807. doi: 10.1016/j.jasms.2007.01.004. [DOI] [PubMed] [Google Scholar]
- 25.Lioe H, O'Hair RA. Anal. Bioanal. Chem. 2007;389:1429. doi: 10.1007/s00216-007-1535-1. [DOI] [PubMed] [Google Scholar]
- 26.Aulak KS, Miyagi M, Yan L, West KA, Massillon D, Crabb JW, Stuehr DJ. Proc. Natl. Acad. Sci. USA. 2001;98:12056. doi: 10.1073/pnas.221269198. [DOI] [PMC free article] [PubMed] [Google Scholar]
- 27.Khan J, Brennan DM, Bradley N, Gao B, Bruckdorfer R, Jacobs M. Biochem. J. 1998;330:895. doi: 10.1042/bj3300795. [DOI] [PMC free article] [PubMed] [Google Scholar]
- 28.Haddad IY, Pataki G, Hu P, Galliani C, Beckman JS, Matalon S. J. Clin. Invest. 1994;94:2407. doi: 10.1172/JCI117607. [DOI] [PMC free article] [PubMed] [Google Scholar]


