Abstract
Background
Application of global gene expression profiling to saliva samples is hampered by the presence of partially fragmented and degraded RNAs that are difficult to amplify and detect with prevailing technologies. Moreover, the often-limited volume of saliva specimens is a challenge to validation of multiple candidates by quantitative PCR (qPCR). The aim of this study was to provide proof-of-concept data on the combination of a universal mRNA amplification method with use of exon arrays for candidate selection, and a multiplex pre-amplification method for easy validation.
Methods
We amplified nano-gram scale salivary RNA from 18 healthy subjects using a universal mRNA specific linear amplification strategy combined with the Affymetrix Exon arrays. Multiple selected candidates were pre-amplified in one multiplex RT-PCR reaction, enzymatically cleaned up, and validated by qPCR.
Results
We defined a Salivary Exon Core Transcriptome (SECT) containing 851 transcripts with highly similar expression profiles in healthy individuals. A subset of the SECT transcripts was verified by qPCR. Informatics analysis of SECT revealed several functional clusters and sequence motifs. Gender specific salivary exon biomarkers were identified and validated in healthy individuals.
Conclusions
It is feasible to conduct high-resolution expression profiling with whole transcriptome coverage from samples containing fragmented RNAs, and to validate multiple targets from limited sample amounts.
Keywords: universal mRNA linear amplification, expression profiling, body fluid diagnostics, exon arrays, saliva real-time PCR, multiplex PCR
INTRODUCTION
Most common diagnostic procedures involve biochemical analyses of tissue and blood samples, but body fluids such as saliva offer distinct advantages (1-3). Recent characterizations of the salivary proteome and transcriptome have highlighted the diagnostic potential of saliva (4, 5). Saliva is also promising for biomarker discovery and is donor-friendly, especially for children and the elderly. Saliva contains accurate RNA and protein biomarkers for oral cancer (6), Sjögren's Syndrome (7) and sleep deprivation (8). However, as with archived and post-mortem clinical samples, the low concentration of RNA in saliva, and its partially fragmented and degraded nature, pose challenges to microarray-based transcriptome profiling and qPCR validation (9, 10). Prevailing T7 in vitro transcription (IVT) amplification (11) either depends solely on the existence of poly-A tail, or employs random priming, which severely shortens transcripts and may lead to overrepresentation of long transcripts. The 3’-end biased microarray platforms lack full-length transcript coverage, while full-length cDNA arrays provide low resolution. Additionally, fragmented RNA is generally viewed as a suboptimal template for quantitative analysis by RT-qPCR. It is also challenging to validate multiple candidates discovered by microarrays with the often-limited amount of sample.
To overcome these challenges, we designed an amplification strategy that does not depend solely on the 3'-poly-A tail, or any universal or gene-specific sequences. Additionally, we developed a pre-amplification process that overcomes several constraints of multiplex qPCR (see the workflow in Supplemental Data Fig. 1).
MATERIALS AND METHODS
Sample materials
All healthy subjects included in this study signed the UCLA Institutional Review Board approved consent form. Saliva samples were collected and processed as previously described (5), and supernatant samples were used. XpressRef™ human total RNA (Superarray) was used as reference.
RNA isolation and amplification
RNA from 560 μL of saliva supernatant was isolated with the RNeasy Mini Kit (Qiagen), according to the manufacturer's instructions. We included 1% (v/v) RNase inhibitor NucleoGuard (AmpTec) in the lysis buffer, which improved RNA yield and recovery of long transcripts (Supplemental Data Fig. 2). All samples were treated with TURBO DNA-free (Ambion) to remove trace amount of genomic DNA. Two-round amplification was performed with the ExpressArt TRinucleotide mRNA amplification Kit (AmpTec) according to the manufacturer's instructions.
Microarray and data processing
Single-stranded cDNA was generated from the amplified cRNA by using the WT cDNA Synthesis Kit (Affymetrix), then fragmented and labeled with the WT Terminal Labeling Kit (Affymetrix). Samples were hybridized with the GeneChip Human Exon 1.0 ST arrays (Affymetrix) and scanned at the UCLA Microarray Core Facility. Raw data were processed using Exon Array Computational Tool (ExACT, Affymetrix) for background correction and normalization. Raw data files have been deposited in the Gene Expression Omnibus database (GSE7760).
Statistical Data analysis
Data analysis and statistical evaluations were performed using customized R codes (ver. 2.3.1, http://www.r-project.org/). We defined a probeset to be present when it meets: P<0.001, Intensity>200. These criteria were suggested by preliminary experiments. The SECT includes all probesets present in at least 16 of the 18 arrays. In addition, we refined the SECT to remove GC-rich (≥80%) probesets. The concordance between the SECT and NSCT (Normal Salivary Core Transcriptome; see Results) was evaluated assuming hypergeometric distributions.
For qPCR data, we normalized all transcript abundances to the three Saliva Internal Reference (SIR) genes: ANXA2, RPL37 and S100A8 (see Supplemental Methods). Specifically, we subtracted the mean of the SIR genes’ cycle threshold (CT) values from all the raw CT values and used the resulting ΔCT values to represent the relative abundance of the transcripts (12).
Primer design
Nested PCR assays with primer melting temperatures of about 60 °C were designed using the Primer Express software (Applied Biosystems) (Supplemental Data Table 1). The amplicons were intron-spanning whenever possible. The amplicon lengths were 100-130 base pairs for the outer primer pairs used in pre-amplification, and 60-80 base pairs for the inner primer pairs used in qPCR.
RT-PCR pre-amplification
Multiplex RT-PCR pre-amplification was performed in 10-μL reactions with a pool of outer primers at 300 nM each, using the SuperScript III Platinum One-Step qRT-PCR System (Invitrogen). Reactions were prepared on ice, loaded into pre-heated thermocycler and performed as follows: 1 min at 60 °C, 15 min at 50 °C, 2 min at 95 °C, and 15 cycles of 15 s at 95 °C, 30 s at 50 °C, 10 s at 60 °C and 10 s at 72 °C, with a final extension for 5 min at 72 °C and cooling to 4 °C.
Immediately after RT-PCR, 5 μL of the reaction were treated with 2 μL of Exo-SAP-IT (US Biochemicals) for 15 min at 37 °C to remove excess primers and dNTPs, and then heated to 80 °C for 15 min to inactivate the enzyme mix. The pre-amplificates were then diluted by adding water to 200 μL (40-fold) to enable the qPCR of all targets.
Quantitative PCR
From 2 μL aliquots of pre-amplified samples, each transcript was quantified by singleplex qPCR in 10 μL reactions with the inner primers at 300 nM each, using the SYBR Green Power mix (Applied Biosystems), in an SDS 7500 Fast instrument (Applied Biosystems). After 10 min polymerase activation at 95 °C, 40 cycles of 15 s at 95 °C and 60 s at 60 °C were performed, followed by melting curve analysis.
RESULTS
RNA amplification
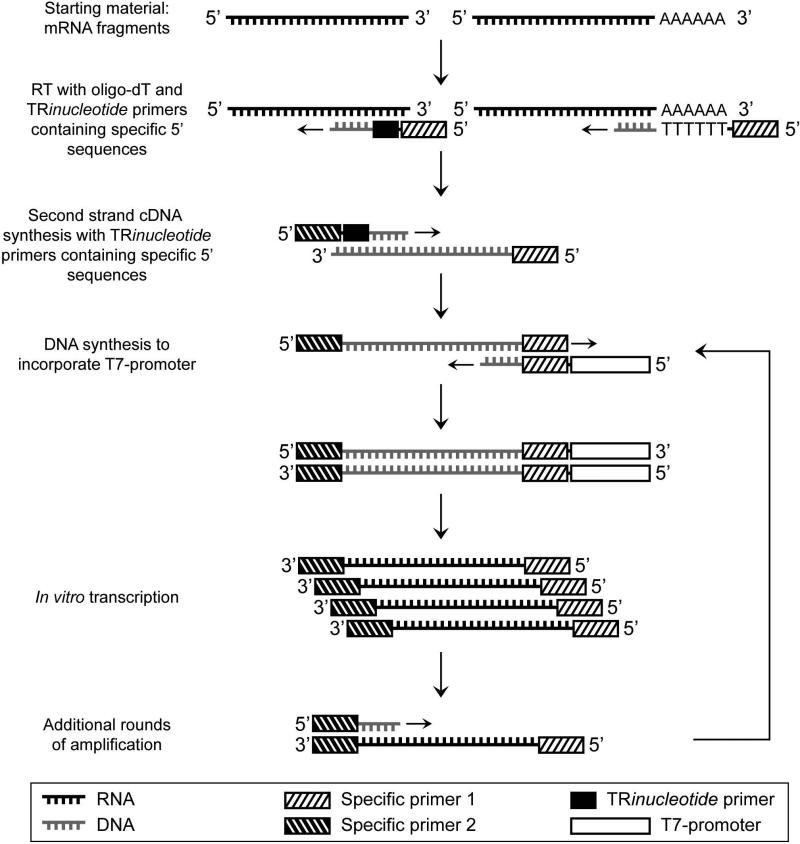
Total RNA was isolated from cell-free saliva samples of 18 healthy subjects. After DNase treatment, the quantity and quality profiles of the RNA samples were determined (Supplemental Data Fig. 3). Total RNA was then amplified using a universal mRNA-specific and T7-IVT based method to generate near full fragment length anti-sense RNAs (Fig. 1). With 1-10 ng of input total RNA, typically 10-60 μg of RNA are obtained after two amplification rounds (Supplemental Data Fig. 4A & 4B).
Figure 1. Schematic flow-chart of the amplification procedure.
Reverse transcription is performed with both oligo-dT and tri-nucleotide primers containing specific 5’ ends. Second strand cDNA is synthesized with another tri-nucleotide primer with specific 5’ end. Corresponding specific primers are used to add the T7-promoter to the templates. After the first IVT, additional rounds of amplification can be achieved with the incorporated specific primers.
Exon array profiling
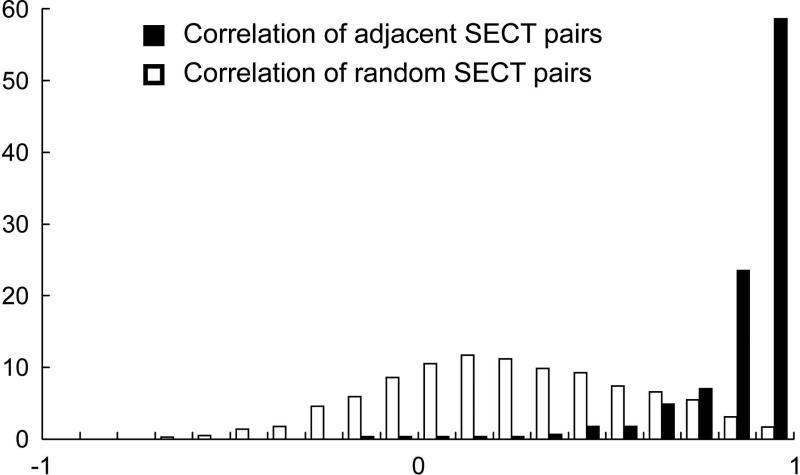
We hybridized the amplified RNA samples to the Affymetrix GeneChip Human Exon 1.0 ST platform that interrogates over one million exon clusters, providing high resolution and full-length coverage for the detection of all currently annotated and predicted transcripts. Recent studies have demonstrated the high concordance between the standard expression HG-U133 and the Exon Array platforms (13, 14). Raw microarray data were processed for background correction and quantile normalization. With the output P-values (measuring the probability of presence of specific signals) and fluorescence intensities, we defined a probeset to be present when it met our quality control criteria (Methods). Using these filter criteria and stringency for probeset selection, all probesets that were present on > 85% of the arrays defined the initial Salivary Exon Core Transcriptome (SECT), which contains 1534 probesets representing 976 unique genes. As quality control, and to determine biological variations, we calculated the Pearson's correlation coefficient of the intensities from all arrays for each of the 285 pairs of adjacent probesets found in SECT, likely from the same transcript fragments. As expected, for 90% of these probeset pairs R2 was >0.7, while for 60% R2 was >0.9, compared to randomly selected probeset pairs from the SECT (Fig. 2).
Figure 2. Quality assurance of the linear amplification-exon array approach.
Distribution of the Pearson's correlation coefficient of the 285 adjacent (black boxes) SECT probeset pairs, and 1000 randomly selected (white boxes) SECT probeset pairs.
Pre-amplification assay
We aimed to develop a method that allows for one-step RT-PCR pre-amplification of multiple targets in one reaction and subsequent unbiased qPCR analysis. An enzymatic cleanup is included to eliminate primer carry over, ensuring quantitative analysis of the pre-amplificates. We selected 10 candidates from the previously defined Normal Salivary Core Transcriptome (NSCT) that may serve as Saliva Internal References (SIR), and designed semi-nested primer sets (5). The outer primer pairs for all targets were combined for pre-amplification in one multiplex reaction.
Specificity
Simply adding an aliquot of the pre-amplification reaction (before clean-up) to qPCR reactions failed. Melting curves revealed non-specific products that made accurate quantification impossible (Supplemental Data Fig. 5A & 5B). This was due to the presence of excessive primer carryover from the pre-amplification that were also amplifiable during qPCR. The digestion of the primers with exonuclease effectively prevented the formation of nonspecific products, and only specific products were detected (Supplemental Data Fig. 5C and 5D). While the semi-nested approach yielded good results, we decided to use fully nested designs for future assays to further increase specificity especially in higher multiplexes. The exonuclease digestion was combined with alkaline phosphatase digestion of dNTPs to establish equal reaction conditions for the downstream qPCR.
Linearity
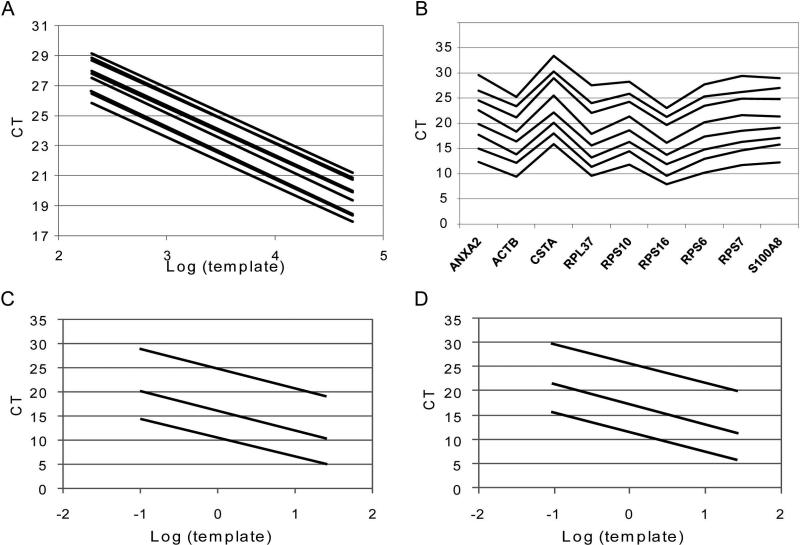
In vitro transcribed mRNA calibrators of 10 SIR candidates were produced and mixed at equal concentrations (Supplemental Methods). A dilution series of the mixture was established using tRNA and pre-amplified. The subsequent calibration curve analysis indicated equal and optimal RT-PCR efficiencies (Fig. 3A, Supplemental Data Table 2). Similarly, reference RNA dilutions between 100 ng and 6.1 pg were pre-amplified and analyzed. The gene expression pattern was conserved over 4 orders of magnitude of RNA input (Fig. 3B). In combination with the approximately 100-fold range of the target transcript concentrations, this amounts to a dynamic range of over 6 orders of magnitude. To illustrate that the linearity is independent of the number of PCR cycles, reference RNA was pre-amplified with 5, 14 and 20 iterations. The linear relationship between logarithm of template input and the cycle threshold (CT) is conserved from 5-20 cycles (Fig. 3C & 3D, Supplemental Table 2).
Figure 3. Establishment of the multiplex pre-amplification method.
(A) Dilutions of an equimolar mixture of the IVT standards for the SIR genes were pre-amplified, ten-fold diluted and analyzed by individual qPCR in duplicate. The resulting nine standard curves are almost perfectly parallel with slopes between −3.24 and −3.39 cycles per tenfold difference in target input. (B) Titration of reference RNA between 100 ng and 6.1 pg. The gene transcription pattern of ten SIR candidate genes was determined from 1000 fold diluted pre-amplificates. (C, D) The linearity of the pre-amplification is conserved between 5 and 20 cycles. A titration of reference RNA between 25 and 0.1 ng was pre-amplified for 5 (top), 14 (middle) and 20 (bottom) PCR cycles. qPCR was performed for ANXA2 (C) and S100A8 (D).
To expand the applicability of the multiplex pre-amplification approach, we have also successfully performed this approach with over 60-plex reactions, using fully nested assays (data not shown).
Internal Normalization
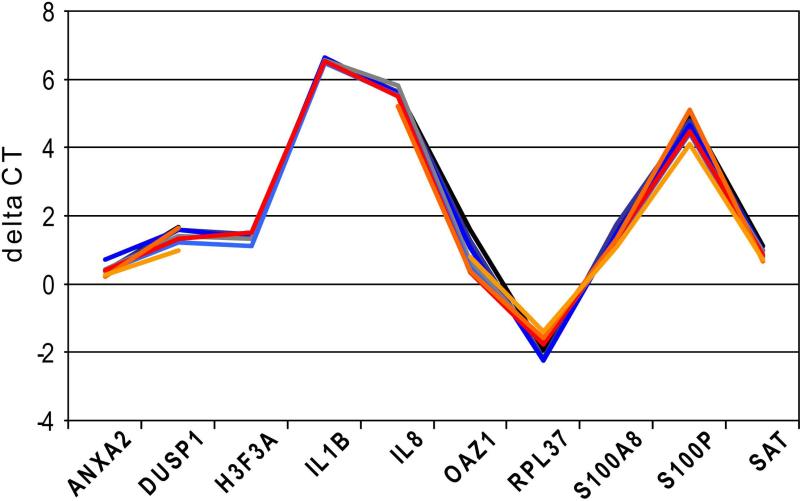
The pre-amplification offers the possibility to include internal reference genes, which can normalize target quantity to a biologically stable entity in the sample and correct for RT efficiency variations between reactions. This was demonstrated in a 26-plexed experiment by normalizing the CT values of individual mRNA with the arithmetic average of the three selected SIR genes (Fig. 4, Supplemental Methods) (12). For this method to be valid, the ΔCT value between target and normalizer genes needs to be stable, independent of sample input (15). This was assured by regression analysis of the ΔCT against the RNA input, which showed that the ΔCTs were indeed stable (Supplementary Table 3). Consequently, identical expression profiles were obtained for total RNA input between 100 ng and 6.1 pg by applying the normalization. We noticed that the SD's for the ΔCT of replicates were markedly reduced in comparison to the CT values as an effect of performing RT in the same reaction (Supplemental Table 3). The SD's for measurements of different RNA input were similar to those of the same concentration, indicating no concentration dependence.
Figure 4. ΔCT values.
Expression profiles of reference RNA dilutions between 100 ng and 6 pg were determined after 26-plex pre-amplification in triplicate per concentration. The ΔCT values were calculated by subtracting the arithmetic average of the three SIR genes from the CT of the individual marker. A few data points for H3F3A, IL1B were not determined while IL8 was not detected in the highest dilution.
Quantitative PCR validation
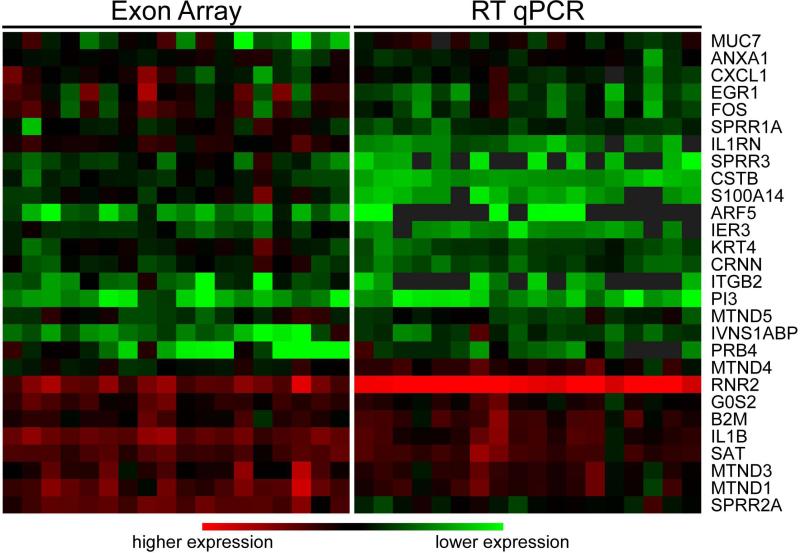
To verify the actual presence of the SECT exons, we randomly picked 36 probesets and performed qPCR analysis, using un-amplified original salivary RNA samples. We designed nested primers targeting the corresponding probeset sequences and performed multiplex pre-amplification followed by qPCR quantification, and normalized all CT values to the SIR genes. We detected 32 probesets, representing 28 genes, in essentially all samples, suggesting that the SECT represents common salivary transcript fragments. Interestingly, the relative expression profiles of these probesets as represented by the array signals and the ΔCT were correlated (average R2=0.67), showing the fidelity of the amplification procedure (Fig. 5).
Figure 5.
Relative expression changes of qPCR verified probesets, using the mean centered log2 (intensity) of exon array signals and SIR-normalized qPCR −ΔCT values.
The 4 probesets that failed in validation were found to be highly GC-rich, suggesting that the detection confidence of these high affinity probesets were over-estimated by inadequate probe-level normalization (16). Therefore, we removed highly GC-rich (≥80%) probesets and refined the SECT to a high-confidence set of 1370 probesets (851 genes, Supplementary Table 4). When comparing these 851 genes with the 185 genes in the NSCT, we found 125 genes in common, showing a high level of concordance (P<0.001), and defined an expanded set of 726 genes. The positions along the transcripts of these SECT-specific probesets from the 726 expanded genes showed a relatively even distribution with some 5’-end enrichment. This is significantly different from the positions of the probesets that belong to the 125 NSCT-common genes, which had a 3’-end enrichment (P<0.001, Supplemental Data Fig. 6 & Supplemental Methods).
Mechanistic and biological implications of SECT
Functional classification and clustering of the SECT mRNAs provides important mechanistic insights for their origin and function. We searched the DAVID database (17) for enrichment of gene annotations as well as annotation clusters. Not surprisingly, many Gene Ontology (GO) terms enriched in previous salivary transcriptome and proteome studies (4, 5) were also well represented in the SECT, including ribosome, transportation, nucleic acid binding, and immune and defense responses (Supplemental Data Table 5). We observed several annotation clusters that were tightly linked to the biological roles of saliva. For example, a cluster of cellular defense responses including inflammatory response, immune response, pest and parasite response, and stress response corresponds well with the anti-microbial and defensive roles of saliva. Such annotation clusters also include cell motility, epidermis development, regulation of cell proliferation and apoptosis, and RNA metabolism. Interestingly, nearly 8% of the SECT defined genes were found to be associated with disease mutation (UniProt Knowledgebase), suggesting a diagnostic link of salivary transcriptome.
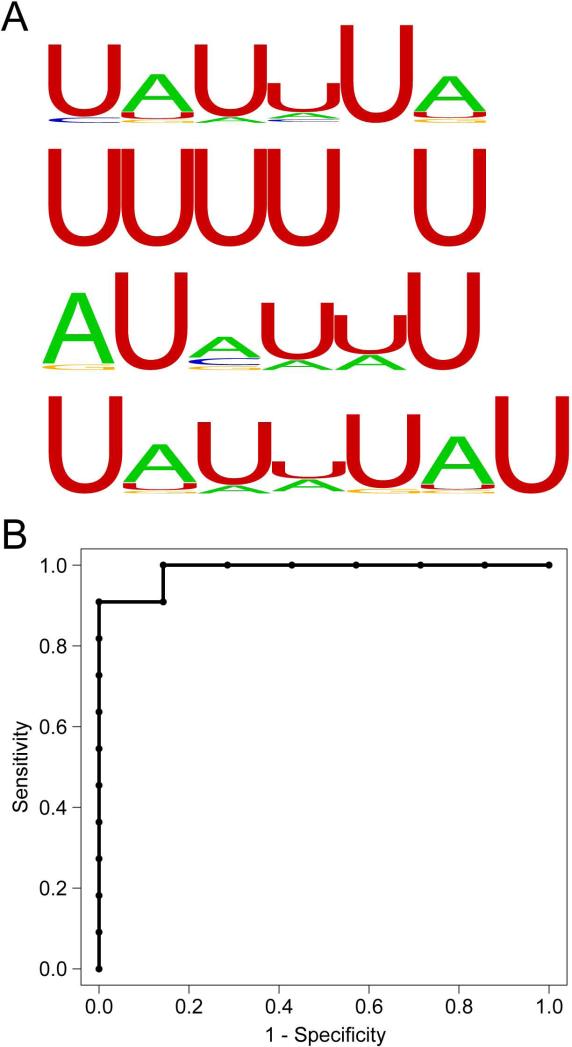
Previous studies suggest that the stability of RNA in saliva might be conferred by certain macromolecules (18) that associate with subsets of mRNAs. We have also found a common AU-rich element (ARE) containing sequence motif in many NSCT transcripts, which typically recruits ARE binding proteins to control transcript stability (19-21). In light of these findings, we retrieved the SECT probeset sequences and searched for sequence motifs using the Motif Discovery scan algorithm (MDscan) (22) at different motif lengths. Interestingly, we found many U-rich stretches and AU-rich sequences (Fig. 6A), suggesting a possible involvement of ARE binding proteins.
Figure 6. Mechanistic and diagnostic implications of salivary transcriptome analysis.
(A) Examples of AU-rich sequence motifs discovered by SECT sequence analysis, which may confer stability of the SECT transcripts. Logos were generated by Weblogo (30), in which the height of the letter corresponds to the frequency of the base at the specific position. (B) ROC curve analysis combining the two salivary exon biomarkers. The calculated area under the ROC curve was 0.987.
Salivary Exon biomarker for gender discrimination
Finally, we explored the potential of salivary exon transcriptome to discriminate clinical phenotypes. Since our subjects (7 males and 11 females) are all healthy, we tested the utility of the exon profiles to identify the gender of the subjects, as many mammalian tissues contain gender-specific expression patterns involved in various cellular roles (23). Exon candidates selected include probesets that were present in >85% of one group and <15% of the other, and probesets that showed significant intensity differences (P<0.05) between the two groups, with a minimal threefold change. Three salivary exon candidates were selected for validation. Multiplex pre-amplification was performed followed by qPCR using the un-amplified original RNA samples for the 3 selected candidates. Two candidates, representing genes RPS4Y1 and EIF1AY, were detected with reliable signals in all male samples while not detected in only 1 female sample. We built a logistic regression model combining the qPCR analysis of these 2 probesets, and the receiver operating characteristics (ROC) curve analysis of all original samples showed an area under the curve value of 0.987 (Fig. 6B). Of note is that these 2 probesets are Y-chromosome exons, which are expected to be absent in all females. We further evaluated the model with an independent cohort of 28 subjects (15 males and 13 females). Only one sample was incorrectly scored which was a female being positive for the male-specific exon markers.
DISCUSSION
The study of partially fragmented and degraded RNA from non-ideal samples is imperative in current biomedical research. Such samples include post-mortem autopsies, archived biopsies, including formalin fixed and paraffin embedded samples, and body fluids such as saliva. The recent skepticism about salivary RNA presence (24) has been well addressed by various studies in our lab (9, 18, 25, 26) as well as other independent investigators (27). However, these compromised RNAs impose great challenges to the prevailing approaches. Transcript fragments often lack the poly-A tail, and the fragmentation pattern is likely random (18). Therefore, both 3’-based amplification methods and 3’-biased microarray detections will lead to a loss of 5’ end information. The main feature of the amplification method described here is reverse transcription with a mix of anchored oligo-dT and the “TRinucleotide” primers, composed of an artificial 5’-sequence, a central short run of 3 to 6 random nucleotides for stabilizing primer annealing, followed by a selected 3’-terminal tri-nucleotide sequence that controls primer hybridization. This results in non-randomly spaced primer annealing sites, rendering a selective advantage on primer positions near the template's 3’-end (data not shown), likely due to low affinity, transient binding of polymerases to free 3’-ends of nucleic acids. The low requirement of a matching tri-nucleotide sequence in the template makes it essentially universal, yet selective against compact structures in rRNAs (data not shown). Tri-nucleotide primers are used again for second strand DNA synthesis. Therefore, all T7-amplified RNAs contain the same 3’-terminal sequence that allows for stringent priming in reverse transcription in additional amplification rounds.
Our study is amongst the first systematic surveys of clinical sample expression profiles using the combination of a universal mRNA full-length linear amplification, an exon-level resolution microarray platform, and a comprehensive qPCR validation. Compared to previously studies, the comprehensiveness and advantages of our approach are demonstrated by the detection of many new transcript fragments. Many of these new transcripts were detected as 5’-end fragments that would be ignored by 3’-biased approaches. In support, independent qPCR validation has demonstrated that the amplification is specific to mRNA fragments in saliva samples. Using our refined criteria of presence call, >90% of the randomly selected probesets were verified by qPCR. In addition, the array signals and qPCR results showed good correlation between the amplified product and the starting RNA (Fig. 5).
It is important to note that, without the pre-amplification, it is impossible to validate the large number of targets we analyzed in the limited amount of samples available. The multiplexible pre-amplification allows for accurate and easy quantification of mRNA. We demonstrated that all targets could be reverse transcribed and amplified with optimal stable efficiencies, using sequence specific priming and limited cycles of PCR. The use of target-specific primers for reverse transcription in close proximity to qPCR target sequence is more favorable than the use of random or poly-dT priming. This method largely resolves the limitations observed with the qPCR analysis of partially degraded RNA samples.
A few factors have been implicated to affect protein binding to sequence motifs, including number of motifs, spacing, the extent of degeneration, and other protein partners. Therefore, the mere presence of sequence motifs may not be sufficient to direct protein binding. Nonetheless, the prevalence of the AU-rich sequences in the SECT transcripts serves as an indication of their biological importance. Since salivary glands are known to express ARE binding proteins (28), these findings may suggest a mechanism whereby ARE-containing salivary mRNA sequences originate from localized production and stability is conferred by these ARE binding proteins such as HuR (29).
Collectively, we have demonstrated the clinical potential of saliva diagnostics with enhanced confidence, sensitivity and resolution. As a non-invasive and easily collected diagnostic fluid, saliva is promising for early disease detection, prognostic prediction and ultimately, health surveillance. The demonstrated gender stratification based on saliva exon profiles provided early evidence that salivary exon profiles may behold clinical diagnostic value for disease discrimination. This study has provided a comprehensive approach that is also applicable for biomarker studies in other body fluids and clinical samples containing fragmented RNAs.
Supplementary Material
ACKNOWLEDGEMENT
We thank K. Brown from Affymetrix, Inc. and UCLA DNA Microarray Core Facility for supporting the microarray studies. We thank V. Palanisamy for comments and discussion. We thank Y. Kim, N. Park and S. Hu for critical review of the manuscript.
GRANT SUPPORT
This work was supported by NIH grant R01-DE15970 and R01-DE17593 (DTW).
Abbreviations
- qPCR
Quantitative PCR
- SECT
Salivary Exon Core Transcriptome
- IVT
In vitro transcription
- NSCT
Normal Salivary Core Transcriptome
- ExACT
Exon Array Computational Tool
- SIR
Saliva Internal Reference
- ROC
Receiver Operating Characteristic
- AUC
Area Under the Curve
Footnotes
All microarray raw data have been deposited in the Gene Expression Omnibus (GEO) database under the series accession number GSE7760 (reviewer access: http://www.ncbi.nlm.nih.gov/geo/query/acc.cgi?token=bjupxqagoauqgxq&acc=GSE7760). There are supplementary materials accompanying the manuscript.
FINANCIAL DISCLOSURES
G.K. is affiliated with AmpTec where the amplification technique is commercialized. D.T.W. and B.G.Z. have filled a patent on the multiplex pre-amplification with cleanup process. The rest of the authors declare no conflict of interest. This study was solely conducted in the laboratory of D.T.W. at UCLA.
REFERENCES
- 1.Kaufman E, Lamster IB. The diagnostic applications of saliva--a review. Crit Rev Oral Biol Med. 2002;13:197–212. doi: 10.1177/154411130201300209. [DOI] [PubMed] [Google Scholar]
- 2.Maliszewski TF, Bass DE. True and apparent thiocyanate in body fluids of smokers and nonsmokers. J Appl Physiol. 1955;8:289–91. doi: 10.1152/jappl.1955.8.3.289. [DOI] [PubMed] [Google Scholar]
- 3.Tsang JC, Lo YM. Circulating nucleic acids in plasma/serum. Pathology. 2007;39:197–207. doi: 10.1080/00313020701230831. [DOI] [PubMed] [Google Scholar]
- 4.Hu S, Xie Y, Ramachandran P, Ogorzalek Loo RR, Li Y, Loo JA, Wong DT. Large-scale identification of proteins in human salivary proteome by liquid chromatography/mass spectrometry and two-dimensional gel electrophoresis-mass spectrometry. Proteomics. 2005;5:1714–28. doi: 10.1002/pmic.200401037. [DOI] [PubMed] [Google Scholar]
- 5.Li Y, Zhou X, St John MA, Wong DT. RNA profiling of cell-free saliva using microarray technology. J Dent Res. 2004;83:199–203. doi: 10.1177/154405910408300303. [DOI] [PubMed] [Google Scholar]
- 6.Li Y, St John MA, Zhou X, Kim Y, Sinha U, Jordan RC, et al. Salivary transcriptome diagnostics for oral cancer detection. Clin Cancer Res. 2004;10:8442–50. doi: 10.1158/1078-0432.CCR-04-1167. [DOI] [PubMed] [Google Scholar]
- 7.Hu S, Wang J, Meijer J, Ieong S, Xie Y, Yu T, et al. Salivary proteomic and genomic biomarkers for primary Sjogren's syndrome. Arthritis Rheum. 2007;56:3588–600. doi: 10.1002/art.22954. [DOI] [PMC free article] [PubMed] [Google Scholar]
- 8.Seugnet L, Boero J, Gottschalk L, Duntley SP, Shaw PJ. Identification of a biomarker for sleep drive in flies and humans. Proc Natl Acad Sci U S A. 2006;103:19913–8. doi: 10.1073/pnas.0609463104. [DOI] [PMC free article] [PubMed] [Google Scholar]
- 9.Park NJ, Zhou X, Yu T, Brinkman BM, Zimmermann BG, Palanisamy V, Wong DT. Characterization of salivary RNA by cDNA library analysis. Arch Oral Biol. 2007;52:30–5. doi: 10.1016/j.archoralbio.2006.08.014. [DOI] [PMC free article] [PubMed] [Google Scholar]
- 10.Paik S, Kim CY, Song YK, Kim WS. Technology insight: Application of molecular techniques to formalin-fixed paraffin-embedded tissues from breast cancer. Nat Clin Pract Oncol. 2005;2:246–54. doi: 10.1038/ncponc0171. [DOI] [PubMed] [Google Scholar]
- 11.Phillips J, Eberwine JH. Antisense RNA Amplification: A Linear Amplification Method for Analyzing the mRNA Population from Single Living Cells. Methods. 1996;10:283–8. doi: 10.1006/meth.1996.0104. [DOI] [PubMed] [Google Scholar]
- 12.Vandesompele J, De Preter K, Pattyn F, Poppe B, Van Roy N, De Paepe A, Speleman F. Accurate normalization of real-time quantitative RT-PCR data by geometric averaging of multiple internal control genes. Genome Biol. 2002;3:RESEARCH0034. doi: 10.1186/gb-2002-3-7-research0034. [DOI] [PMC free article] [PubMed] [Google Scholar]
- 13.Okoniewski MJ, Hey Y, Pepper SD, Miller CJ. High correspondence between Affymetrix exon and standard expression arrays. BioTechniques. 2007;42:181–5. doi: 10.2144/000112315. [DOI] [PubMed] [Google Scholar]
- 14.Xing Y, Kapur K, Wong WH. Probe selection and expression index computation of affymetrix exon arrays. PLoS ONE. 2006;1:e88. doi: 10.1371/journal.pone.0000088. [DOI] [PMC free article] [PubMed] [Google Scholar]
- 15.Livak KJ, Schmittgen TD. Analysis of Relative Gene Expression Data Using Real-Time Quantitative PCR and the 2-[Delta][Delta]CT Method. Methods. 2001;25:402–8. doi: 10.1006/meth.2001.1262. [DOI] [PubMed] [Google Scholar]
- 16.Yoshida R, Numata K, Imoto S, Nagasaki M, Doi A, Ueno K, Miyano S. A Statistical Framework for Genome-Wide Discovery of Biomarker Splice Variations with GeneChip Human Exon 1.0 ST Arrays. Genome Informatics. 2006;17:88–99. [PubMed] [Google Scholar]
- 17.Dennis G, Jr., Sherman BT, Hosack DA, Yang J, Gao W, Lane HC, Lempicki RA. DAVID: Database for Annotation, Visualization, and Integrated Discovery. Genome Biol. 2003;4:P3. [PubMed] [Google Scholar]
- 18.Park NJ, Li Y, Yu T, Brinkman BM, Wong DT. Characterization of RNA in saliva. Clin Chem. 2006;52:988–94. doi: 10.1373/clinchem.2005.063206. [DOI] [PMC free article] [PubMed] [Google Scholar]
- 19.Winzen R, Gowrishankar G, Bollig F, Redich N, Resch K, Holtmann H. Distinct domains of AU-rich elements exert different functions in mRNA destabilization and stabilization by p38 mitogen-activated protein kinase or HuR. Mol Cell Biol. 2004;24:4835–47. doi: 10.1128/MCB.24.11.4835-4847.2004. [DOI] [PMC free article] [PubMed] [Google Scholar]
- 20.Wilusz CJ, Wormington M, Peltz SW. The cap-to-tail guide to mRNA turnover. Nat Rev Mol Cell Biol. 2001;2:237–46. doi: 10.1038/35067025. [DOI] [PubMed] [Google Scholar]
- 21.Chen CY, Shyu AB. AU-rich elements: characterization and importance in mRNA degradation. Trends Biochem Sci. 1995;20:465–70. doi: 10.1016/s0968-0004(00)89102-1. [DOI] [PubMed] [Google Scholar]
- 22.Liu XS, Brutlag DL, Liu JS. An algorithm for finding protein-DNA binding sites with applications to chromatin-immunoprecipitation microarray experiments. Nat Biotechnol. 2002;20:835–9. doi: 10.1038/nbt717. [DOI] [PubMed] [Google Scholar]
- 23.Rinn JL, Snyder M. Sexual dimorphism in mammalian gene expression. Trends Genet. 2005;21:298–305. doi: 10.1016/j.tig.2005.03.005. [DOI] [PubMed] [Google Scholar]
- 24.Kumar SV, Hurteau GJ, Spivack SD. Validity of messenger RNA expression analyses of human saliva. Clin Cancer Res. 2006;12:5033–9. doi: 10.1158/1078-0432.CCR-06-0501. [DOI] [PubMed] [Google Scholar]
- 25.Park NJ, Yu T, Nabili V, Ulmanne S, Hollander V, Brinkman BM, et al. RNAprotect Saliva: An Optimal Room Temperature Stabilizer of Salivary Transcriptome. Clin Chem. 2006 doi: 10.1373/clinchem.2006.075598. In press. [DOI] [PubMed] [Google Scholar]
- 26.Park NJ, Zhou X, Yu T, Brinkman BM, Zimmermann BG, Palanisamy V, Wong DT. Characterization of salivary RNA by cDNA library analysis. Arch Oral Biol. 2006 doi: 10.1016/j.archoralbio.2006.08.014. [DOI] [PMC free article] [PubMed] [Google Scholar]
- 27.Ballantyne J. Validity of messenger RNA expression analyses of human saliva. Clin Cancer Res. 2007;13:1350. doi: 10.1158/1078-0432.CCR-06-2796. author reply 1. [DOI] [PubMed] [Google Scholar]
- 28.Sheflin LG, Zhang W, Spaulding SW. Androgen regulates the level and subcellular distribution of the AU-rich ribonucleic acid-binding protein HuR both in vitro and in vivo. Endocrinology. 2001;142:2361–8. doi: 10.1210/endo.142.6.8164. [DOI] [PubMed] [Google Scholar]
- 29.Doller A, Huwiler A, Muller R, Radeke HH, Pfeilschifter J, Eberhardt W. Protein Kinase C alpha-dependent phosphorylation of the mRNA-stabilizing factor HuR: implications for posttranscriptional regulation of cyclooxygenase-2. Mol Biol Cell. 2007;18:2137–48. doi: 10.1091/mbc.E06-09-0850. [DOI] [PMC free article] [PubMed] [Google Scholar]
- 30.Crooks GE, Hon G, Chandonia JM, Brenner SE. WebLogo: a sequence logo generator. Genome Res. 2004;14:1188–90. doi: 10.1101/gr.849004. [DOI] [PMC free article] [PubMed] [Google Scholar]
Associated Data
This section collects any data citations, data availability statements, or supplementary materials included in this article.


