Abstract
The purpose of this study is to monitor phase transformations in intact trehalose tablets using FT-Raman spectroscopy. Tablets of trehalose dihydrate, amorphous trehalose (obtained by freeze-drying aqueous trehalose solutions), and anhydrous trehalose (β-trehalose) were prepared. The tablets were exposed to different conditions [11% and 0% RH (60°C); 75% RH (25°C)] and monitored periodically over 96 h using Raman spectroscopy. Within 96 h of storage, the following phase transformations were observed: (1) trehalose dihydrate → β-trehalose (11% RH, 60°C), (2) trehalose dihydrate → α-trehalose (0% RH, 60°C), (3) β-trehalose → trehalose dihydrate (75% RH, 25°C), and (4) amorphous trehalose → trehalose dihydrate (75% RH, 25°C). FT-Raman spectroscopy was a useful technique to identify the solid form and monitor multiple-phase transformations in intact trehalose tablets stored at different conditions.
Key words: phase transformation, Raman spectroscopy, tablet, trehalose
INTRODUCTION
Raman spectroscopy is a widely used technique for the physical characterization of pharmaceutical solids. Although often used as a complement to infrared (IR) spectroscopy, Raman analysis offers some distinct advantages. Since sample preparation is not required, Raman spectroscopy is the method of choice for analyzing intact solid dosage forms (tablets and capsules). Spectral changes are readily detected since the peaks are usually sharp and well resolved. Pharmaceutical actives containing aromatic heterocyclic groups can be easily distinguished, even when present at low concentrations, from commonly used partially amorphous excipients which are poor Raman scatterers (1). Moreover, water is a weak Raman scatterer but produces a very strong IR signal in the 3,500–3,000 cm−1 wavenumber region of the spectrum. Therefore, Raman spectroscopy is the method of choice to monitor solid-state transformations in aqueous slurries (2).
Molecules of pharmaceutical interest often contain one or more aromatic heterocyclic rings giving rise to characteristic C―H and C―C stretching as well as highly symmetrical vibrational modes which make them particularly amenable to Raman spectroscopic analysis (3). In the present study, α,α-trehalose(α-d-glucopyranosyl α-d-glucopyranoside) has been used as a model compound to monitor solid-state transformations in intact compacts. Trehalose is a disaccharide and is extensively used as a lyoprotectant in freeze-dried formulations (4). This sugar is commercially available, both in the crystalline anhydrous state (β-trehalose,  ) and as a dihydrate (C12H22O11.2H2O; TH). A second anhydrous form of trehalose, the “dehydrated dihydrate” or α-trehalose
  , may be obtained by slow dehydration of the dihydrate at low temperatures (≤60°C). Amorphous trehalose (Ta) is typically obtained by freeze-drying or spray-drying an aqueous trehalose solution and has a glass transition temperature of ~117°C (5). All the four solid forms of trehalose have been extensively characterized (5–16). Raman spectroscopy can be used to distinguish between these different physical forms of trehalose based on the differences in the positions and intensities of peaks attributed to: (1) asymmetrical and symmetrical vibrational stretchings of the ring C―H (3,015–2,880 cm−1), (2) vibrations in the 900–750 cm−1 region due to conformation of the anomeric carbon, and (3) vibrations from the glucose bands in the 700–200 cm−1 region.
Trehalose was selected as a model compound since there are several physical forms of trehalose and the stability of these forms is strongly dependent on the environmental conditions (4,5,9,10,13,14,16). The nature of the product phase (the physical form as well as its crystallinity) can be strongly influenced by the dehydration conditions of trehalose dihydrate. The primary aim of our study was to use FT-Raman spectroscopy as a rapid and nondestructive technique to identify the physical form of trehalose in intact tablets and monitor the effect of storage conditions on the physical form of trehalose in intact tablets. We have focused on the different solid-state transformations observed in trehalose (hydrate → anhydrate, amorphous → hydrate, hydrate → “dehydrated hydrate,” anhydrate → hydrate) to highlight the utility of Raman spectroscopy in distinguishing these forms. In addition, X-ray powder diffractometry (XRPD), thermogravimetry, and water sorption studies were used to characterize the different physical forms of trehalose. In selected instances, tablets were crushed and subjected to XRPD so as to obtain “bulk” information.
MATERIALS AND METHODS
Materials
α,α-Trehalose was obtained in the anhydrous form (β-polymorph;  ) and as trehalose dihydrate (TH) from ACROS Organics (New Jersey, USA) and used as received. amorphous trehalose (Ta) was obtained by freeze-drying an aqueous trehalose solution (10% w/v) by slightly modifying the method described by Rani et al. (5). Secondary drying was conducted at 40°C for 24 h. Ta so obtained was stored at 60°C (oven) for 4 h and the final water content, determined by thermogravimetry, was ~3% w/w.
  was obtained by dehydrating TH at 60°C (5).
Methods
Water Sorption
About 17 mg of  was placed in the quartz sample pan of an automated vapor sorption analyzer (SGA-100, VTI Corporation, Hialeah, FL), maintained at 25°C. The sample was equilibrated at 0% RH for 100 min, and then the RH was progressively increased, in 10% increments, to 80% with a hold time of 100 min at each step. This was followed by progressive lowering of the RH in 10% decrements, to 0% with the same hold time. The weight gain at the end of the sorption cycle (80% RH) was calculated on the basis of the dry weight.
Tablet Preparation and Storage
TH,  , and Ta powders were passed through a Standard ASTM sieve # 60 (particle size <250 μm). The powder was weighed (200 mg) and compressed to 112–126 MPa on an automated hydraulic Press (Fred S. Carver Inc, Menomonee Falls, WI) and held for 10 s. The tablets were stored over saturated salt solutions, at 25°C and 60°C, to maintain the desired RH (sodium chloride solution—75% RH (25°C), lithium chloride solution—11% RH (60°C), anhydrous CaSO4—~0% RH). TH tablets were stored at 0% and 11% RH (60°C) while
  and Ta tablets were stored at 75% RH (25°C).
FT-Raman and NIR Spectroscopy
Powder samples of TH,  ,
,  , and Ta were sealed in glass vials under nitrogen purge to prevent exposure to ambient environment during data acquisition. The spectra were recorded using a FT-Raman system (Vertex 70 with Raman II Module, Bruker, Billerica, MA) equipped with a 500-mW diode pumped Nd:YAG laser operating at 1,064 nm as the excitation source. Backscattered radiation was collected using a liquid nitrogen-cooled germanium detector. The laser power was 301 mW. For each spectrum, 32 scans were collected and the collection time was approximately 1 min. Tablets of TH,
  , and Ta were analyzed right after preparation (n ≥ 3). The stored tablets were analyzed periodically over 96 h. In each tablet, at least four to five spots were sampled on the tablet surface through sealed glass vials. The data were processed using OPUS® software (version 5.5, Bruker Optics). In addition to FT-Raman, near infrared (NIR) spectra of the powder samples of TH,
  ,
,  , and Ta were collected using a Spectral Dimensions NIR-Cl 2450 spectrometer (Malvern Inc., MA).
RESULTS
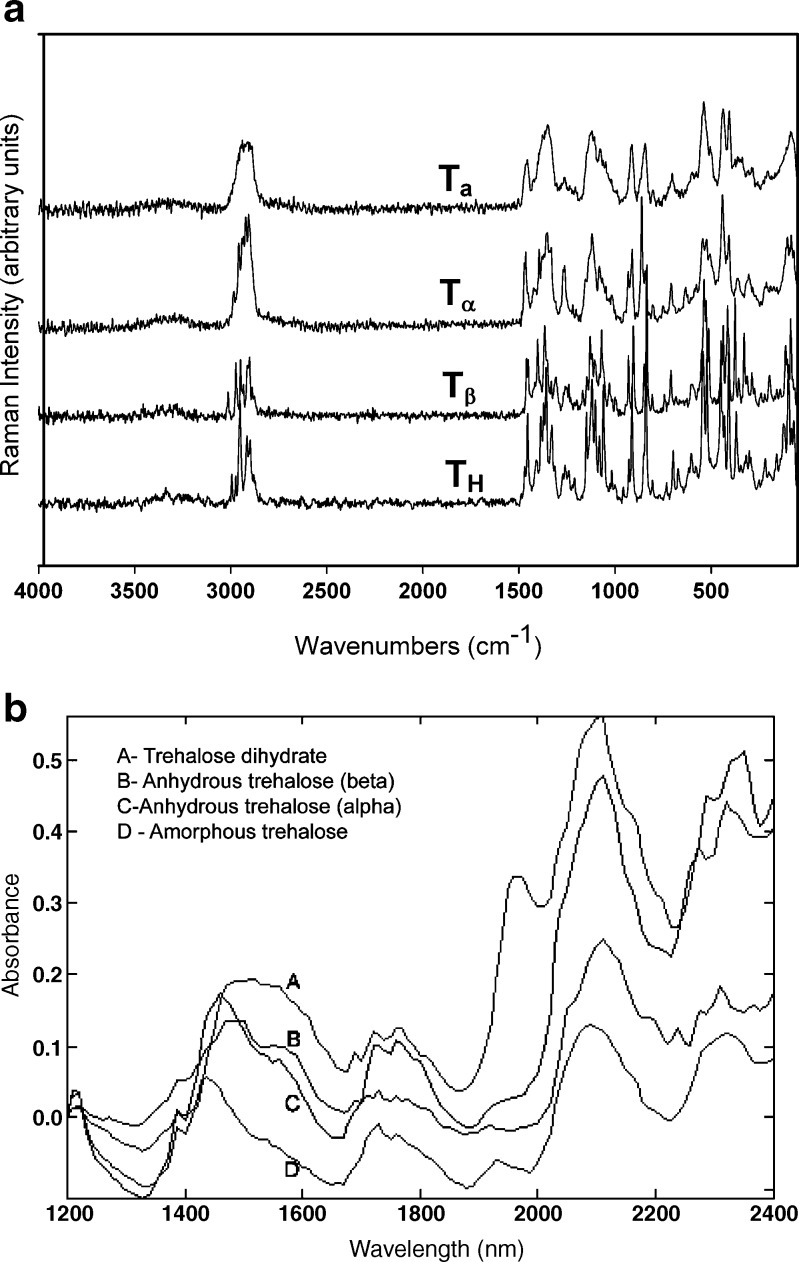
Figure 1a contains the Raman spectra of TH,  ,
,  , and Ta. These forms were also characterized by X-ray diffractometry. The XRPD patterns of the four physical forms of trehalose were in excellent agreement with published data and have, therefore, not been shown (5). Figure 1b shows the NIR spectra of these forms.
Fig. 1.
a Raman spectra of amorphous trehalose (T
a), α-trehalose  (also referred to as “dehydrated dihydrate”), anhydrous β-trehalose
  , and trehalose dihydrate T
H. b NIR spectra of the different solid-state forms of trehalose
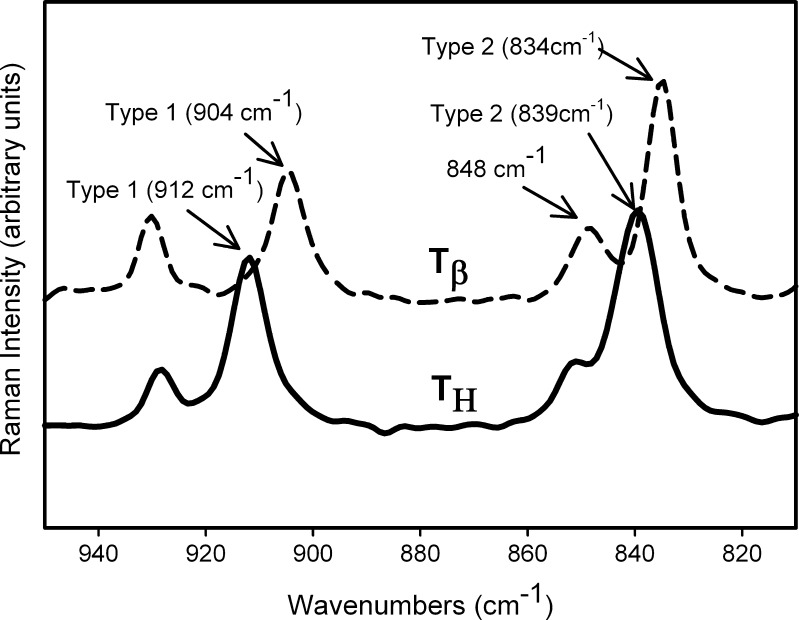
The Raman spectra, in the wavenumber range of 950 to 810 cm−1, are shown in Fig. 2 and highlight the major differences in the spectra of TH and  . The peaks represent vibrations arising from conformation of the anomeric carbon. The position and relative intensity of types 1 and 2 bands (arising due to the α-conformation of the glycosidic linkage of the anomeric carbon at 912 and 839 cm−1, respectively) differ in
  from that in TH. There is a shift in peak position of the type 1 band from 912 in TH to 904 cm−1 in
  . The type 2 band also shifts to a lower wavenumber in
  and the shoulder on this band (as seen in TH) shapes into a peak at 848 cm−1 (4).
Fig. 2.
Raman spectra of T
H and  . The types 1 and 2 bands are indicated
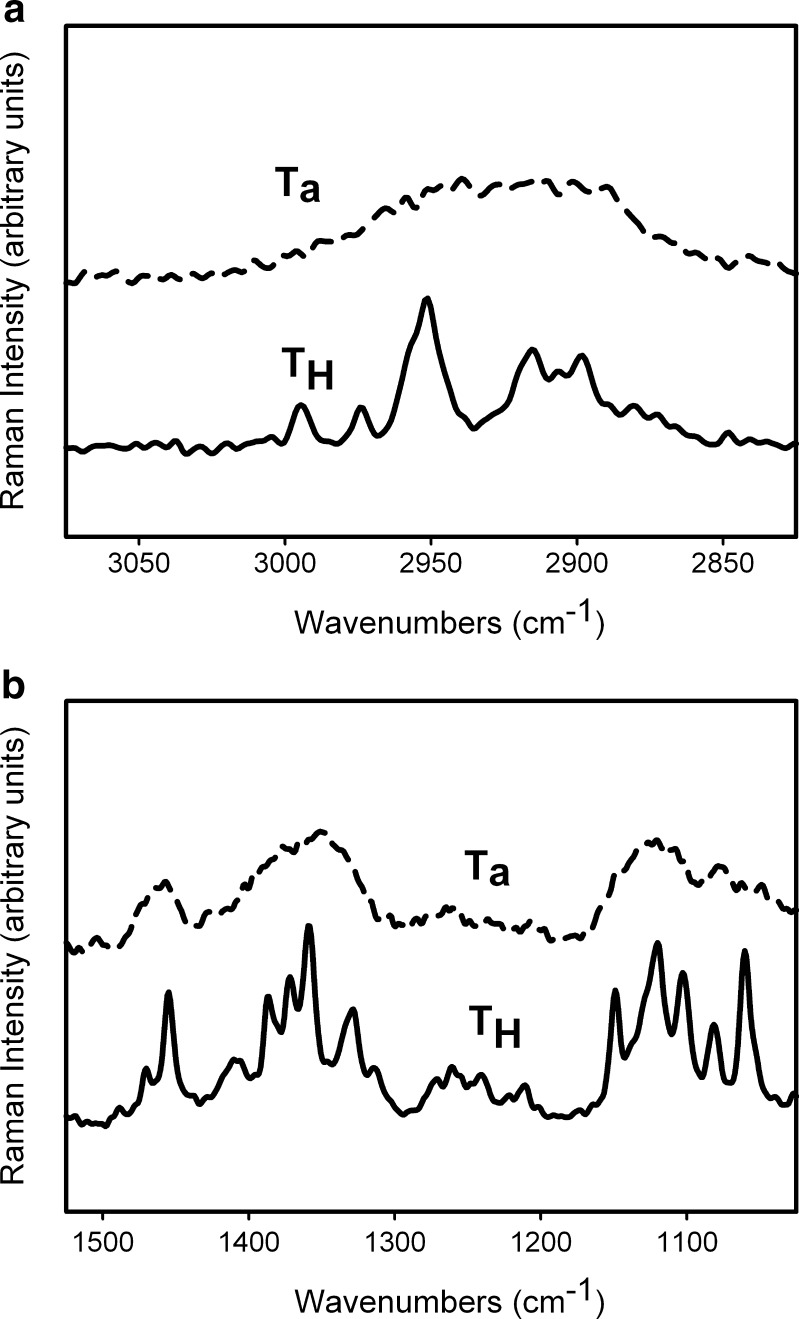
Figure 3 shows the spectra of TH and Ta in two regions—3,075–825 and 1,525–890 cm−1. The peaks in Ta are broader and poorly resolved compared to those in crystalline trehalose (TH). Since the conformation in the glycosidic linkage in trehalose is relatively inflexible, the bands (Type 1 at 912 cm−1 and 2 at 839 cm−1) arising due to its vibration are seen at approximately the same position in Ta and TH (4).
Fig. 3.
Raman spectra of T H and T a in the a 3,075–2,825 and b 1,525–890 cm−1 spectral range. The spectrum of T H shows sharp, well resolved peaks while T a is characterized by broad peaks
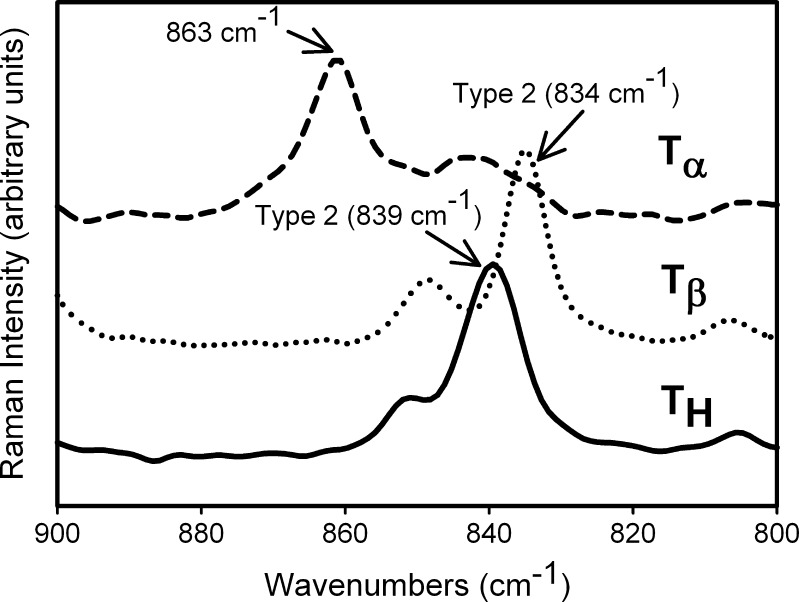
Figure 4 highlights the spectral differences between TH,  , and
, and  in the 1,000–800 cm−1 region. The peak at 863 cm−1 is unique to
  and is not present in either
  or TH (17). Our spectrum is substantially similar to that reported by Gil et al. (17,18). The observed minor differences from the reported spectrum can be attributed to the differences in crystallinity, likely brought about by the method of preparation of
  . We had earlier pointed out that the degree of crystallinity of
  is strongly influenced by its method of preparation (5).
Fig. 4.
Raman spectra of T
H,  , and
, and  in the 900–800 cm−1 spectral range. The type 2 bands of T
H and
  are indicated. The peak at 863 cm−1 is unique to
 Transformation (Hydration of Crystalline Anhydrate)
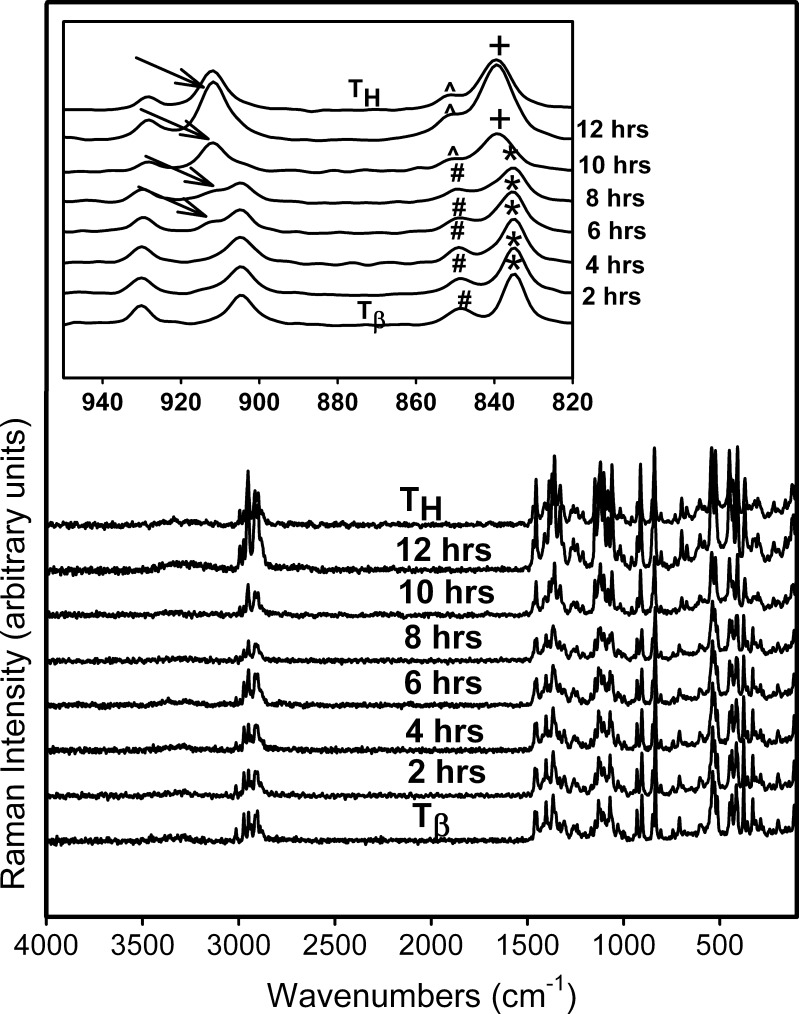
Figure 5 shows the representative Raman spectra of  tablets stored at 75% RH (25°C) up to 12 h. The 950–820 cm−1 range is highlighted in the inset. The spectra of pure forms (TH and
  ) are provided for comparison. After 6 h of storage, a shoulder appeared in the
  peak at 904 cm−1 which corresponded to the type 1 peak of TH at 912 cm−1. By 10 h, the type 1 peak of TH formed completely and the type 2 band shifted to a higher wavenumber, with a small shoulder characteristic of TH. The spectra obtained at ≥10 h of storage of
  (75% RH, 25°C) were identical to that of TH.
Fig. 5.
Raman spectra collected periodically following storage of  at 75% RH (25°C). The spectra of T
H and
  are provided for comparison. The 950–820 cm−1 spectral range is magnified in the inset. Type 1 band of T
H (→) appeared at 6 h of storage. At 10 h, (1) the type 2 band of
  (asterisk) shifted to a higher wavenumber reflecting the appearance of the type 2 band of T
H (plus sign), and (2) the peak at 848 cm−1 (number sign) in
  is reduced to a shoulder in T
H (caret)
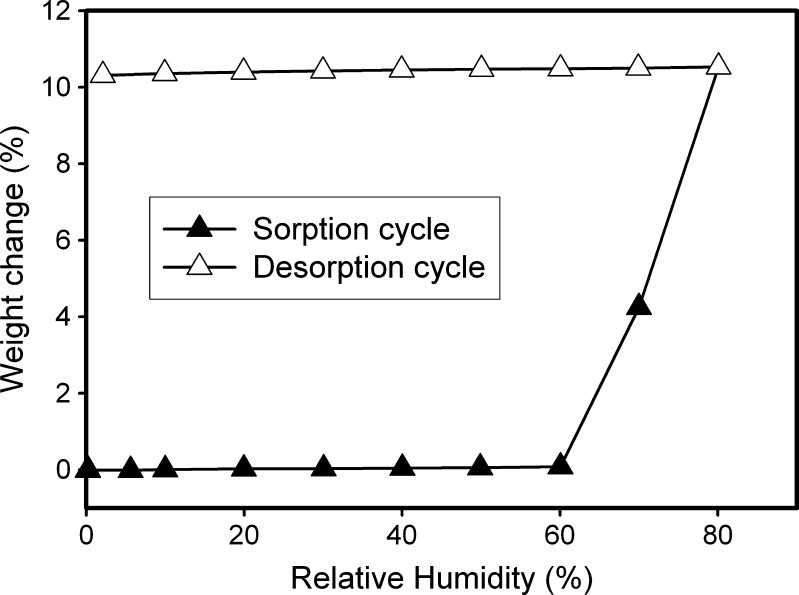
The  → TH transformation at 75% RH was also confirmed by water sorption of
  at 25°C. Figure 6 shows the water sorption–desorption profile of
  . At RH > 60%, the observed weight gain indicated TH formation. When the RH was then progressively lowered to 0%, the negligible weight loss indicated that TH did not dehydrate in the experimental time scale.
Fig. 6.
Water sorption–desorption profile of  (25°C). The sample was equilibrated at 0% RH for 100 min, and then the RH was progressively increased in steps of 10% RH to 80%, with a hold time of 100 min at each step. The RH was then progressively lowered in decrements of 10% to 0% RH with 100 min of hold time at every step. The weight gain, at the end of the sorption cycle (80% RH), was calculated on the basis of the dry weight at 0% RH
Ta → TH Transformation (Crystallization of Amorphous Trehalose to Dihydrate)
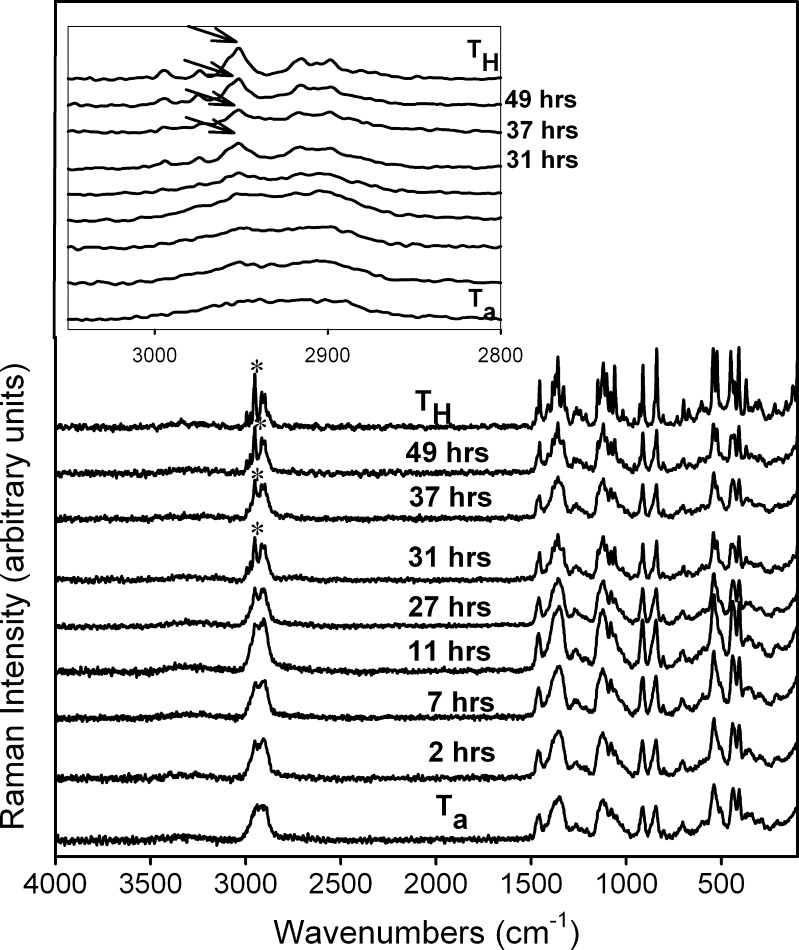
Figure 7 contains the Raman spectra of Ta tablets stored at 75% RH (25°C). The 3,050–2,850-cm−1 range, highlighted in the inset, reveals the appearance of TH. After storage for 30 h, a sharp characteristic peak of TH at 2,952 cm−1 was observed (Fig. 7 inset). From then on, Ta → TH transformation progressed rapidly and by 49 h, almost all the TH peaks appeared. Our results are in agreement with the reported crystallization of Ta at RH ≥ 50% (25°C) (5).
Fig. 7.
Raman spectra collected periodically following storage of T a at 75% RH (25°C). The spectra of T H and T a are provided for comparison. The 3,050–2,850 cm−1 range has been highlighted in the inset to indicate the appearance of T H peaks. In the spectra acquired following storage for 31 h, the crystallization of T H was evident from the increase in intensity and resolution of characteristic T H peaks. The peak at 2,952 cm−1 is a representative example (arrows)
 Transformation (Dehydration to Crystalline Anhydrate)
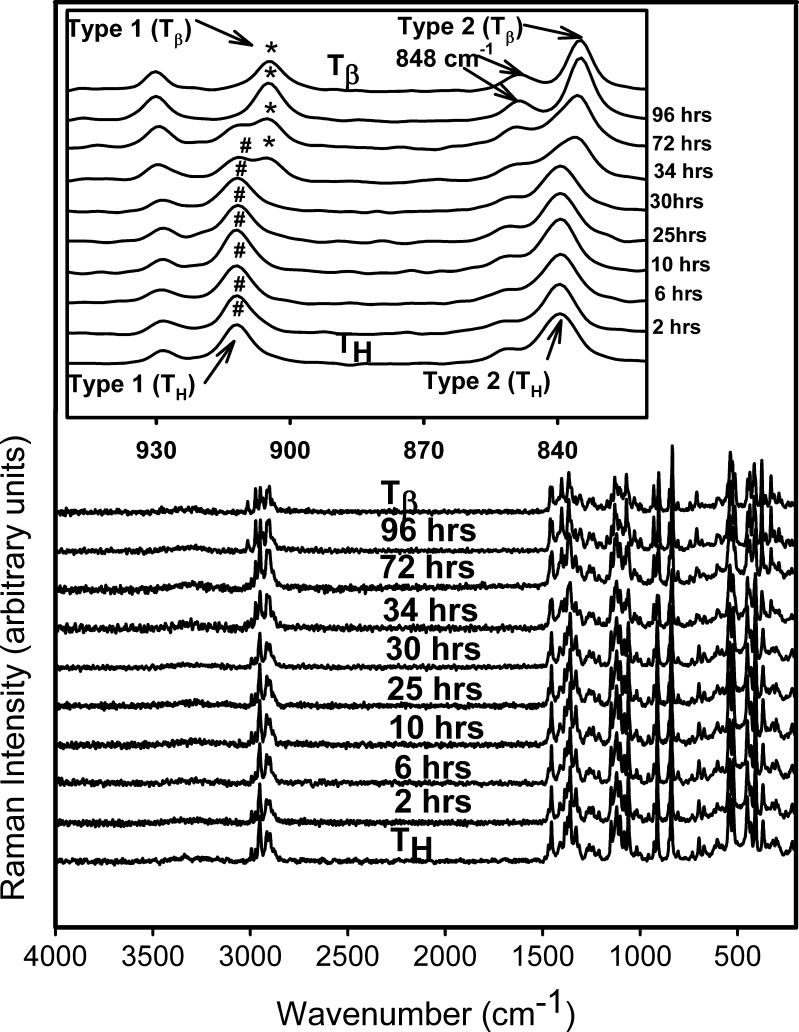
Figure 8 shows representative Raman spectra of TH tablets stored at 11% RH (60°C) for 96 h. The spectral range of 950–820 cm−1 is highlighted in the inset. The spectra of pure forms (TH and  ) are provided for comparison. Although there are literature reports of dehydration of TH to form
  when heated under humid conditions (~60% RH at 60°C) or upon exposure to 20% RH (60°C) for several hours (5,19), our results indicate that
  transition occurs even at lower water vapor pressures (at 60°C). Furuki et al. have provided a “bridge-effect” mechanism to explain this phase conversion (19). Presence of moisture in the surrounding environment of TH acts as an eluant to extract water and “traps” the released water by means of hydrogen bonds. This surrounding moisture layer prevents the lattice from complete collapse and allows for molecular reorganization in the lattice. However, since
  transformation requires conversion from a rhombic to a monoclinic lattice, the transformation kinetics is dependent on both temperature and water vapor pressure (19). This may explain the long time required for the complete
  transformation in TH tablets (tablet surface).
Fig. 8.
Raman spectra collected periodically following storage of T
H at 11% RH (60°C). The spectra of T
H and  are provided for comparison. The 950–820 cm−1 range has been highlighted in the inset. The type 1 band of
  appeared at 34 h of storage. At the same time, the type 2 band of T
H shifted to a lower wavenumber (characteristic of
  ) and its shoulder developed into a peak at 848 cm−1
 Transformation (Dehydration to “Dehydrated” Hydrate)
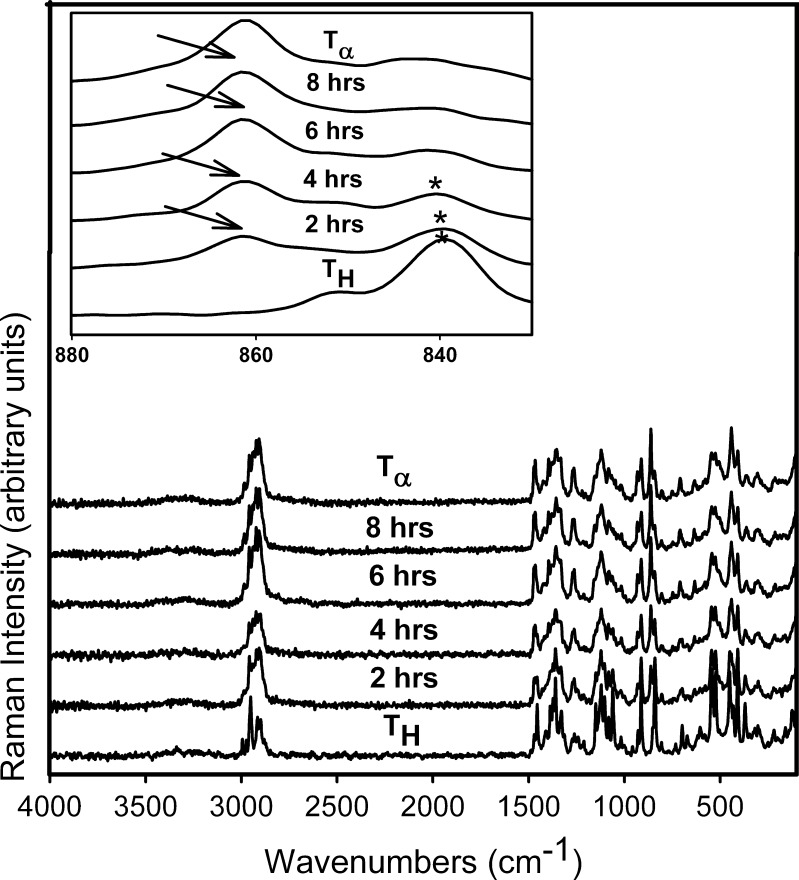
Figure 9 shows the Raman spectra, in the 4,000–20 cm−1 spectral range, of TH stored at 0% RH (60°C). The 900–800 cm−1 region is highlighted in the inset. The gradual loss in spectral features suggests a decrease in crystallinity. The appearance of the peak at 863 cm−1 (inset) at 2 h indicated the formation of  . After storage for 6 h, the formation of
  appeared to be complete. The
  transformation was also observed in powder samples stored at 60°C (under nitrogen purge) for 5 h.
  so formed, while partially crystalline, retains some of the hydrate lattice structure (5).
Fig. 9.
Raman spectra collected periodically following storage of T
H at 0% RH (60°C). The spectra of T
H and  are provided for comparison. The 880–800 cm−1 range has been highlighted in the inset. The characteristic peak of
  (arrow) at 863 cm−1 was observed at 2 h. The
  transition appears to be complete in 8 h
X-ray Powder Diffractometry
Powdered trehalose tablets (TH,  and Ta) were subjected to X-ray powder diffractometry after 4 days of storage at: 25°C/75% RH, 60°C/0% RH, and 60°C/11% RH. The phase transformations observed (data not shown) were the same as by Raman spectroscopy. Since the XRPD studies were conducted on powdered tablets, these results are believed to reflect the phase composition of the “bulk.” It is, therefore, reasonable to assume that the transformation occurred throughout the tablet.
DISCUSSION
We have demonstrated the use of FT-Raman spectroscopy to monitor multiple phase transformations in intact solid dosage forms. The storage conditions, selected based on earlier work on powder samples, facilitated the desired phase transformations in the time scale of hours and days. Other selected applications of Raman spectroscopy in pharmaceutical systems are listed below. (1) Characterization of the physical form of pharmaceuticals (including formulation components), specifically, polymorphic form, state of solvation, and the degree of crystallinity (20–25). (2) Quantification of secondary protein structure (monoclonal antibody) both in solution and in solid-state (26). (3) Chemical form analysis such as determination of tablet composition and impurity identification (27). (4) API quantification in microspheres, suspensions, and capsules (28,29). (5) Quantification of formulation components in packaged formulations (blister packing) (28). (6) Process monitoring (identification and quantification) of physical form of API during high-shear wet granulation (30,31). The increasingly effective “in-line” use of Raman spectroscopy in form analysis (both qualitative and quantitative) in pharmaceutical unit operations has brought to light its potential as a valuable process analytical technology tool in the pharmaceutical industry.
Despite its wide usage, one of the drawbacks of this technique is that it is ideally suited to monitor the surfaces of solid samples. The depth of penetration depends on many factors including the power source, wavelength of excitation, and sample material properties. Though systematic studies were not conducted to determine the depth of penetration, the reported phase information has a considerable surface bias. This is because of the instrumentation parameters as well as the use of compacts (32). XRPD was, therefore, used as a complementary technique to obtain “bulk” information by analyzing the crushed tablets.
Although the present study focused on characterizing a single component dosage form, our results can be readily extended to multicomponent formulations. Since a large fraction of commonly used pharmaceuticals excipients do not exhibit characteristic peaks in the CH stretching region, characterization of the different physical forms of trehalose will be unaffected.
CONCLUSION
In trehalose tablets, the storage conditions (temperature, water vapor pressure) dictate phase transformations ( , Ta → TH,
  , and
, and  ). These transformations, in intact tablets, were monitored by FT-Raman spectroscopy. X-ray diffractometry of powdered tablet samples, confirmed the transformations observed by Raman spectroscopy. Thus, by combining the two techniques, transformations in the tablet surface and bulk were monitored.
Acknowledgements
We thank Kurt Schlegel for freeze-drying trehalose, Gregory Clanton for the water sorption studies and X-ray diffractometry data acquisition, and Edward McCarty for assistance with tabletting. Drs. Nathanial Milton, Gregory Stephenson, and David Moeckly are gratefully acknowledged for their support. A part of the work was carried out by PC during a summer internship at Eli Lilly and Company.
References
- 1.Taylor LS, Langkilde FW. Evaluation of solid-state forms present in tablets by Raman spectroscopy. J Pharm Sci. 2000;89(10):1342–1353. doi: 10.1002/1520-6017(200010)89:10<1342::AID-JPS12>3.0.CO;2-X. [DOI] [PubMed] [Google Scholar]
- 2.Strachan CJ, Rades T, Gordon KC, Rantanen J. Raman spectroscopy for quantitative analysis of pharmaceutical solids. J Pharm Pharmacol. 2007;59(2):179–192. doi: 10.1211/jpp.59.2.0005. [DOI] [PubMed] [Google Scholar]
- 3.Williams AC. Some pharmaceutical applications of Raman spectroscopy. In: Lewis IR, Edwards HGM, editors. Handbook of Raman spectroscopy. New York: Marcel Dekker; 2001. pp. 575–591. [Google Scholar]
- 4.Taylor LS, Williams AC, York P. Particle size dependent molecular rearrangements during the dehydration of trehalose dihydrate. In situ FT-Raman spectroscopy. Pharm Res. 1998;15(8):1207–1214. doi: 10.1023/A:1011935723444. [DOI] [PubMed] [Google Scholar]
- 5.Rani M, Govindarajan R, Surana R, Suryanarayanan R. Structure in dehydrated trehalose dihydrate-evaluation of the concept of partial crystallinity. Pharm Res. 2006;23(10):2356–2367. doi: 10.1007/s11095-006-9058-6. [DOI] [PubMed] [Google Scholar]
- 6.Nagase H, Endo T, Ueda H, Nagai T. Influence of dry conditions on dehydration of alpha, alpha -trehalose dihydrate. STP Pharma Sci. 2003;13(4):269–275. [Google Scholar]
- 7.Nagase H, Endo T, Ueda H, Nakagaki M. An anhydrous polymorphic form of trehalose. Carbohydr Res. 2002;337(2):167–173. doi: 10.1016/S0008-6215(01)00294-4. [DOI] [PubMed] [Google Scholar]
- 8.Nagase H, Ogawa N, Endo T, Shiro M, Ueda H, Sakurai M. Crystal structure of an anhydrous form of trehalose: structure of water channels of trehalose polymorphism. J Phys Chem B. 2008;112(30):9105–9111. doi: 10.1021/jp800936z. [DOI] [PubMed] [Google Scholar]
- 9.Sussich F, Bortoluzzi S, Cesaro A. Trehalose dehydration under confined conditions. Thermochim Acta. 2002;391(1–2):137–150. doi: 10.1016/S0040-6031(02)00171-5. [DOI] [Google Scholar]
- 10.Sussich F, Cesaro A. Transitions and phenomenology of alpha, alpha-trehalose polymorphs inter-conversion. J Therm Anal Calorim. 2000;62(3):757–768. doi: 10.1023/A:1026737811549. [DOI] [Google Scholar]
- 11.Sussich F, Cesaro A. Trehalose amorphization and recrystallization. Carbohydr Res. 2008;343(15):2667–2674. doi: 10.1016/j.carres.2008.08.008. [DOI] [PubMed] [Google Scholar]
- 12.Sussich F, Skopec C, Brady J, Cesaro A. Reversible dehydration of trehalose and anhydrobiosis: from solution state to an exotic crystal? [Erratum to document cited in CA136:37830] Carbohydr Res. 2003;338(11):1259. doi: 10.1016/S0008-6215(03)00098-3. [DOI] [PubMed] [Google Scholar]
- 13.Sussich F, Urbani R, Cesaro A, Princivalle F, Bruckner S. New crystalline and amorphous forms of trehalose. Carbohydr Lett. 1997;2(6):403–408. [Google Scholar]
- 14.Sussich F, Urbani R, Princivalle F, Cesaro A. Polymorphic amorphous and crystalline forms of trehalose. J Am Chem Soc. 1998;120(31):7893–7899. doi: 10.1021/ja9800479. [DOI] [Google Scholar]
- 15.Taga T, Senma M, Osaki K. Crystal and molecular structure of trehalose dihydrate. Acta Crystallogr, Sect B. 1972;28(Pt. 11):3258–3263. doi: 10.1107/S0567740872007824. [DOI] [Google Scholar]
- 16.Taylor LS, York P. Characterization of the phase transitions of trehalose dihydrate on heating and subsequent dehydration. J Pharm Sci. 1998;87(3):347–355. doi: 10.1021/js970239m. [DOI] [PubMed] [Google Scholar]
- 17.Gil AM, Belton PS, Felix V. Spectroscopic studies of solid alpha–alpha trehalose. Spectrochim Acta A. 1996;52A(12):1649–1659. [Google Scholar]
- 18.Belton PS, Gil AM. IR and Raman spectroscopic studies of the interaction of trehalose with hen egg white lysozyme. Biopolymers. 1994;34(7):957–961. doi: 10.1002/bip.360340713. [DOI] [PubMed] [Google Scholar]
- 19.Furuki T, Kishi A, Sakurai M. De- and rehydration behavior of alpha, alpha -trehalose dihydrate under humidity-controlled atmospheres. Carbohydr Res. 2005;340(3):429–438. doi: 10.1016/j.carres.2004.12.003. [DOI] [PubMed] [Google Scholar]
- 20.Kontoyannis CG. Quantitative determination of calcium carbonate and glycine in antacid tablets by laser Raman spectroscopy. J Pharm Biomed Anal. 1995;13(1):73–76. doi: 10.1016/0731-7085(94)00119-M. [DOI] [PubMed] [Google Scholar]
- 21.Langkilde FW, Sjoeblom J, Tekenbergs-Hjelte L, Mrak J. Quantitative FT-Raman analysis of two crystal forms of a pharmaceutical compound. J Pharm Biomed Anal. 1997;15(6):687–696. doi: 10.1016/S0731-7085(96)01906-1. [DOI] [PubMed] [Google Scholar]
- 22.Orkoula MG, Kontoyannis CG. Non-destructive quantitative analysis of risperidone in film-coated tablets. J Pharm Biomed Anal. 2008;47(3):631–635. doi: 10.1016/j.jpba.2008.01.049. [DOI] [PubMed] [Google Scholar]
- 23.Szep A, Marosi G, Marosfoei B, Anna P, Mohammed-Ziegler I, Viragh M. Quantitative analysis of mixtures of drug delivery system components by Raman microscopy. Polym Adv Technol. 2003;14(11–12):784–789. doi: 10.1002/pat.395. [DOI] [Google Scholar]
- 24.Taylor LS, Zografi G. The quantitative analysis of crystallinity using FT-Raman spectroscopy. Pharm Res. 1998;15(5):755–761. doi: 10.1023/A:1011979221685. [DOI] [PubMed] [Google Scholar]
- 25.Tian F, Zeitler JA, Strachan CJ, Saville DJ, Gordon KC, Rades T. Characterizing the conversion kinetics of carbamazepine polymorphs to the dihydrate in aqueous suspension using Raman spectroscopy. J Pharm Biomed Anal. 2006;40(2):271–280. doi: 10.1016/j.jpba.2005.07.030. [DOI] [PubMed] [Google Scholar]
- 26.Sane SU, Wong R, Hsu CC. Raman spectroscopic characterization of drying-induced structural changes in a therapeutic antibody: correlating structural changes with long-term stability. J Pharm Sci. 2004;93(4):1005–1018. doi: 10.1002/jps.20014. [DOI] [PubMed] [Google Scholar]
- 27.King TH, Mann CK, Vickers TJ. Determination of phenylpropanolamine hydrochloride and acetaminophen in pharmaceutical preparations by Raman spectroscopy. J Pharm Sci. 1985;74(4):443–447. doi: 10.1002/jps.2600740415. [DOI] [PubMed] [Google Scholar]
- 28.Niemczyk TM, Delgado-Lopez MM, Allen FS. Quantitative determination of bucindolol concentration in intact gel capsules using Raman spectroscopy. Anal Chem. 1998;70(13):2762–2765. doi: 10.1021/ac971252u. [DOI] [PubMed] [Google Scholar]
- 29.Watts PJ, Tudor A, Church SJ, Hendra PJ, Turner P, Melia CD, et al. Fourier transform-Raman spectroscopy for the qualitative and quantitative characterization of sulfasalazine-containing polymeric microspheres. Pharm Res. 1991;8(10):1323–1328. doi: 10.1023/A:1015872300730. [DOI] [PubMed] [Google Scholar]
- 30.Wikstrom H, Carroll WJ, Taylor LS. Manipulating theophylline monohydrate formation during high-shear wet granulation through improved understanding of the role of pharmaceutical excipients. Pharm Res. 2008;25(4):923–935. doi: 10.1007/s11095-007-9450-x. [DOI] [PubMed] [Google Scholar]
- 31.Wikstrom H, Marsac PJ, Taylor LS. In-line monitoring of hydrate formation during wet granulation using Raman spectroscopy. J Pharm Sci. 2005;94(1):209–219. doi: 10.1002/jps.20241. [DOI] [PubMed] [Google Scholar]
- 32.Kogermann K, Zeitler JA, Rantanen J, Rades T, Taday PF, Pepper M, et al. Investigating dehydration from compacts using terahertz pulsed, Raman, and near-infrared spectroscopy. Appl Spectrosc. 2007;61(12):1265–1274. doi: 10.1366/000370207783292136. [DOI] [PubMed] [Google Scholar]


