Abstract
Determining the relationship between the dendritic spine morphology and its functional properties is a fundamental while challenging problem in neurobiology research. In particular, how to accurately and automatically analyze meaningful structural information from a large microscopy image dataset is far away from being resolved. In this paper, we propose a novel method for the automated neuron reconstruction and spine detection from fluorescence microscopy images. After image processing, backbone of the neuron is obtained and the neuron is represented as a 3D surface. Based on the analysis of geometric features on the surface, spines are detected by a novel hybrid of two segmentation methods. Besides the automated detection of spines, our algorithm is able to extract accurate 3D structures of spines. Comparison results between our approach and the state of the art shows that our algorithm is more accurate and robust, especially for detecting and separating touching spines.
Index Terms: Spine detection, geometric measurement estimation, watershed, microscopy images
1. INTRODUCTION
In neurobiology research, 3D neuron reconstruction and dendritic spine identification on a large data set of microscopy images is essential for understanding the relationships between morphology and function of dendritic spines [1]. Dendrites are the tree-like structures of neuronal cells, and spines are small protrusions on the surface of dendrites. Spines have various visual shapes (e.g., mushroom, thin, and stubby) and can appear or disappear over time. Existing neurobiology literature shows that the morphological changes of spines and the dendritic spine structures are highly correlated with their underlying cognitive functions [1]. Therefore, how to efficiently and accurately detect and extract spines are crucial. Recently developed dendritic spine detection methods can be roughly divided into two categories: 2D MIP (maximum intensity projection) image-based algorithms [2] and 3D data-based algorithms [3, 4]. The major drawbacks of the 2D MIP methods are: (1) 3D microscopy images are projected to a 2D plane, a significant amount of information such as spines that are orthogonal to the imaging plane will be lost; and (2) dendritic structures which overlap along the projection direction are difficult to extract. Considering these limitations, Rodriguez et al. [3] proposed an automated three-dimensional spine detection approach using voxel clustering. In their method, the distances from the voxels to the closest point of the surface were used as the clustering criteria. Janoos et al. [4] extracted the dendritic skeleton structure of neurons using the medial geodesic function that directly works on the reconstructed iso-surfaces. In this paper, we propose a new automated technique for detecting dendritic spines from fluorescence microscopy neuronal images, which only requires the user clicking a few points in the image.
The pipeline of our approach is illustrated in Fig. 1. In the image processing stage, de-noising filters are employed, followed by the fast Rayburst sampling based backbone extraction [5]. Then, an iso-surface of neurons is obtained by applying the marching cube algorithm [6] and a surface fairing algorithm [7]. After that, dendrites and spines are represented as a 2-manifold surface on which our spine detection algorithm is performed. Advantages of this representation are: (1) Physical smoothness of the neuron shapes is guaranteed, and geometric measurements such as surface normals and curvatures can be easily estimated; and (2) instead of analyzing every voxel on the boundary or inside the neurons, surface representation expedites the spine detection procedure. During the spine detection stage, geometric measurements on the surface are estimated, and then a score map is computed as the weighted sum of these geometric measurements. Finally, spines are detected and segmented by a hybrid of surface-based watershed [8] and region growing methods.
Figure 1.
The pipeline of our proposed 3D method for dentritic spine analysis.
2. OUR APPROACH
2.1. Neural image acquisition and preprocessing
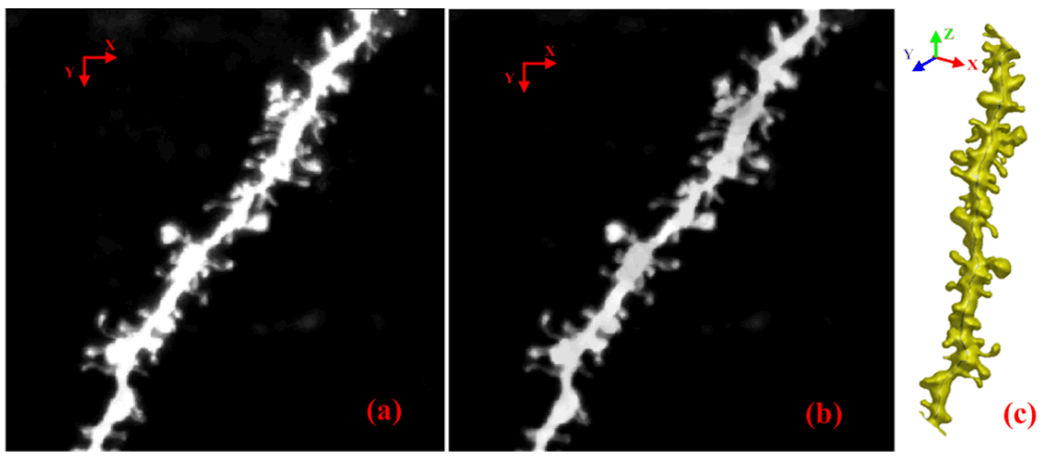
3D images of neuron dendrites in rat were obtained by using two photon laser scanning microscopy. The image stack has 512 × 512 × 101 voxels with a resolution of 0.064× 0.064× 0.12 µm/voxel. In the preprocessing stage, a 3D median filter with a 3 × 3 × 3 kernel size was first applied to the images to remove noise. Then, to correct uneven illumination degradation, a top-hat filter was adopted. Fig.3(b) shows the preprocessed image data. In our approach, images containing multiple neurons can also be processed.
Figure 3.
(a) Maximum intensity projection image of the original image. (b) MIP image after preprocessing. (c) The reconstructed 3D model of neuron with backbone.
2.2. Neuron backbone extraction
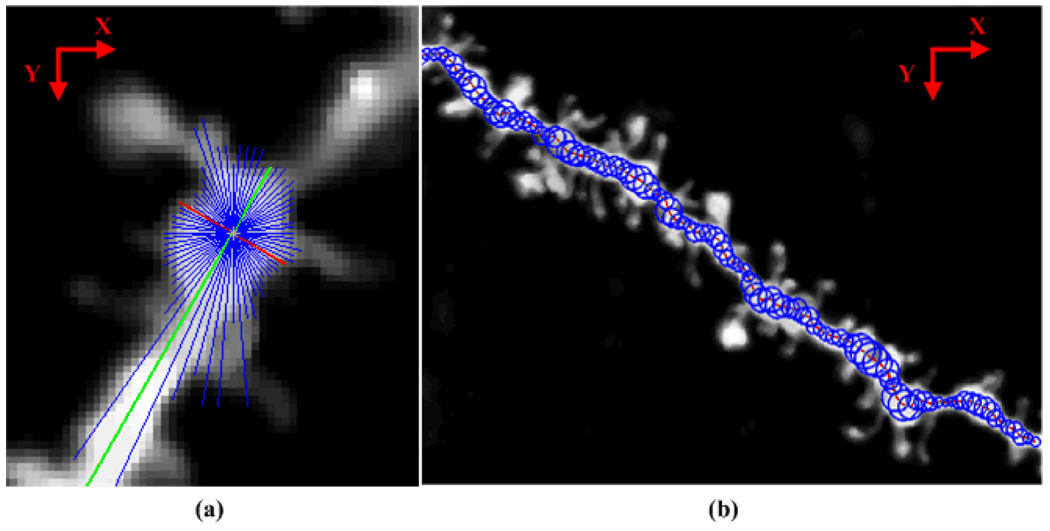
After the data preprocessing, dendrite backbone, as well as the estimated radius along the backbone, is generated by casting rays inside of the dendrite. Rayburst sampling, an algorithm for automated 3D shape analysis was first proposed by Rodriguez et al. [5]. The sampling core can be 2D or 3D with a variable number of rays that are uniformly spaced within a unit sphere. They also showed [5] that comparing with 3D Rayburst sampling, 2D Rayburst in the XY and XZ (or YZ) planes is less computational-expensive, while it reliably yields comparable results. Inspired by this idea, our Rayburst sampling algorithm works as follows: at the beginning, a seed point (an initial center point) inside of the dendrite is selected by the user. Then, 2D Rayburst sampling in both the XY and XZ (or YZ) planes are adopted.
A threshold φ is used to control the maximally allowed intensity difference between the center point of a neuron and its dendritic boundary. φ serves as a threshold to stop the rays going outside of the neuron surface. The length of the shortest ray in XY plane is the estimated diameter, and the location of the center point is updated as the midpoint of the shortest ray. Rays sampled in the XZ (or YZ) plane, are used to adjust the Z coordinate of the center point. The next two center points toward both ends of the dendrite are predicted following the local orientation of the current center point. The orientation of the longest ray in XY plane is the approximated local orientation of the dendrite. The procedure is repeated until the predicted center point reaches the border of the stack or it goes into the background. If the dendrite contains a branch structure, a seed point for each branch is needed from the user selection. In this work, the number of rays is 36 and φ is experimentally set to 80. Fig. 2 illustrates this process and one of the results.
Figure 2.
Illustration of Rayburst sampling. (a) Rayburst sampling in XY plane. Blue lines show the rays casting out in all directions from the predicted center point. The red line is the ray with the shortest length (diameter) while the green line has the longest length (local orientation). (b) Extracted backbone of the neuron and the estimated radius are shown in the MIP image.
2.3. 3D neuron reconstruction
Fuzzy C-mean clustering [10] is adopted to cluster the image into three clusters: background, weak spines, and dendrite with strong spines. Weak spines and the dendrite represent the neuron. Subsequently, we employ the marching cubes algorithm [6] to reconstruct the 3D surface of the neuron. Then, a low-pass filter [7] and mesh decimation are used to remove noises and reduce the tessellation density. The number of iterations in the low-pass filter and the decimation factor control the smoothness of the resultant surface. Fig. 3(c) shows the reconstructed 3D surface of the neuron.
2.4. Geometric measurements and spine detection
In this paper, we propose a novel spine detection algorithm based on the geometric measurements on the reconstructed 3D neuron surface.
2.4.1. Computation of neuron geometric measurements
Computing the geometric measurements on a smooth neuron surface is more accurate and robust than those on volumetric image data. Based on the geometric and spatial relationship between dendrites and spines, the following three geometric measurements are chosen for spine detection in this work:
Distance to the backbone of the dendrite
Distances between a vertex v on the neuron surface and every point in the backbone are calculated, and the shortest one is chosen as the distance from v to the backbone. Choosing this measurement is based on the observation that vertices on the surface of spines usually have longer distances than those on the dendrite.
Mean curvature on the surface
The 3D neuron surface is 2-manifold, and calculating the surface curvature directly by the mathematical definition is computationally expensive. Therefore, a number of algorithms [8, 9] have been proposed to estimate the surface curvature on 3D meshes. Our calculation is based on the covariance matrix of the surface normals. When we calculate the curvature at a vertex v, we construct the covariance matrix as follows:
| (1) |
Here ni are the normals of all v ’s neighbors on the mesh, n̅ is the mean normal, and k is the number of v ’s neighbors. Let λ0 ≤ λ1 ≤ λ2 be the eigen-values of C with corresponding eigenvector e0 , e1 and e2 . In [9], it has been demonstrated that for a local small region around vertex v , the two smallest eigen-values λ0 and λ1 of the covariance matrix C are proportional to the squares of the principle curvature k1 and k2 at v , and the corresponding eigenvectors e0 and e1 are the principle directions. Therefore, the mean curvature can be estimated as .
Normal variance
Normal variance is defined as the angle between the normal vector n1 at vertex v on the surface with the vector n2 that passes v and perpendicular to the backbone. The angel between the two vectors is calculated as:
| (2) |
2.4.2. Spine detection
The above three geometric measurements are complementary for each other. Experiment showed that using the combination of these three measurements for spine detection is robust and non-sensitive to noises. Therefore, a score map is generated as the weighted sum of the three measurements for the spine detection. These three measurements were normalized to 0–1 and equally weighted.
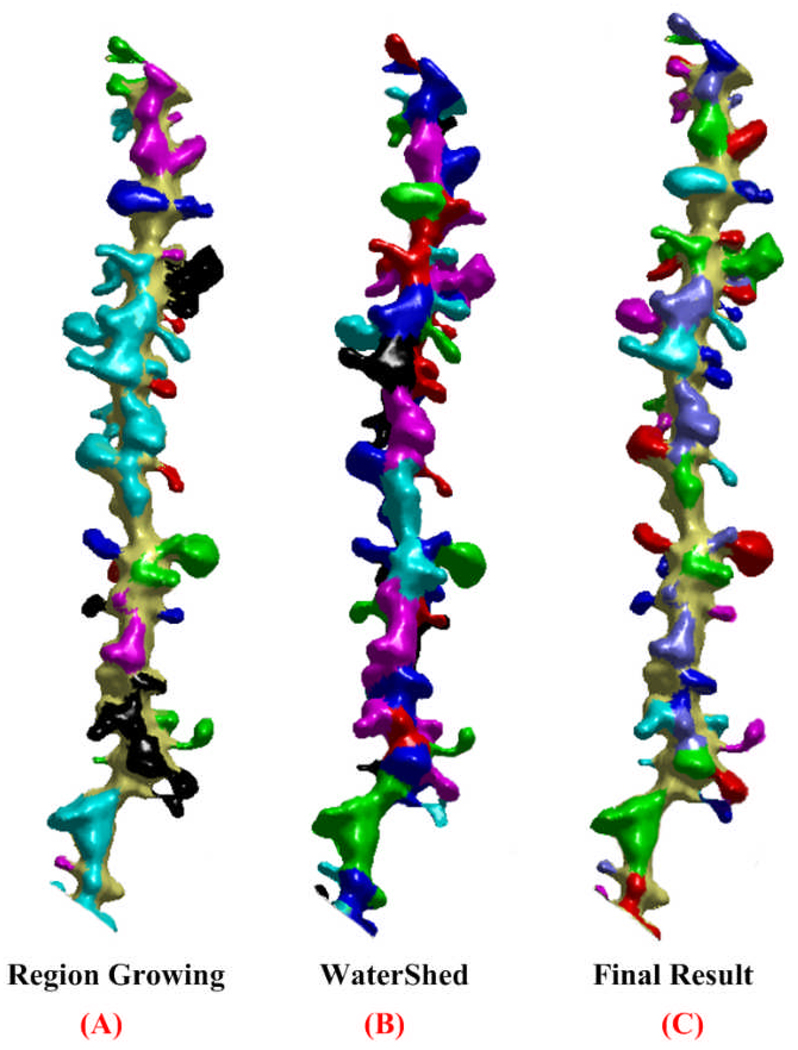
Based on the generated score-map, two surface-based segmentation methods, region growing and watershed, are employed. In the region growing step, vertices whose values in the score map are greater than ξ (a threshold) will be randomly selected as seed points and will be put in a stack. Subsequently, when we pop a vertex out from the stack, we will examine the values of its neighbors. If the values are larger than ξ , and they were not visited before, the neighbors will be pushed into the stack. This process repeats until the stack is empty. In this work, ξ is experimentally set to 0.2. As we can see from Fig. 4(a), by adopting region growing, spines can be perfectly separated from the dendrite; however spines that are close together cannot be separated from each other. Therefore, how to separate touching spines becomes our next task.
Figure 4.
Detection and reconstruction results. (a) and (b) display the results of Region Growing and Watershed. (c) shows the final detection and reconstruction result.
Mangan et al. [8] introduced this technique to partition a 3D mesh into useful segments. In their work, curvatures on the mesh surface are used as indications of region boundaries. After the watershed algorithm is applied, each resultant segmented patch has a relatively consistent curvature, and it is bounded by higher curvatures. In this work, besides curvatures, values in the score map that combines three geometric features are incorporated for the spine detection.
Our extended surface-based watershed segmentation algorithm proceeds as follows:
Find the local maxima vertices in the score map and assign each a unique label.
Traverse through unlabeled vertices. In each step, we traverse form a vertex to its neighbor that has the highest score among all the neighbors, this process repeats until a labeled region is encountered. All the vertices in the path will be assigned the same label as that of the encountered region.
Merge regions whose watershed depths are below 0.3. A watershed depth is defined as the difference between the largest score in the region and the smallest score on the boundary.
Vertices that have the longest distance to the backbone in each region are identified, and the geodesic distance between every two of these vertices are computed.
If the computed geodesic distances are smaller than γ, the corresponding regions are merged. In this work, γ is experimentally set to 0.64.
The segmentation result of the watershed algorithm is shown in Fig. 4(b) that shows spines especially touching spines were well detected and segmented. The intersection regions of the watershed result and the region growing method yields the final reconstructed 3D shapes of spines, which are displayed in Fig.4(c).
3. RESULTS
We implemented our algorithm in Matlab. The average computing time on a dataset is about two minutes on a personal computer with an Inter® Pentium® Dual CPU E2200 and 2G Memory. To evaluate and validate our method, we compared our detection results with a state of art spine detection software (NeuronStudio, www.mssm.edu/cnic/tools-ns.html) on three chosen datasets. NeuronStudio is based on the 3D spine detection algorithm proposed by Rodriguez et al. [3]. The comparison results are presented in Table 1.
Table 1.
Comparative results of our method and those of NeuroStudio.
| True Positive Rate |
Miss Spine Rate |
Num of Touching Spines |
|
|---|---|---|---|
| Our 3D method | 90.84% | 6.25% | 7 |
| NeuronStudio | 73.64% | 12.5% | 9 |
As we can see from Table 1 that most of the spines can be detected by our algorithm with a higher true positive rate, and furthermore, our algorithm can more accurately detect and separate touching spines than NeuronStudio.
4. CONCLUSIONS
In this paper, we present a new automated method for 3D dendritic spine detection from fluorescence microscopy image. By representing neurons as smooth 3D surfaces, robust geometric features that are crucial to the task of spine detection are computed. Then dendritic spine structures can be efficiently and accurately detected using a hybrid of two surface-based segmentation algorithms. With the aid of the detected and reconstructed spine structures, their morphological features such as spine length, volume, radius can be computed to help neurobiologists delineate the mechanism and pathways of neurological conditions. Comparison results between our approach and a state of the art method shows that our algorithm is more accurate and robust, especially for detecting and separating touching spines. In the future, we plan to further improve and extend our algorithm to track spines on time-lapse data sets in order to track the morphology changes of spines over time.
ACKNOWLEDGEMENTS
This research is supported by a Bioinformatics Program grant from The Methodist Hospital Research Institute, John S Dunn Foundation Distinguished Endowed Chair, and NIH R01 LM009161 to STCW.
REFERENCES
- 1.Yuste R, Bonhoeffer T. Morphological changes in dendritic spines associated with long-term synaptic plasticity. Annual Reviews in Neuroscience. 2001;24:1071–1089. doi: 10.1146/annurev.neuro.24.1.1071. [DOI] [PubMed] [Google Scholar]
- 2.Chen J, Zhou X, Miller E, Witt RM, Zhu J, Sabatini BL, Wong STC. A Novel Computational Approach for Automatic Dendrite Spines detection in Two-photon Laser Scan Microscopy. J Neurosc. Methods. 2007 Sep 15;165(1):122–134. doi: 10.1016/j.jneumeth.2007.05.020. [DOI] [PMC free article] [PubMed] [Google Scholar]
- 3.Rodriguez A, Ehlenberger DB, Dickstein DL, Hof PR, Wearne SL. Automated Three-Dimensional Detection and Shape Classification of Dendritic Spines from Fluorescence Microscopy Images. PLoS One. 2008 Apr 23;3(4):e1997. doi: 10.1371/journal.pone.0001997. [DOI] [PMC free article] [PubMed] [Google Scholar]
- 4.Janoos F, Mosaliganti K, Xu X, Machiraju R, Huang K, Wong STC. Robust 3D Reconstruction and Identification of Dendritic Spines from Optical Microscopy Imaging. Medical Image Analysis. 2009 Feb;13(1):167–179. doi: 10.1016/j.media.2008.06.019. [DOI] [PMC free article] [PubMed] [Google Scholar]
- 5.Rodriguez A, Ehlenberger DB, Hof PR, Wearne SL. Rayburst sampling, an algorithm for automated three-dimensional shape analysis from laser scanning microscopy images. Nature Protocols. 2006;1(4):2152–2161. doi: 10.1038/nprot.2006.313. [DOI] [PubMed] [Google Scholar]
- 6.Nielson GM, Hamann B. The asymptotic decider: resolving the ambiguity in marching cubes; Proc. of IEEE Conference on Visualization; 1991. pp. 83–91. [Google Scholar]
- 7.Taubin G. a signal processing approach to fair surface design; SIGGRAPH '95: Proc. 22nd annual conference on Computer graphics and interactive techniques; 1995. pp. 351–358. [Google Scholar]
- 8.Mangan AP, Whitaker RT. Partition 3D surface meshes using watershed segmentation; IEEE Trans Visualization and Computer Graphics; 1999. pp. 308–321. [Google Scholar]
- 9.Jiang J, Zhang Z, Ming Y. Data segmentation for geometric feature extraction from lidar point clouds; Proc. of IGARSS’05. IEEE International; 2005. pp. 3277–3280. [Google Scholar]
- 10.Pham T, Crane D, Tran T, Nguyen T. Extraction of fluorescent cell puncta by adaptive fuzzy segmentation. Bioinformatics. 2004;20:2189–2196. doi: 10.1093/bioinformatics/bth213. [DOI] [PubMed] [Google Scholar]


