

Abstract
Melanoma, one of the most lethal forms of skin cancer, remains resistant to currently available treatments. Therefore, novel mechanism and target-based approaches are needed for the management of this neoplasm. Polo-like kinase 1 (Plk1) has been shown to be a crucial regulator of mitotic entry, progression and exit. Elevated Plk1 has been associated with aggressiveness of several cancer types as well as with poor disease prognosis. However, the role of Plk1 in melanoma is not well-established. Here, we demonstrate that Plk1 is over-expressed in both clinical tissue specimens and cultured human melanoma cells (WM115, A375 and HS294T) when compared to normal skin tissues and cultured normal melanocytes, respectively. Further, Plk1 gene knockdown via Plk1 specific shRNA or its activity inhibition by a small molecule inhibitor resulted in a significant decrease in the viability and growth of melanoma cells without affecting normal human melanocytes. In addition, Plk1 inhibition resulted in a significant i) decrease in clonogenic survival, ii) multiple mitotic errors, iii) G2/M cell cycle arrest, and iv) apoptosis of melanoma cells. This study suggests Plk1 may have a functional relevance towards melanoma development and/or progression. We suggest that targeting of Plk1 may be a viable approach for the treatment of melanoma.
Keywords: Polo-like kinase, Melanoma, Mitosis
Introduction
Melanoma is one of the most aggressive metastatic and lethal forms of skin cancer that has frustrated both clinicians and researchers for several decades. The incidence of melanoma has been increasing at an alarming rate; it is estimated that ~62,000 new cases of melanoma will have been diagnosed with over 8,000 expected deaths due to the disease in the year 2008 (Jemal et al., 2008). A recent analysis of the SEER (Surveillance, Epidemiology, and End Results) program data has suggested that the age-adjusted annual incidence of both young men and women has alarmingly increased over the past 20 years (Purdue et al., 2008). Most of the available therapeutic regimens have not been able to achieve greater than 25% response (Hocker et al., 2008). Similarly, the prevailing preventive approaches have not been successful in curtailing the growing incidence of this neoplasm. Given the rising incidence of melanoma and the paucity of effective treatments, novel mechanism and target-based approaches are needed to control this neoplasm.
An orchestrated control of cell cycle, including mitotic cell division, is essential and an error-free chromosomal segregation during cell division is of utmost importance for the maintenance of correct ploidy and genomic integrity; and errors in cell division may result into aneuploidy and cancer (Rajagopalan and Lengauer, 2004; Santamaria et al., 2007; Schmit and Ahmad, 2007). For a proper cell division, the daughter cells must receive the correct complement of chromosomes, for which, two critical events are required; 1) the chromosomes need to be equally segregated with the help of the mitotic spindle, and 2) cytokinesis (the process dividing the cell into two) must occur without error (Rajagopalan and Lengauer, 2004; Santamaria et al., 2007; Schmit and Ahmad, 2007). Both of these processes are controlled in part by a critical cell cycle regulator, Polo-like kinase 1 (Plk1), a member of a family of conserved serine/threonine protein kinases. The founding member of all Plks, polo, was originally discovered in Drosophila melanogaster (Llamazares et al., 1991). Since its discovery, conserved polo homologs have been defined across a variety of species, including mammals, yeast, zebrafish, Xenopus laevis, and Caenorhabditis elegans (Takai et al., 2005). Of the four mammalian Plks (Plk 1-4), Plk1 is the most widely studied member of the family. Plk1 gene expression is tightly controlled with mRNA accumulation beginning in S phase with peak levels detected at the G2/M transition and through mitosis with a corresponding increase in protein levels and kinase activity paralleling the increase in mRNA (Lee et al., 1995). Plk1 contributes to multiple processes at both the G2/M transition and throughout mitosis, including: activation of the Cdk1/cyclin B1 cascade, centrosome maturation, bipolar spindle formation, the regulation of Emi1 degradation at mitotic exit and cytokinesis (Burkard et al., 2007; Descombes and Nigg, 1998; Eckerdt and Strebhardt, 2006; Lane and Nigg, 1996; Ohkura et al., 1995; Roshak et al., 2000; Toyoshima-Morimoto et al., 2001; Toyoshima-Morimoto et al., 2002). Plk1 is also able to destabilize and reduce p53 activity through direct binding and phosphorylation of p53 (Ando et al., 2004).
In mammalian cells, a dysregulation of Plk1 has been shown to result in the formation of abnormal centrosomes, leading to increased chromosomal instability, aneuploidy and tumor development (Simizu and Osada, 2000). Further, forced over-expression of Plk1 in normal cells has been found to cause a transformed phenotype and increased tumorigenicity, suggesting that Plk1 acts as an oncogene (Smith et al., 1997). In addition, both genetic and chemical inhibition of Plk1 expression levels and activity, respectively, have been shown to result in a decrease in cell growth in certain cancer cells (Lansing et al., 2007; Reagan-Shaw and Ahmad, 2005; Spankuch-Schmitt et al., 2002; Strebhardt and Ullrich, 2006). Interestingly, Liu and Erikson have shown that Plk1 depletion did not impart anti-proliferative effects in normal cells with a higher proliferative index (hTERT-RPE1 and MCF10A) and the cells continued to proliferate at a similar rate when compared to control for up to two weeks (Liu et al., 2006). The authors found that unless p53 expression was concomitantly knocked down with Plk1, these normal cells, even with >90% Plk1 elimination, did not show obvious changes in mitotic phenotypes or proliferative indices (Liu et al., 2006).
Studies have shown that Plk1 i) is over-expressed in several human cancers, ii) could serve as a marker for cancer progression, and iii) is strongly associated with a poor prognosis in some types of cancer. (Eckerdt et al., 2005; Kneisel et al., 2002; Reagan-Shaw and Ahmad, 2005; Strebhardt et al., 2000; Takai et al., 2005; Weichert et al., 2004a; Weichert et al., 2004b; Weichert et al., 2005b; Yamada et al., 2004). Interestingly, Plk1 expression has been shown to be independent of the proliferation marker Ki-67 expression (Ito et al., 2004; Mito et al., 2005; Takai et al., 2001a; Takai et al., 2001b; Weichert et al., 2005a). Based on these, the essential role in mitosis, and the fact that it possesses two possible targeting sites (the catalytic kinase domain and the conserved polo box domains), Plk1 is being increasingly appreciated as an attractive target for the management of certain cancers (Eckerdt et al., 2005; Reagan-Shaw and Ahmad, 2005; Schmit and Ahmad, 2007; Strebhardt and Ullrich, 2006; Takai et al., 2005).
The functional role of Plk1 in melanoma is not well understood. Two reports have suggested that Plk1 may have prognostic significance in patients with melanoma (Kneisel et al., 2002; Strebhardt et al., 2000). These reports stress on the need for detailed in-depth studies to determine if i) Plk1 has any functional significance in melanoma, and ii) if Plk1 could be exploited as a target for the development of drugs or preventive approaches towards the management of this fatal disease. This study was designed to determine the functional significance of Plk1 in melanoma. Our data suggested that Plk1 plays a critical role in melanoma cell survival and could serve as a target for the development of novel approaches to combat this disease.
Results
Plk1 is over-expressed in human melanoma tissues versus normal skin
As a first step of our study, employing a human tissue microarray containing 40 normal and 37 malignant melanoma samples (both matched adjacent and unmatched samples), we determined the expression pattern of Plk1 in clinical human melanoma samples. The tissue microarray consisted of tumor samples mostly arising from the skin, but also from the oral cavity, esophagus, rectum, and cunnus. They represented a range of grades using the tumor-node-metastasis (TNM) grading system. There was an even range of invasiveness (T2 to T4) and very few samples showing metastasis with one sample showing metastasis to four or more lymph nodes (N2) and none with distant metastasis (M0). We found that melanoma samples showed strong immunostaining of Plk1 compared to normal epidermal cells, representative images of both normal and malignant melanoma of different scores are shown in Figure 1A. Positive Plk1 cores showed a homogenous, granular, cytoplasmic staining. Of the 40 individual normal cores, the epidermis of 38 cases (95%) were scored as negative or weak staining, with only two cores (5%) scored as moderate and none scored as strong (Figure 1B). Having a low, yet detectable level of Plk1 (weak) in normal skin tissue is not surprising as the skin is constantly turning over. Conversely, of the 37 malignant melanoma cores, 5 cases (13.5%) were scored as negative, 10 cases (27%) scored as weak, and 22 cases (60%) were scored as moderate or strong staining for Plk1. Statistically, when the tissue types (normal or melanoma) were grouped and compared as either negative or weak versus moderate or strong staining, we found that Plk1 is significantly over-expressed in melanoma (Figure 1C).
Figure 1. Plk1 is over-expressed in human melanoma tissues compared to normal skin tissue samples.
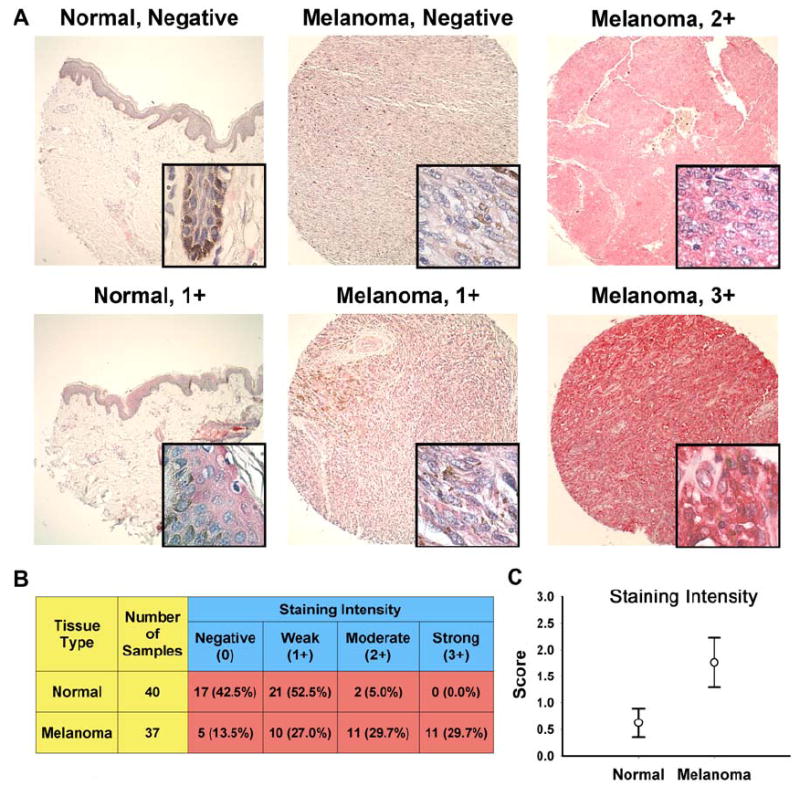
A) Immunohistochemical staining of Plk1. A tissue micro-array was stained for Plk1; Vector Red (Vector Labs) substrate was used giving a pink to strong red color for positive Plk1 staining. Representative cores for both normal and melanoma samples are shown. Large panels are 10X images; inset windows show 90X zoom images. B) Quantitation of Plk1 immunostaining. Cores were blindly and semiquantitatively scored for Plk1 staining intensity as negative (0), weak (1+), moderate (2+), or strong (3+). Tissue types were grouped into either negative or weak staining compared to moderate or strong for statistical analysis. Numbers represent the total number of cores in each scoring intensity group. Numbers in parentheses are percentage of cores within each tissue type (normal or melanoma) in each of the four scoring categories. The groups were compared using a 2-tailed Fisher’s exact test with a p-value of 1.99 × 10⁻⁷ and was therefore considered statistically significant. C) Mean Plk1 score intensity. The mean staining score for each tissue type is shown +/- 99% confidence interval.
Specificity of the Plk1 antibody used was confirmed by both immunohistochemical and immunoblot analyses. We tested the ability of recombinant Plk1 to eliminate positive Plk1 bands of both endogenous and over-expressed Plk1 via immunoblot analysis (Supplementary Figure 1A). Further, all cores showed negative staining when control IgG2b sera was used (Supplementary Figure 1B). Staining of Plk1 was sample specific and not attributable to nonspecific background staining as shown by negative staining of the stroma in both normal and tumor cores (Figure 1 and Supplementary Figure 1C). Finally, positive Plk1 staining was not necessarily a melanocyte specific occurrence as shown by the negative staining of melanin containing cells within normal skin samples (Supplementary Figure 1D).
Plk1 is over-expressed in melanoma cells and is required for their growth
To understand the role of Plk1 in melanoma we determined its expression profile in three melanoma cell lines (primary, vertical growth, non-tumorigenic cell line WM115; primary, vertical growth, tumorigenic cell line A375; and the tumorigenic, metastatic cell line HS294T) compared to primary, normal human epidermal melanocytes (NHEM). Our data demonstrated that compared to the NHEMs, Plk1 mRNA as well as protein is significantly over-expressed in melanoma cells, albeit at different levels in different melanoma cell lines (Figure 2A). Using quantitative real time RT-PCR, we found Plk1 mRNA expressed in melanoma cells at 5- to 20- fold higher versus NHEMs. A similar pattern was observed at the protein level with Plk1 protein showing a 20- to 40- fold increase in melanoma cells compared to the NHEMs.
Figure 2. Plk1 is over-expressed in melanoma cells compared to normal melanocytes and Plk1 inhibition causes a decrease in the viability and growth melanoma cells.
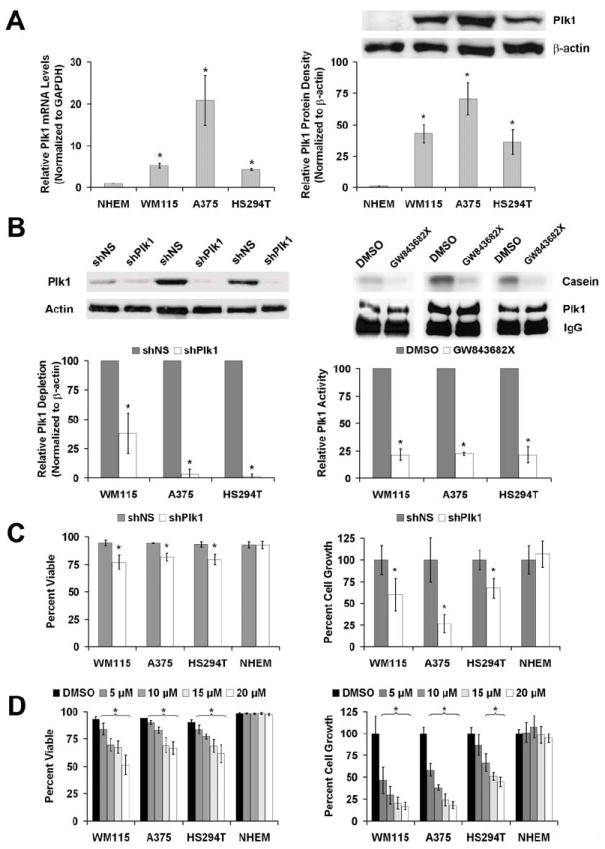
A) Plk1 mRNA and protein levels in melanoma cells versus NHEM. Quantitative real time RT-PCR (left) and Western blot analysis (right) of endogenous Plk1 expression was performed using normal human epidermal melanocytes (NHEM) and three melanoma cell lines WM115, A375 and HS294T. For RT-PCR, Plk1 mRNA levels were quantitated relative to GAPDH mRNA and calculated using the ΔΔCt method. The protein levels were quantitated by a densitometric analysis of protein bands. The data (relative density normalized to β-actin) is expressed as mean ± standard deviation of three experiments (*p<0.01) B) Plk1 inhibition by shRNA and GW843682X. Plk1 protein levels (left) and kinase activity (right) were evaluated following lentiviral transduction via Plk1 shRNA (72 hour) or GW843682X (24 hour) treatments, respectively. Western blot analysis was performed to assess the knockdown of Plk1. Plk1 protein levels were quantitated by a densitometric analysis of protein bands. The data (relative density normalized to β-actin) is expressed as mean ± standard deviation of three experiments (*p<0.01). Kinase activity was measured to assess the inhibition of Plk1 activity. Plk1 was immunoprecipitated from lysates of cells exposed to GW843682X and its ability to phosphorylate casein was evaluated. Phosphorylated casein levels were quantitated and expressed as mean casein phosphorylation relative to the Plk1 protein present in the 10% aliquot of the immunoprecipitation and then normalized to control ± standard deviation of three experiments (*p<0.01). C & D) Effect of Plk1 inhibition on viability and growth of melanoma cells versus NHEM. Following Plk1 shRNA transduction (C) or treatment with GW843682X (D), WM115, A375, HS294T and NHEM cells were counted using Trypan blue analysis (white = viable, blue = non-viable). Cell viability (left panels) was quantitated as percent viable of total cells counted. Cell growth was determined by counting the total number of cells and is quantitated by normalizing each treatment to their respective controls. The data represents mean ± standard deviation of three experiments with similar results (*p<0.01).
Next, we determined the effects of Plk1 inhibition on the viability and growth of melanoma cells. As shown in Figure 2B, genetic knockdown of Plk1 via lentiviral shRNA-mediated RNA interference and chemical activity inhibition (via GW843682X) of Plk1 resulted in a significant decrease in the Plk1 protein levels and kinase activity, respectively (Figure 2B). GW843682X treatments had no effect on Plk1 protein levels (Supplementary Figure 2A). As measured by trypan blue exclusion analysis, knockdown of Plk1 gene caused a significant reduction in viability and growth of all the melanoma cells tested (Figure 2C). However, the shPlk1 transduction did not have any effect on viability or growth of the NHEMs (Figure 2C). While Plk1 knockdown caused a modest (~25%) reduction in viability of all the melanoma cells, we found a more robust reduction in cell growth (~40% in WM115 and HS294T; ~60% in A375). Similarly, chemical inhibition using GW843682X caused a significant dose dependent decrease in the viability and growth of melanoma cells without any effect on the NHEMs (Figure 2D). The lack of a discernible affect on the NHEMs is similar to that seen by Liu et al (Liu et al., 2006) where unless complete abrogation of Plk1 expression is achieved with Plk1 null knockout, normal, non-transformed cells continue to proliferate without any noticeable mitotic abnormalities or changes in proliferative indices. This is not due to a lack of proliferation by the primary NHEMs used in this study as a dividing population of primary cells were used (Supplementary Figure 2B).
We also evaluated the effects of Plk1 inhibition on cell proliferation using MTT assay. As shown in Figure 3A, we found that genetic knockdown as well as chemical inhibition of Plk1 caused a significant decrease in proliferation of all melanoma cell lines tested. Finally, we evaluated the effects of Plk1 inhibition on colony formation ability of melanoma cells. Our data demonstrated that both genetic knockdown as well as chemical inhibition resulted in a drastic reduction in the clonogenic survival of melanoma cells (Figure 3B and Supplementary Figure 2). Plk1 shRNA and the higher concentrations of GW843682X (≥15 μM) resulted in almost a complete abatement (>90% reduction) in colony formation in melanoma cells.
Figure 3. Plk1 inhibition causes a decrease in melanoma cell proliferation and colony formation.
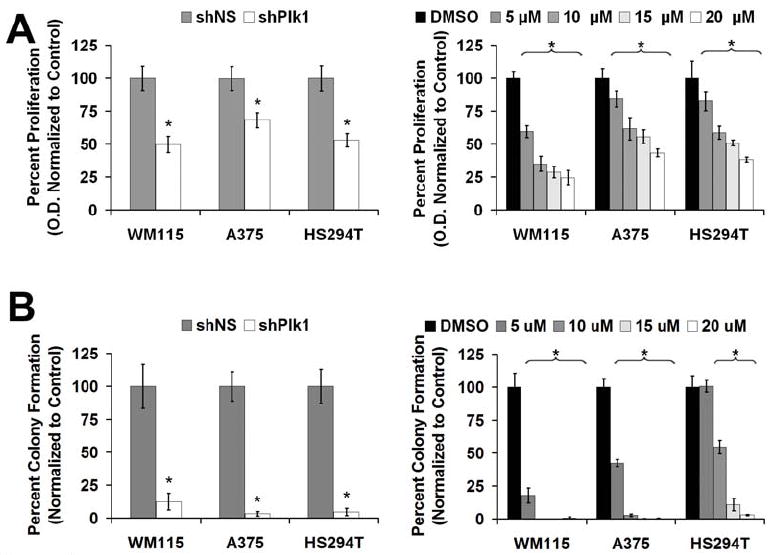
A) Effect of Plk1 inhibition on cell proliferation - MTT analysis. Following lentiviral transduction via Plk1 shRNA (left) or GW843682X treatments (right), MTT analysis was performed, O.D. (540 nm – 690 nm) was determined to assess the effect of Plk1 inhibition on melanoma cell growth. The data is expressed as percent proliferation and normalized to control, mean ± standard deviation of three experiments with similar results (*p<0.001). B) Effect of Plk1 inhibition on colony formation. Following lentiviral transduction via Plk1 shRNA (left), melanoma cells were allowed to grow for 2 weeks with media changes every 3 days with no further selection or treatment. For GW843682X treatment (right), cells were plated at 2.5 × 10³, treated 24 hours later and retreated every 3 days for 2 weeks. Colonies were stained with crystal violet, counted and the data is shown as percent colony formation (normalized to control). The data represents mean ± standard deviation of three experiments with similar results (*p<0.001).
Inhibition of Plk1 causes a G2/M cell cycle arrest consistent with an increase in cyclin B1 in melanoma cells
Next, we conducted experiments to determine whether or not the anti-proliferative effects of Plk1 inhibition in melanoma cells are mediated via cell cycle inhibition. Cell cycle analysis revealed that both genetic and chemical inhibition of Plk1 caused a significant increase of the cell population in G2/M phase of the cell cycle (Figure 4A). Plk1 knockdown caused a significant accumulation of melanoma cells in G2/M phase (25%, 6%, and 9% in non-sense treated versus 43%, 40%, and 51% in WM115, A375 and HS294T shPlk1 treated cells, respectively). Similar results were obtained with GW843682X-mediated inhibition of Plk1; a significant increase of G2/M cells was observed in all three melanoma cells at the lowest concentration of GW843682X (5 μM, 10 μM in WM115) after 24 hours, showing a maximum response at 20 μM concentration of GW843682X. Interestingly, the cells accumulated in G2/M phase were found to be a result of a shift of cell population from G1 phase.
Figure 4. Plk1 inhibition causes a G2/M cell cycle arrest, increase in cyclin B1 and multiple mitotic errors in melanoma cells.
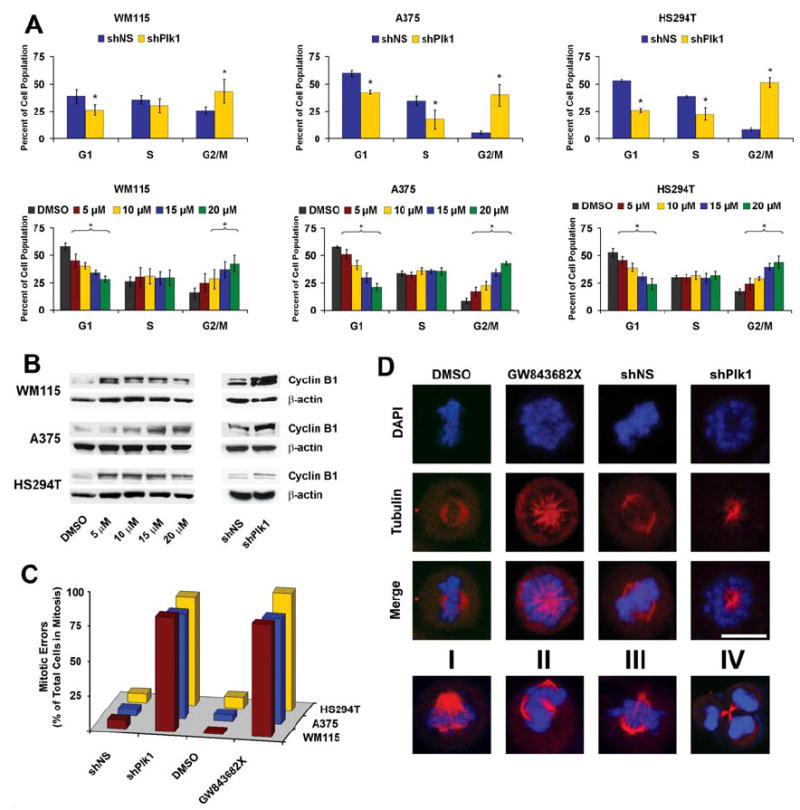
A) Effect of Plk1 inhibition on cell cycle distribution. Following lentiviral transduction via Plk1 shRNA (top) or GW843682X treatments (bottom), cells were collected and fixed for cell cycle distribution analysis using FACS. The quantitation of cell cycle distribution was performed using ModFit LT software (Verity Software House; Topsham, ME). The data represents mean ± standard deviation of three experiments (*p<0.01). B) Effect of Plk1 inhibition on cyclin B1. Following lentiviral transduction or GW843682X treatment, cell lysates were collected and evaluated for cyclin B1 protein levels by Western blot analysis; β-actin was used as a loading control. C & D) Effect of Plk1 inhibition on mitotic errors – Immunofluorescence. Following lentiviral transduction via Plk1 shRNA or GW843682X treatments, A375 cells were fixed, stained for α-tubulin (Red), and DNA counterstained with DAPI (Blue). One hundred mitotic cells per treatment were counted as normal or with mitotic errors. Mitotic errors were quantitated and expressed as total mitotic errors as a percentage of total mitotic cells counted and displayed in C. The various errors are shown in D. These errors include polo or monopolar cells (shown in upper panel), improper tubulin size (I), multi-polar (II), improper tubulin alignment (III), and improper cytokinesis (IV); representative examples are shown here.
Since i) cyclin B1 shows a similar cell cycle pattern to Plk1, rising in S-phase and peaking at the G2/M transition (Soni et al., 2008), ii) is an established downstream target of Plk1 at the G2/M transition, and iii) an observed increase of cyclin B1 protein is used as a marker of increased mitotic cells (Liu and Erikson, 2002; McNeely et al., 2008; Soni et al., 2008), we next assessed the effect of Plk1 inhibition on cyclin B1 protein levels via immunoblot analysis. We found that Plk1 inhibition (genetic as well as chemical) resulted in an increase of cyclin B1 protein levels, reinforcing the G2/M cell cycle arrest (Figure 4B).
Inhibition of Plk1 causes mitotic abnormalities in melanoma cells
Since Plk1 has been shown to control several critical processes during mitosis, we next assessed the effect of Plk1 inhibition, via Plk1 shRNA or GW843682X (10 μM), on mitotic errors in melanoma cells. Using immunofluorescence to visualize α-tubulin and DNA, we carefully checked the cells for any errors in spindle pole formation and DNA condensation and separation following Plk1 inhibition. Our data (Figure 4C) demonstrated that inhibition of Plk1 resulted in a drastic increase in total number of mitotic errors (~3% in controls versus ~90% in cells treated with Plk1 shRNA or 10 μM GW843682X). The most common phenotype seen in mitotic cells following Plk1 inhibition was the “polo” phenotype (Figure 4D, A375 cells shown in top three rows; representative images of WM115 and HS294T shown in Supplementary Figure 4). Earlier studies have reported similar phenotypes (Lenart et al., 2007; Llamazares et al., 1991; Peters et al., 2006; Sumara et al., 2004). As shown in the bottom row of Figure 4D, the other types of mitotic errors observed were unbalanced tubulin size (I), multipolar formation (II), improper tubulin alignment (III), and incorrect cytokinesis (IV). This high percentage of cells arrested with irreparable mitotic errors might contribute to the significant decrease in cell growth seen with Plk1 inhibition.
Inhibition of Plk1 results in an increase in apoptosis
Since Plk1 inhibition could result in an apoptotic elimination of cells (Bu et al., 2008; Fink et al., 2007; Lansing et al., 2007; Steegmaier et al., 2007), we next evaluated the effects of Plk1 inhibition on apoptosis induction in melanoma cells. As shown by a flow cytometric evaluation of Annexin V staining, we found that Plk1 inhibition via shRNA-mediated knockdown or by GW843682X resulted in a significant increase in apoptosis in melanoma cells (Figure 5A). The effect of Plk1 inhibition on apoptosis was also confirmed using Western blot analysis for cleaved PARP. Our data demonstrated that Plk1 inhibition resulted in a significant increase in PARP cleavage in melanoma cells, further supporting the increase in apoptosis seen with Annexin V and PI staining (Figure 5B).
Figure 5. Plk1 inhibition causes apoptosis of melanoma cells.
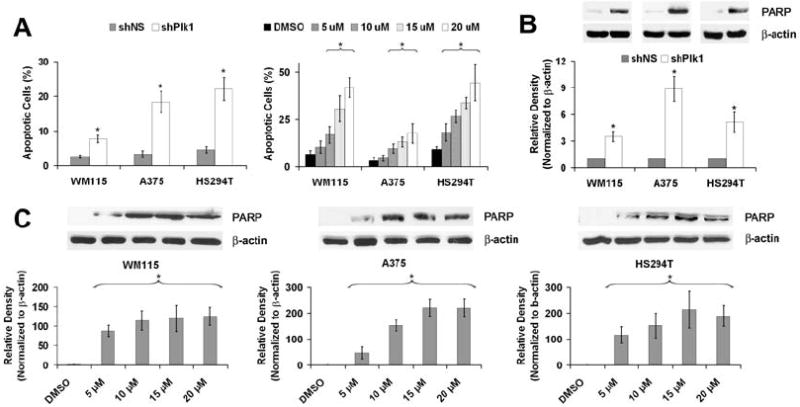
A) Effect of Plk1 inhibition on Annexin V binding. Following lentiviral transduction via Plk1 shRNA or GW843682X treatments, cells were collected and stained with Annexin V antibody and PI and analyzed using FACS analysis. Cells were gated and counted as viable (Annexin negative/PI negative), early apoptotic (Annexin positive/PI negative), late apoptotic (Annexin positive/PI positive), or necrotic (Annexin negative/PI positive). Graphs represent percent of apoptotic cells (Early + Late) of total cell population. The data represents mean ± standard deviation of three experiments with similar results (*p<0.01). B and C) Effect of Plk1 inhibition on cleavage of PARP. Following lentiviral transduction via Plk1 shRNA or GW843682X treatments, cell lysates were prepared and Western blot analysis was used to evaluate PARP cleavage using an antibody that detects cleaved PARP. Cleaved PARP levels were quantitated by a densitometric analysis of protein bands. The data (relative density normalized to β-actin) is expressed as mean ± standard deviation of three experiments (*p<0.001).
Discussion
Plk1 expression has been correlated to poor prognosis in melanoma samples. Two previous studies have demonstrated increased Plk1 expression in clinical melanoma samples. The first study by Strebhardt and colleagues found a significant increase in Plk1 expression in a large variety of melanoma samples which also correlated to tumor thickness (Strebhardt et al., 2000). They also found a decrease in 10 year survival in patients with higher Plk1 expression (Strebhardt et al., 2000). In the second study, the authors correlated increased Plk1 expression in thin melanomas with an increased risk of metastasis within 5 years (Kneisel et al., 2002). Our tissue microarray analysis demonstrated that indeed Plk1 is markedly over-expressed in melanoma tissue versus normal skin. However, we did not attempt to correlate Plk1 expression to tumor grade or disease outcome due to minimal information available for a commercially available tissue microarray. Finally, we acknowledge that co-staining for Plk1 and a melanocyte specific marker like Mart-1 or Mitf would be the optimal control for normal skin tissue; however, we show that Plk1 does not show necessarily a melanocyte specific staining pattern (Supplementary Figure 1). Further, the normal cores demonstrating positive Plk1 staining were mostly undetectable to low and, based on visual inspection, the majority of positive staining within the positive cores was within the keratinocytes.
Plk1, a key regulator of cell division in eukaryotic cells, has been shown to play critical roles in ensuring a smooth and error-free progression through mitosis. Plk1 has also been shown to play an important role in maintaining genomic stability during DNA replication and the DNA damage checkpoint. Plk1 functions have been shown to extend past the ‘core’ cell cycle and it is being appreciated that the term ‘mitotic kinase’ might not do justice to Plk1 (Takaki et al., 2008). Over-expression of human Plk1 has been found in a variety of cancers; however, the role of Plk1 in melanoma and its functional significance is not well understood. Here, we have demonstrated that compared to NHEM, Plk1 was significantly over-expressed in all three melanoma cell lines. Further, our data have also demonstrated that a genetic knockdown of Plk1 or its chemical inhibition of kinase activity via a small molecule inhibitor resulted in a significant reduction in viability, growth and clonogenic survival of melanoma cells. Interestingly, the NHEM cells were not affected by Plk1 inhibition. This is in line with the findings by Liu et al demonstrating a requirement for complete Plk1-null knockdown or concomitant Plk1 and p53 inhibition for a reduction in cell proliferation of non-transformed hTERT-RPE1 and MCF10A cells (Liu et al., 2006). This indicates that normal cells require less Plk1 activity for proper cell cycle progression and reinforces the idea of “oncogene addiction” in cancer cells.
In our experimental strategy, we used GW843682X which is a small molecule inhibitor of Plk1 (Lansing et al., 2007). In addition, we also employed Plk1 shRNA mediated RNA interference approach (to knockdown Plk1 gene expression) to address any concern regarding the specificity of GW843682X. Several published studies have used similar Plk1 inhibitory approaches both in vitro as well as in vivo (Kawata et al., 2008; Mross et al., 2008; Perez, I et al., 2008; Strebhardt and Ullrich, 2006; Yu et al., 2008). The reduction in viability and growth of melanoma cells was accompanied with a strong and persistent G2/M phase cell cycle arrest. We also observed an increase in cyclin B1 protein levels, a down-stream target of Plk1 and a marker for mitosis, in melanoma cells after both chemical and genetic inhibition of Plk1, reinforcing the mitotic arrest. Further, Plk1 inhibition resulted in “mitotic catastrophe” with several types of mitotic errors with the majority of them displaying the “polo” phenotype. Without functional Plk1, cells do not properly assemble a bipolar spindle apparatus and instead arrange the chromosomes in a circular pattern around a monopolar spindle. However, bipolar spindle formation is not the only role Plk1 plays through mitosis. We also found a significant increase in the number of cells with errors in cytokinesis which may be attributed to some of Plk1’s other roles, such as its direct and indirect regulation of the anaphase promoting complex (APC/C) and the APC/C inhibitor Emi1, Plk1’s role in cohesin dissociation from the chromosome arms, or Plk1’s regulation of Ect2 and Rho GTPase for proper cytokinesis (Burkard et al., 2007; Schmit and Ahmad, 2007). Overall, these mitotic phenotypes by Plk1 inhibition explain the strong mitotic arrest followed by the observed apoptotic elimination of melanoma cells.
We observed different extents of response in different melanoma cell lines via Plk1 inhibition. Some of the differences, like those seen with cell cycle arrest and apoptosis may be attributable to cell line differences. WM115 possess non-invasive properties therefore is considered a less aggressive cancer cell line, whereas A375 is a more proliferative, aggressive and invasive tumor cell line. This is of particular interest because A375 cells express Plk1 at a higher level than WM115 cells contributing to the idea that Plk1 expression could be a good marker for poor prognosis. It is also important to note here, the cell line most sensitive to Plk1 knockdown (A375) with regards to overall cell growth was the cell line that expressed Plk1 at the highest level. This is an interesting observation in line with the idea that tumor cells may form an “oncogene addiction” to various proteins or pathways for continued survival (Weinstein, 2002). Though they may not have been the cause of tumor formation, the tumor cells’ increased growth lends itself to increased expression of various pathways to continue proliferating. Therefore, even though the pathway’s continual activity or presence may not have been essential in a non-transformed cell, even the slightest inhibition causes a massive reduction in growth, even if the post-treatment activity or expression is higher than normal baseline.
In conclusion, our findings indicate that Plk1 is over-expressed in both clinical melanoma samples and melanoma cell lines. Further, we demonstrated that targeting Plk1, both by genetic means as well as via a small molecule activity inhibitor, imparts strong anti-proliferative effects, especially “mitotic catastrophe” followed by apoptotic elimination of melanoma cells. This study suggests that Plk1 may have a functional relevance towards melanoma development and/or progression. We suggest that targeting of Plk1 for melanoma therapy may be a viable approach for the management of melanoma. However, further mechanism-based studies in appropriate in vivo models are needed to validate our findings.
Materials and Methods
Immunohistochemistry
Paraffin embedded human melanoma and normal skin tissue arrays were obtained from Biomax USA (Rockville, MD). The tissue arrays were deparaffinized with xylenes and ethanol series and antigen retrieval performed by heating in 1 mM EDTA (pH 8.0) at 85°C. Slides were blocked in 10% normal goat serum (Caltag, CA) in PBS for 1 hour at room temperature followed by incubation with Plk1 antibody (Upstate, MA) or IgG2b control anti-sera (Upstate, MA) diluted 1:100 in 10% normal goat serum in PBS overnight at 4°C in a humidified chamber. The following day, slides were incubated with biotin conjugated secondary antibody (Invitrogen, CA) (1:100 in blocking buffer) and then fresh ABC-Alkyline Phosphatase reagent (Vector Labs, CA) for 1 hour each at room temperature in a humidified chamber. Tissues were then washed with PBS then exposed to fresh Vector Red reagent (Vector Labs, CA) for 20 minutes. Tissues were then counterstained with hematoxylin, dehydrated with ethanol and xylenes and mounted. Cores were scored blindly for staining intensity as negative (0), weak (1+), moderate (2+), or strong (3+) staining using Olympus BX41 bright field microscope and images were obtained with a digital camera (model 14.2 color Mosaic, Diagnostic Instruments, Inc., MI) and Spot software (Windows: Version 4, Diagnostic Instruments, Inc., MI).
Cell culture
Human melanoma cell lines WM115, A375 and HS294T (ATCC; Manassas, VA) were maintained in Eagle’s Minimum Essential Medium (ATCC, VA) or Dulbecco’s Modified Eagle’s Medium (Invitrogen, CA) with 10% FBS and 1% penicillin/streptomycin at standard cell culture conditions (37°C, 5% CO2 in humidified incubator). Normal human melanocytes were isolated from neonatal foreskin and cultured as described previously (Fang et al., 2001).
Immunoblot analysis
Following treatments, cells were trypsinized, washed with ice-cold PBS and lysed with RIPA buffer (50mM Tris, 150mM NaCl, 1% NP-40, 0.5% deoxycholic acid, 0.1% SDS) with phenylmethylsulphonyl fluoride (PMSF) and protease inhibitor cocktail (Pierce, IL). Protein concentration was measured with BCA Protein Assay (Pierce, IL). For immunoblot analysis, 30 μg of protein was subjected to sodium dodecyl sulfate polyacrylamide gel electrophoresis (SDS-PAGE) using 10% Tris-HCl gels and transferred onto nitrocellulose membrane. Blots were blocked with 5% nonfat dry milk followed by probing with the desired primary antibodies (Plk1, Upstate, MA; cleaved PARP or cyclin B1, Cell Signaling, MA), and then appropriate HRP-conjugated secondary antibodies followed by enhanced chemiluminescent detection. For Plk1 antibody specificity immunoblots (Supplementary Figure 1), Plk1 primary antibody was pre-incubated with recombinant Plk1 enzyme (Invitrogen, CA) prior exposure to the blots. Blots were subsequently stripped and re-probed with goat anti-β-actin (Santa Cruz, CA) primary antibody followed by appropriate secondary and chemiluminescent detection as a loading control. The quantification of protein was performed by a digital analyses of protein bands (TIFF images) using UN-SCAN-IT software (Silk Scientific, Inc., UT).
Quantitative real time RT-PCR
RNA was isolated with Trizol reagent (Invitrogen, CA), treated with DNAse (Promega, WI), and first strand cDNA created with M-MLV reverse transcriptase (Promega, WI) according to vendor’s protocol. Quantitative real time RT-PCR was performed in triplicate in 20 μl reactions with SYBR® Premix Ex Taq ™ Perfect Real Time (Takara, WI) with 50 ng first strand cDNA and 0.2 μg each Plk1 forward (5’-CCCCTCACAGTCCTCAATAA-3’) and reverse (5’-AATAGTCCACCCACTTGCTG-3’) primers or 0.2 μg each GAPDH forward (5’-GGGTGTGAACCATGAGAAGT-3’) and reverse (5’-GTAGAGGCAGGGATGATGTT-3’) primers. Samples were cycled once at 95°C for 2 minutes, then 40 cycles of 95°C, 58°C, and 72°C for 30 seconds each. Relative Plk1 mRNA was calculated using the ΔΔCT method with GAPDH as an endogenous control.
GW843682X treatment
GW843682X (5-(5,6-dimethoxy-1H-benzimidazol-1-yl)-3-([2-(trifluoromethyl)-benzyl]oxy) thiophene-2-carboxamide) is a reversible and specific ATP competitive Plk1 inhibitor, designed by GlaxoSmithKline (Lansing et al., 2007). GW843682X was obtained from Sigma Aldrich, dissolved in dimethyl sulfoxide (DMSO) and diluted further in cell medium to create a working stock. The highest volume of DMSO (in cell media) was used as control. Cells were plated at densities of 5.0 × 10⁴, 7.5 × 10⁴ or 5.0 × 10⁵ in 12-well, 6-well or 10 cm formats, respectively. Twenty-four hours after passaging, cells were exposed to increasing doses of GW843682X of 5, 10, 15 and 20 μM or DMSO control. Twenty-four or 72 hours after treatment, cells were trypsinized and collected for further analyses.
Immunoprecipitation and kinase activity assay
Following treatment with GW843682X, the cells were trypsinized, washed with ice-cold PBS, lysed with a non-denaturing lysis buffer (150 mM NaCl; 1.0 % NP-40; 0.1 % SDS; 50 mM Tris, pH 8.0; 5 mM EDTA; 5 mM NaF) plus PMSF and protease inhibitor cocktail (Pierce, IL) and cleared by centrifugation. Lysate (500 μg) was mixed with 5 μg Plk1 antibody (Upstate, MA) overnight at 4°C with rotation. The next day, 50 μl UltraLink Immobilized Protein A beads (Pierce, IL) were added to the antigen-antibody complex and incubated for two hours at room temperature with rotation. Beads were recovered by low-speed centrifugation and washed six times with immunoprecipitation buffer (20mM sodium phosphate (pH=7.5), 500mM NaCl, 0.1% SDS, 1% NP-40, 0.02% sodium azide) followed by one wash with Kinase Buffer (Cell Signaling, MA). The final pellet was re-suspended in 50 μl Kinase Buffer with 50 μM cold ATP, 10 μg dephosphorylated casein (Sigma Aldrich, MO) and 5 μCi [γ-32P] ATP (PerkinElmer, MA) and incubated at 30°C for 30 minutes. To inactivate the reaction, loading dye was added to each sample and the mixture was incubated at 95°C for 5 minutes, centrifuged and subjected to SDS-PAGE. After appropriate separation, gels were dried and analyzed by autoradiography.
Lentiviral production and transduction
For viral creation, HEK 293T cells were passaged to be 30-40% confluent the following day. Cells were transfected using the CaPO4 method. Briefly, 8 μg shRNA plasmid DNA (nonsense shRNA or Plk1 targeting shRNA) (Sigma Aldrich, MO), 5 μg VSV-G and 6 μg Δ8.2 plasmids were mixed with sterile ddH2O to a final volume of 450 μl and mixed with 50 μl of 2.5 M CaCl2. The DNA mix was bubbled and 500 μl 2X HBS (pH 7.05) added drop wise. The transfection mixture was added to its respective plates and incubated overnight. After 24 hours, transfection media was removed and fresh media added. After an additional 24 hours and 48 hours cell media containing shRNA lentivirus was collected and filtered for use.
For target cell transduction, melanoma cells were passaged to 40% confluency the following day. The viral media was added to cells with 8 μg/ml polybrene four times over two days. After 72 hours of transduction, viral media was removed and cells were collected for further experiments. Due to the phenotypes caused by shPlk1 infection and rapid decrease in cell number, selection for transfected cells was not possible, however the efficacy of each batch of Plk1 shRNA particles was routinely checked via immunoblot analysis for Plk1 expression prior to further experiments.
Trypan blue exclusion assay
Seventy-two hours post GW843682X treatment or shRNA transduction, cells were trypsinized and collected in a 1.5 ml tube, pelleted by centrifugation and re-suspended in 120 μl PBS. A 10 μl aliquot of cell suspension was removed and an equivalent 10 μl of Trypan Blue was added to the cells. Cells were then counted for viability (viable = unstained, non-viable = stained) and total cell growth.
MTT assay
For MTT assay, 2 × 10³ cells were plated in 96-well plate. Twenty-four hours post plating, cells were treated with GW843682X or shRNA as previously. Seventy-two hours post treatment, 4μl of MTT (3-[4, 5-dimethylthiazol-2-yl]-2,5-diphenyl tetrazoliumbromide) reagent (5 mg/ml in cell media) was added to each well and incubated for 2 hours. MTT reagent was removed by aspiration and replaced with formazan crystals dissolved in DMSO. Absorbance was read at 540 - 690 nm. Data represented as percent reduction in metabolic activity, normalized to DMSO or nonsense shRNA control.
Colony formation
Cells were plated at a density of 3.0 × 10³ in 6-well plates. Twenty-four hours later cells were treated with GW843682X or shRNA as described above. GW843682X treated cells were subsequently retreated every three days for two weeks. Cells treated with shRNA had media removed and replaced with normal cell media every three days with no further selection or treatment. Cells were then stained after the two week treatment regimen with 0.1% crystal violet diluted in water and methanol (2:2:1 ratio), washed with PBS and air-dried. The number of colonies per well were counted and the pictures were captured with a digital camera.
Cell cycle analysis
Following treatments, cells were trypsinized, washed with PBS and fixed in ice cold 100% ethanol. Cells were then washed with PBS and stained with propidium iodide (Invitrogen, CA) and analyzed on a FACScan benchtop cytometer at the University of Wisconsin Paul P. Carbone Comprehensive Cancer Center (UWCCC) Flow cytometry facility. Cell cycle distribution was analyzed using CellQuest software (BD Biosciences, CA).
Immunofluorescence studies
For immunofluorescence staining, the cells were plated and grown on BD Falcon CultureSlides (BD Biosciences, CA) and treated with shPlk1 or GW843682X (10 μM) as previously described. The cells were fixed with 100% methanol and permeabalized with 0.5% Triton-X 100 in PBS and then blocked for 1 hour at room temperature in 10% normal goat serum in PBS. Following blocking, biotin conjugated mouse anti-α-tubulin (Molecular Probes, CA) (1:100 in blocking buffer) was added and allowed to incubate for 2 hours at room temperature. Primary antibody was removed and streptavidin Alexa Fluor 568 (Molecular Probes, OR) (1:200 in blocking buffer) was added and incubated for 1 hour at room temperature in the dark. 4’, 6-diamidino-2-phenylindole, dihydrochloride (DAPI) (Pierce, IL) (1 μg/ml) counterstain was used for nuclear staining. Cells were mounted with ProLong anti-fade kit as per vendor’s protocol (Molecular Probes, OR) and examined under Bio-Rad Radiance 2100 MP Rainbow Confocal/Multiphoton System. For mitotic error quantitation, at least 100 mitotic cells were scored as either undergoing normal mitosis or possessing one of multiple errors, including: monopolar, multipolar, improper tubulin size or attachment, improper DNA condensation or separation, or errors in cytokinesis.
Annexin V analysis
Following treatments, cells were trypsinized, collected and washed in Dulbecco’s phosphate buffered saline (DPBS). Cells were then resuspended in 100μl binding buffer (0.1M Hepes, pH 7.4; 1.4 M NaCl; 25 mM CaCl2) with Annexin V antibody and propidium iodide (BD Biosciences, CA) as per vendor’s suggestions. The cells were then analyzed on a FACScan benchtop cytometer at the UWCCC Flow cytometry facility and further analysis was performed with CellQuest software (BD Biosciences, CA).
Statistics
All results, unless otherwise noted, are expressed as the mean plus or minus standard deviation. Statistical analyses were performed by two-tailed Student’s T-Test. Data for immunohistochemical analysis was compared using a two-tailed Fisher’s exact test. For all analysis, a P-value < 0.01 was considered statistically significant unless otherwise noted.
Supplementary Material
Supplementary Figure 1. Plk1 antibody is specific to human Plk1. A) Mouse anti-Plk1 detects HA-tagged human Plk1, endogenous Plk1 and is blocked by recombinant Plk1. Immunoblot analysis of expressed HA-tagged Plk1 in 293T cells and endogenous Plk1 in melanoma cell lines (WM115, A375 and HS294T) was done. Positive Plk1 bands are shown on left and a parallel blot exposed to equal amount of Plk1 antibody preincubated with recombinant Plk1 showing negative staining on right. Equal loading was confirmed with β-actin. B) Tissue cores show negative staining with IgG control primary antibody. The tissue micro-array was stained with primary IgG2b control anti-sera and respective secondary antibody as described previously. This was done simultaneously with Plk1 staining shown in Fig.1 to equalize exposure and color development times. Representative cores for melanoma samples are shown demonstrating negative staining with control anti-sera. C) Tissue stroma stains negative for Plk1. Additional selected cores of melanoma samples containing tissue stroma are shown to demonstrate that positive Plk1 staining is tumor specific. D) Positive Plk1 staining is not melanin specific. Representative images of normal skin tissue containing higher levels of melanin containing cells are shown demonstrating negative staining for Plk1.
Supplementary Figure 2. A) Treatment of melanoma cells with GW843682X does not alter Plk1 protein levels. Following treatment with GW843682X, the cells were collected and Plk1 levels were determined by Western blot analysis and β-actin was used as a loading control. B) Primary NHEM cells used represent a proliferating population. After Plk1 inhibition treatments and analysis for proliferation using Trypan blue exclusion analysis, the cell number at conclusion (72 hours) was calculated for the controls of each cell line used (NHEM, WM115, A375 and HS294T). The data demonstrates that each cell line tested was proliferating and thus susceptible to Plk1 inhibition, albeit at differing rates.
Supplementary Figure 3: Plk1 inhibition decreases the long term colony formation ability of melanoma cells. Following lentiviral transduction via Plk1 shRNA, melanoma cells were replated at a density of 2.5 × 10³ and allowed to grow for 2 weeks with media changes every 3 days. For GW843682X treatment, cells were plated at 2.5 × 10³, treated 24 hours later and retreated every 3 days for 2 weeks. Colonies were stained with crystal violet, counted and images were captured using a digital camera. Representative pictures of each melanoma cell line are shown.
Supplementary Figure 4: Plk1 inhibition results in a high percentage of melanoma cells with the “polo” phenotype. After shPlk1 and GW843682X treatments, WM115 and HS294T cells were fixed, stained for α-tubulin (Red), and DNA counterstained with DAPI (Blue). Pictures were capture using Bio-Rad Radiance 2100 MP Rainbow Confocal/Multiphoton System. Representative pictures from multiple run are shown here.
Acknowledgments
This work was partially supported (Pre-doctoral Traineeship to Travis Schmit) by the Molecular and Environmental Toxicology Center Training Grant (T32ES007015) from the NIEHS, NIH. Its contents are solely the responsibility of the authors and do not necessarily represent the official views of the NIEHS, NIH.
References
- Ando K, Ozaki T, Yamamoto H, Furuya K, Hosoda M, Hayashi S, et al. Polo-like kinase 1 (Plk1) inhibits p53 function by physical interaction and phosphorylation. J Biol Chem. 2004;279:25549–25561. doi: 10.1074/jbc.M314182200. [DOI] [PubMed] [Google Scholar]
- Bu Y, Yang Z, Li Q, Song F. Silencing of polo-like kinase (Plk) 1 via siRNA causes inhibition of growth and induction of apoptosis in human esophageal cancer cells. Oncology. 2008;74:198–206. doi: 10.1159/000151367. [DOI] [PubMed] [Google Scholar]
- Burkard ME, Randall CL, Larochelle S, Zhang C, Shokat KM, Fisher RP, et al. Chemical genetics reveals the requirement for Polo-like kinase 1 activity in positioning RhoA and triggering cytokinesis in human cells. Proc Natl Acad Sci U S A. 2007;104:4383–4388. doi: 10.1073/pnas.0701140104. [DOI] [PMC free article] [PubMed] [Google Scholar]
- Descombes P, Nigg EA. The polo-like kinase Plx1 is required for M phase exit and destruction of mitotic regulators in Xenopus egg extracts. EMBO J. 1998;17:1328–1335. doi: 10.1093/emboj/17.5.1328. [DOI] [PMC free article] [PubMed] [Google Scholar]
- Eckerdt F, Strebhardt K. Polo-like kinase 1: target and regulator of anaphase-promoting complex/cyclosome-dependent proteolysis. Cancer Res. 2006;66:6895–6898. doi: 10.1158/0008-5472.CAN-06-0358. [DOI] [PubMed] [Google Scholar]
- Eckerdt F, Yuan J, Strebhardt K. Polo-like kinases and oncogenesis. Oncogene. 2005;24:267–276. doi: 10.1038/sj.onc.1208273. [DOI] [PubMed] [Google Scholar]
- Fang D, Kute T, Setaluri V. Regulation of tyrosinase-related protein-2 (TYRP2) in human melanocytes: relationship to growth and morphology. Pigment Cell Res. 2001;14:132–139. doi: 10.1034/j.1600-0749.2001.140209.x. [DOI] [PubMed] [Google Scholar]
- Fink J, Sanders K, Rippl A, Finkernagel S, Beckers TL, Schmidt M. Cell type-- dependent effects of Polo-like kinase 1 inhibition compared with targeted polo box interference in cancer cell lines. Mol Cancer Ther. 2007;6:3189–3197. doi: 10.1158/1535-7163.MCT-07-0048. [DOI] [PubMed] [Google Scholar]
- Hocker TL, Singh MK, Tsao H. Melanoma genetics and therapeutic approaches in the 21st century: moving from the benchside to the bedside. J Invest Dermatol. 2008;128:2575–2595. doi: 10.1038/jid.2008.226. [DOI] [PubMed] [Google Scholar]
- Ito Y, Miyoshi E, Sasaki N, Kakudo K, Yoshida H, Tomoda C, et al. Polo-like kinase 1 overexpression is an early event in the progression of papillary carcinoma. Br J Cancer. 2004;90:414–418. doi: 10.1038/sj.bjc.6601540. [DOI] [PMC free article] [PubMed] [Google Scholar]
- Jemal A, Siegel R, Ward E, Hao Y, Xu J, Murray T, et al. Cancer statistics, 2008. CA Cancer J Clin. 2008;58:71–96. doi: 10.3322/CA.2007.0010. [DOI] [PubMed] [Google Scholar]
- Kawata E, Ashihara E, Kimura S, Takenaka K, Sato K, Tanaka R, et al. Administration of PLK-1 small interfering RNA with atelocollagen prevents the growth of liver metastases of lung cancer. Mol Cancer Ther. 2008;7:2904–2912. doi: 10.1158/1535-7163.MCT-08-0473. [DOI] [PubMed] [Google Scholar]
- Kneisel L, Strebhardt K, Bernd A, Wolter M, Binder A, Kaufmann R. Expression of polo-like kinase (PLK1) in thin melanomas: a novel marker of metastatic disease. J Cutan Pathol. 2002;29:354–358. doi: 10.1034/j.1600-0560.2002.290605.x. [DOI] [PubMed] [Google Scholar]
- Lane HA, Nigg EA. Antibody microinjection reveals an essential role for human polo-like kinase 1 (Plk1) in the functional maturation of mitotic centrosomes. J Cell Biol. 1996;135:1701–1713. doi: 10.1083/jcb.135.6.1701. [DOI] [PMC free article] [PubMed] [Google Scholar]
- Lansing TJ, McConnell RT, Duckett DR, Spehar GM, Knick VB, Hassler DF, et al. In vitro biological activity of a novel small-molecule inhibitor of polo-like kinase 1. Mol Cancer Ther. 2007;6:450–459. doi: 10.1158/1535-7163.MCT-06-0543. [DOI] [PubMed] [Google Scholar]
- Lee KS, Yuan YL, Kuriyama R, Erikson RL. Plk is an M-phase-specific protein kinase and interacts with a kinesin-like protein, CHO1/MKLP-1. Mol Cell Biol. 1995;15:7143–7151. doi: 10.1128/mcb.15.12.7143. [DOI] [PMC free article] [PubMed] [Google Scholar]
- Lenart P, Petronczki M, Steegmaier M, Di FB, Lipp JJ, Hoffmann M, et al. The small-molecule inhibitor BI 2536 reveals novel insights into mitotic roles of polo-like kinase 1. Curr Biol. 2007;20(17):304–315. doi: 10.1016/j.cub.2006.12.046. [DOI] [PubMed] [Google Scholar]
- Liu X, Erikson RL. Activation of Cdc2/cyclin B and inhibition of centrosome amplification in cells depleted of Plk1 by siRNA. Proc Natl Acad Sci U S A. 2002;99:8672–8676. doi: 10.1073/pnas.132269599. [DOI] [PMC free article] [PubMed] [Google Scholar]
- Liu X, Lei M, Erikson RL. Normal cells, but not cancer cells, survive severe Plk1 depletion. Mol Cell Biol. 2006;26:2093–2108. doi: 10.1128/MCB.26.6.2093-2108.2006. [DOI] [PMC free article] [PubMed] [Google Scholar]
- Llamazares S, Moreira A, Tavares A, Girdham C, Spruce BA, Gonzalez C, et al. polo encodes a protein kinase homolog required for mitosis in Drosophila. Genes Dev. 1991;5:2153–2165. doi: 10.1101/gad.5.12a.2153. [DOI] [PubMed] [Google Scholar]
- McNeely SC, Taylor BF, States JC. Mitotic arrest-associated apoptosis induced by sodium arsenite in A375 melanoma cells is BUBR1-dependent. Toxicol Appl Pharmacol. 2008;231:61–67. doi: 10.1016/j.taap.2008.03.020. [DOI] [PMC free article] [PubMed] [Google Scholar]
- Mito K, Kashima K, Kikuchi H, Daa T, Nakayama I, Yokoyama S. Expression of Polo-Like Kinase (PLK1) in non-Hodgkin’s lymphomas. Leuk Lymphoma. 2005;46:225–231. doi: 10.1080/10428190400015709. [DOI] [PubMed] [Google Scholar]
- Mross K, Frost A, Steinbild S, Hedbom S, Rentschler J, Kaiser R, et al. Phase I Dose Escalation and Pharmacokinetic Study of BI 2536, a Novel Polo-Like Kinase 1 Inhibitor, in Patients With Advanced Solid Tumors. J Clin Oncol. 2008;26:5511–5517. doi: 10.1200/JCO.2008.16.1547. [DOI] [PubMed] [Google Scholar]
- Ohkura H, Hagan IM, Glover DM. The conserved Schizosaccharomyces pombe kinase plo1, required to form a bipolar spindle, the actin ring, and septum, can drive septum formation in G1 and G2 cells. Genes Dev. 1995;9:1059–1073. doi: 10.1101/gad.9.9.1059. [DOI] [PubMed] [Google Scholar]
- Perez dC I, de CG, Montoya G, Malumbres M. Emerging cancer therapeutic opportunities by inhibiting mitotic kinases. Curr Opin Pharmacol. 2008;8:375–383. doi: 10.1016/j.coph.2008.06.013. [DOI] [PubMed] [Google Scholar]
- Peters U, Cherian J, Kim JH, Kwok BH, Kapoor TM. Probing cell-division phenotype space and Polo-like kinase function using small molecules. Nat Chem Biol. 2006;2:618–626. doi: 10.1038/nchembio826. [DOI] [PubMed] [Google Scholar]
- Purdue MP, Freeman LE, Anderson WF, Tucker MA. Recent Trends in Incidence of Cutaneous Melanoma among US Caucasian Young Adults. J Invest Dermatol. 2008;128:2905–2908. doi: 10.1038/jid.2008.159. [DOI] [PMC free article] [PubMed] [Google Scholar]
- Rajagopalan H, Lengauer C. Aneuploidy and cancer. Nature. 2004;432:338–341. doi: 10.1038/nature03099. [DOI] [PubMed] [Google Scholar]
- Reagan-Shaw S, Ahmad N. Silencing of polo-like kinase (Plk) 1 via siRNA causes induction of apoptosis and impairment of mitosis machinery in human prostate cancer cells: implications for the treatment of prostate cancer. FASEB J. 2005;19:611–613. doi: 10.1096/fj.04-2910fje. [DOI] [PubMed] [Google Scholar]
- Roshak AK, Capper EA, Imburgia C, Fornwald J, Scott G, Marshall LA. The human polo-like kinase, PLK, regulates cdc2/cyclin B through phosphorylation and activation of the cdc25C phosphatase. Cell Signal. 2000;12:405–411. doi: 10.1016/s0898-6568(00)00080-2. [DOI] [PubMed] [Google Scholar]
- Santamaria A, Neef R, Eberspacher U, Eis K, Husemann M, Mumberg D, et al. Use of the novel Plk1 inhibitor ZK-thiazolidinone to elucidate functions of Plk1 in early and late stages of mitosis. Mol Biol Cell. 2007;18:4024–4036. doi: 10.1091/mbc.E07-05-0517. [DOI] [PMC free article] [PubMed] [Google Scholar]
- Schmit TL, Ahmad N. Regulation of mitosis via mitotic kinases: new opportunities for cancer management. Mol Cancer Ther. 2007;6:1920–1931. doi: 10.1158/1535-7163.MCT-06-0781. [DOI] [PubMed] [Google Scholar]
- Simizu S, Osada H. Mutations in the Plk gene lead to instability of Plk protein in human tumour cell lines. Nat Cell Biol. 2000;2:852–854. doi: 10.1038/35041102. [DOI] [PubMed] [Google Scholar]
- Smith MR, Wilson ML, Hamanaka R, Chase D, Kung H, Longo DL, et al. Malignant transformation of mammalian cells initiated by constitutive expression of the polo-like kinase. Biochem Biophys Res Commun. 1997;19(234):397–405. doi: 10.1006/bbrc.1997.6633. [DOI] [PubMed] [Google Scholar]
- Soni DV, Sramkoski RM, Lam M, Stefan T, Jacobberger JW. Cyclin B1 is rate limiting but not essential for mitotic entry and progression in mammalian somatic cells. Cell Cycle. 2008;7:1285–1300. doi: 10.4161/cc.7.9.5711. [DOI] [PubMed] [Google Scholar]
- Spankuch-Schmitt B, Wolf G, Solbach C, Loibl S, Knecht R, Stegmuller M, et al. Downregulation of human polo-like kinase activity by antisense oligonucleotides induces growth inhibition in cancer cells. Oncogene. 2002;21:3162–3171. doi: 10.1038/sj.onc.1205412. [DOI] [PubMed] [Google Scholar]
- Steegmaier M, Hoffmann M, Baum A, Lenart P, Petronczki M, Krssak M, et al. BI 2536, a potent and selective inhibitor of polo-like kinase 1, inhibits tumor growth in vivo. Curr Biol. 2007;17:316–322. doi: 10.1016/j.cub.2006.12.037. [DOI] [PubMed] [Google Scholar]
- Strebhardt K, Kneisel L, Linhart C, Bernd A, Kaufmann R. Prognostic value of pololike kinase expression in melanomas. JAMA. 2000;283:479–480. doi: 10.1001/jama.283.4.479. [DOI] [PubMed] [Google Scholar]
- Strebhardt K, Ullrich A. Targeting polo-like kinase 1 for cancer therapy. Nat Rev Cancer. 2006;6:321–330. doi: 10.1038/nrc1841. [DOI] [PubMed] [Google Scholar]
- Sumara I, Gimenez-Abian JF, Gerlich D, Hirota T, Kraft C, de la TC, et al. Roles of polo-like kinase 1 in the assembly of functional mitotic spindles. Curr Biol. 2004;14:1712–1722. doi: 10.1016/j.cub.2004.09.049. [DOI] [PubMed] [Google Scholar]
- Takai N, Hamanaka R, Yoshimatsu J, Miyakawa I. Polo-like kinases (Plks) and cancer. Oncogene. 2005;24:287–291. doi: 10.1038/sj.onc.1208272. [DOI] [PubMed] [Google Scholar]
- Takai N, Miyazaki T, Fujisawa K, Nasu K, Hamanaka R, Miyakawa I. Expression of polo-like kinase in ovarian cancer is associated with histological grade and clinical stage. Cancer Lett. 2001a;164:41–49. doi: 10.1016/s0304-3835(00)00703-5. [DOI] [PubMed] [Google Scholar]
- Takai N, Miyazaki T, Fujisawa K, Nasu K, Hamanaka R, Miyakawa I. Polo-like kinase (PLK) expression in endometrial carcinoma. Cancer Lett. 2001b;169:41–49. doi: 10.1016/s0304-3835(01)00522-5. [DOI] [PubMed] [Google Scholar]
- Takaki T, Trenz K, Costanzo V, Petronczki M. Polo-like kinase 1 reaches beyond mitosis-cytokinesis, DNA damage response, and development. Curr Opin Cell Biol. 2008;20:650–660. doi: 10.1016/j.ceb.2008.10.005. [DOI] [PubMed] [Google Scholar]
- Toyoshima-Morimoto F, Taniguchi E, Nishida E. Plk1 promotes nuclear translocation of human Cdc25C during prophase. EMBO Rep. 2002;3:341–348. doi: 10.1093/embo-reports/kvf069. [DOI] [PMC free article] [PubMed] [Google Scholar]
- Toyoshima-Morimoto F, Taniguchi E, Shinya N, Iwamatsu A, Nishida E. Polo-like kinase 1 phosphorylates cyclin B1 and targets it to the nucleus during prophase. Nature. 2001;410:215–220. doi: 10.1038/35065617. [DOI] [PubMed] [Google Scholar]
- Weichert W, Denkert C, Schmidt M, Gekeler V, Wolf G, Kobel M, et al. Polo-like kinase isoform expression is a prognostic factor in ovarian carcinoma. Br J Cancer. 2004a;90:815–821. doi: 10.1038/sj.bjc.6601610. [DOI] [PMC free article] [PubMed] [Google Scholar]
- Weichert W, Kristiansen G, Schmidt M, Gekeler V, Noske A, Niesporek S, et al. Polo-like kinase 1 expression is a prognostic factor in human colon cancer. World J Gastroenterol. 2005a;11:5644–5650. doi: 10.3748/wjg.v11.i36.5644. [DOI] [PMC free article] [PubMed] [Google Scholar]
- Weichert W, Kristiansen G, Winzer KJ, Schmidt M, Gekeler V, Noske A, et al. Polo-like kinase isoforms in breast cancer: expression patterns and prognostic implications. Virchows Arch. 2005b;446:442–450. doi: 10.1007/s00428-005-1212-8. [DOI] [PubMed] [Google Scholar]
- Weichert W, Schmidt M, Gekeler V, Denkert C, Stephan C, Jung K, et al. Polo-like kinase 1 is overexpressed in prostate cancer and linked to higher tumor grades. Prostate. 2004b;60:240–245. doi: 10.1002/pros.20050. [DOI] [PubMed] [Google Scholar]
- Weinstein IB. Cancer. Addiction to oncogenes--the Achilles heal of cancer. Science. 2002;297:63–64. doi: 10.1126/science.1073096. [DOI] [PubMed] [Google Scholar]
- Yamada S, Ohira M, Horie H, Ando K, Takayasu H, Suzuki Y, et al. Expression profiling and differential screening between hepatoblastomas and the corresponding normal livers: identification of high expression of the PLK1 oncogene as a poor-prognostic indicator of hepatoblastomas. Oncogene. 2004;23:5901–5911. doi: 10.1038/sj.onc.1207782. [DOI] [PubMed] [Google Scholar]
- Yu C, Zhang X, Sun G, Guo X, Li H, You Y, et al. RNA Interference-Mediated Silencing of the Polo-like Kinase 1 Gene Enhances Chemosensitivity to Gemcitabine in Pancreatic Adenocarcinoma Cells. J Cell Mol Med. 2008;12:2334–2349. doi: 10.1111/j.1582-4934.2008.00257.x. [DOI] [PMC free article] [PubMed] [Google Scholar]
Associated Data
This section collects any data citations, data availability statements, or supplementary materials included in this article.
Supplementary Materials
Supplementary Figure 1. Plk1 antibody is specific to human Plk1. A) Mouse anti-Plk1 detects HA-tagged human Plk1, endogenous Plk1 and is blocked by recombinant Plk1. Immunoblot analysis of expressed HA-tagged Plk1 in 293T cells and endogenous Plk1 in melanoma cell lines (WM115, A375 and HS294T) was done. Positive Plk1 bands are shown on left and a parallel blot exposed to equal amount of Plk1 antibody preincubated with recombinant Plk1 showing negative staining on right. Equal loading was confirmed with β-actin. B) Tissue cores show negative staining with IgG control primary antibody. The tissue micro-array was stained with primary IgG2b control anti-sera and respective secondary antibody as described previously. This was done simultaneously with Plk1 staining shown in Fig.1 to equalize exposure and color development times. Representative cores for melanoma samples are shown demonstrating negative staining with control anti-sera. C) Tissue stroma stains negative for Plk1. Additional selected cores of melanoma samples containing tissue stroma are shown to demonstrate that positive Plk1 staining is tumor specific. D) Positive Plk1 staining is not melanin specific. Representative images of normal skin tissue containing higher levels of melanin containing cells are shown demonstrating negative staining for Plk1.
Supplementary Figure 2. A) Treatment of melanoma cells with GW843682X does not alter Plk1 protein levels. Following treatment with GW843682X, the cells were collected and Plk1 levels were determined by Western blot analysis and β-actin was used as a loading control. B) Primary NHEM cells used represent a proliferating population. After Plk1 inhibition treatments and analysis for proliferation using Trypan blue exclusion analysis, the cell number at conclusion (72 hours) was calculated for the controls of each cell line used (NHEM, WM115, A375 and HS294T). The data demonstrates that each cell line tested was proliferating and thus susceptible to Plk1 inhibition, albeit at differing rates.
Supplementary Figure 3: Plk1 inhibition decreases the long term colony formation ability of melanoma cells. Following lentiviral transduction via Plk1 shRNA, melanoma cells were replated at a density of 2.5 × 10³ and allowed to grow for 2 weeks with media changes every 3 days. For GW843682X treatment, cells were plated at 2.5 × 10³, treated 24 hours later and retreated every 3 days for 2 weeks. Colonies were stained with crystal violet, counted and images were captured using a digital camera. Representative pictures of each melanoma cell line are shown.
Supplementary Figure 4: Plk1 inhibition results in a high percentage of melanoma cells with the “polo” phenotype. After shPlk1 and GW843682X treatments, WM115 and HS294T cells were fixed, stained for α-tubulin (Red), and DNA counterstained with DAPI (Blue). Pictures were capture using Bio-Rad Radiance 2100 MP Rainbow Confocal/Multiphoton System. Representative pictures from multiple run are shown here.