

Abstract
Age-related macular degeneration (AMD) is a leading cause of vision loss in the elderly. Genetic mechanisms underlying AMD are complex. Understanding the etiology of AMD is important because of the significant health and social concerns. In this paper, we describe a forest-based approach to systematically identifying multiple genes, gene-gene interactions and gene-environment interactions underlying complex diseases in genomewide case-control studies and the application of this approach to a published data set on AMD. Our analysis not only confirmed two known haplotypes, ACTCCG (on chromosome 1 with a p-value of 1.98e-6) and TCTGGACGACA (on chromosome 7 with a p-value of 9.81e-3), but also revealed two novel haplotypes, GATAGT (on chromosome 5 with a p-value of 3.46e-3) and TCTTACGTAGA (on chromosome 12 with a p-value of 3.16e-2). Thus, the significance of this work is twofold. First, we propose a powerful and robust method to identify high-risk haplotypes and their interactions; second, we reveal potential genetic variants associated with AMD.
Keywords: Age-related macular degeneration, Genomewide association, Haplotype, Interaction, Random Forest
1. Introduction
Age-related macular degeneration (AMD) is the most common cause of vision loss in the elderly. The macula is a circular area at the center of the retina that is responsible for distinguishing colors, resolving closely spaced objects, and detecting motion. AMD results in progressive damage to the macula, ultimately leading to legal blindness (de Jong et al., 2006). There were about 10 million Americans affected by AMD (http://www.macular.org/disease.html). AMD principally affects individuals over the age of 50. Due to the projected increase in aging populations, the prevalence of AMD is expected to double in the coming decades unless effective methods of prevention and treatment are found. AMD is becoming a major humanistic and economical burden on society. Therefore, understanding the etiology of this complex disease is of critical importance.
AMD has diverse symptoms and multiple contributing factors. Known environmental risk factors of AMD include smoking and dietary intake of lipids (Hyman and Neborsky, 2002). Previous studies have also revealed strong evidence indicating a genetic contribution to the disease (Daiger, 2005; Marx, 2006). In addition, it has been increasingly recognized that complex diseases, such as AMD, are likely to be the result of gene-gene and/or gene-environment interactions.
Interaction or epistasis refers to the phenomenon that the effect of the genotype in a particular locus might depend on the genotype of other loci (Carlborg and Haley, 2004). Despite the belief that considering interactions among genes is useful in identifying susceptible loci (Heinzen et al., 2007; Kallberg et al., 2007), identifying gene–gene interactions remains a difficult task. One of the major challenges arises from the large number of potential interactions and the resulting tests, because we generally do not have priori knowledge of which genes may be engaged in epistasis. A practical approach is to first identify genes with main effects (Tiwari and Elston, 1997, 1998; Frankel and Schork 1996) with a genome-wide scan and then test candidate epistatic effects.
Analytical approaches to identifying gene-gene interactions have been evolving at a steady pace in recognition of the importance of epistatic effects (Musani et al., 2007). Recently, Schwender et al. (2008) introduced a logic regression based method to identify interactions among single nucleotide polymorphisms (SNPs) for the disease status in case control studies. They proposed to first identify interactions by applying simulated annealing to bootstrap samples drawn from the whole data set, and then use two measures – one for single-tree logic regression and the other for multiple-tree logic regression – to quantify the importance of these interactions. Wan et al. (2009) introduced a hierarchical learning approach that ranks the multi-SNP interactions from local genomic regions to the entire genome, called MegaSNPHunter. MegaSNPHunter first partitions the whole genome into multiple short sub-genomes and builds a classifier for each sub-genome based on multi-SNP interactions. Important SNPs identified based on their contributions to the classifier then compete with each other. The competition terminates when the number of SNPs chosen is less than the size of a sub-genome. When SNPs involved in an interaction are located on different sub-genomes, MegaSNPHunter requires their marginal effects be above the medium of marginal effects of the sub-genomes they reside in.
By using the recursive partitioning technique (Zhang and Singer, 1999; Zhang and Bonney, 2000) and the concept of variable importance, Chen et al. (2007) introduced a systematic approach to exploring gene-gene (as well as gene-environment) interactions from result of genome-wide scans. Most applications of recursive partitioning based techniques in genetic studies (Nelson et al., 2001; Bastone et al., 2004; Cook et al., 2004; Foulkes et al., 2004) focus on detecting interactions among given markers. The approach of Chen and colleagues detects haplotypes and interactions among them by first identifying markers that may contribute to the disease trait. It then reconstructs haplotype blocks from these markers and estimates the frequencies of such haplotype blocks. The uncertainties in the estimated haplotypes are accounted for by constructing a forest of classification trees from simulated data sets with the same haplotype frequencies. The importance of each candidate haplotype is obtained by averaging the importance measures of classification trees in the forest.
We re-analyzed the data from a published case-control study on AMD (Klein et al., 2005) using the forest-based approach of Chen et al. with potential enhancements. In Chen et al.’s approach, individual markers that may contribute to the disease trait are identified by constructing a classification tree (Zhang and Bonney, 2000) using individual SNPs as features (or also called predictive variables) and the disease status as outcome. In genome-wide association studies, we often have a small number of samples and a large number of markers. An important consequence of constructing classification tree on genome-wide association data sets is that there are typically many splits that are indistinguishable or close by either the Gini- or entropy-based goodness-of-split criterion (Zhang et al., 2003). To overcome this problem, we propose to use Random Forest (Zhang, 1998; Breiman, 2001) to accommodate the “multiple optimal splits” since one of the main reasons Random Forests perform better than a single classification tree is their ability to utilize redundant (correlated) variables. Thus, in our analysis, Random Forests are used to identify individual markers that may contribute to the disease, instead of a single classification tree.
2. Material and Methods
Data Set
The data set used in our analysis is the result of a whole-genome case-control association study for genes involved in AMD (Klein et al., 2005). The sample population is a subset of 146 subjects from the Age-Related Eye Disease Study (AREDS) (AREDS Research Group, 2001). Subjects who exhibited at least some large drusen in a quantitative photographic assessment combined with evidence of sight-threatening AMD were assigned as case. Subjects with either no drusen or only a few small drusen were assigned as control. As a result, 96 subjects were identified as case and 50 as control.
A total of 116,210 SNP markers were genotyped for the 146 subjects (Klein et al., 2005). After removing those SNPs with excessive missing data (missing > 5%), 109,650 SNPs on the 22 autosomal chromosomes were included in our analysis.
Genome-wide Association Analysis
We adapted a forest-based approach to identifying haplotypes and haplotype-haplotype interactions in case-control data proposed by Chen et al. (2007), except that here we propose to substitute their tree-based initial screening of SNPs with our forest-based initial screening. Because this screening affects the subsequent analysis, the forest-based screening tends to less likely miss important genomic regions.
For convenience, let us summarize our approach as follows:
Algorithm 1
Apply the Random Forest (Brieman, 2001) by using the individual SNPs as variables and the disease status as outcome.
Construct haplotype blocks containing the SNPs identified in step 1 using Hapview (Daly et al., 2001).
Use SNPHAP (Clayton, 2006) to estimate the haplotype frequencies in the haplotype blocks identified in step 2.
A new data set is constructed from the original data set by assigning phased haplotypes in all regions (or genes) randomly according to the haplotype frequencies inferred in step 3.
Apply the recursive classification tree program to construct tree T by using the data set constructed in step 4.
-
Evaluate the importance, VT(h), of any haplotype h for tree T.
Specifically, for a haplotype h, let |T| be the number of nodes in tree T. Then the importance of the haplotype h in tree T is defined as(1) where Lt is the depth of node t and Gt is theχ2 independence test statistic of node t.
Repeat steps 4–6 a number (e.g., 100) of times and obtain the average importance measure.
Random Forests
In our analysis, we replaced the recursive classification tree used in step 1 of Algorithm 1 with a Random Forest (Zhang, 1998; Breiman, 2001). Random Forests grow many classification trees instead of one. Each tree is grown as follows: 1) If the number of objects in the training set is N, sample N objects at random - but with replacement, from the original data. This sample will be the training set for growing the tree; 2) If there are M variables, a number m≪M is specified such that at each node, m variables are selected at random out of the M and the best split on these m is used to split the node. The value of m is held constant during the forest growing. Each classification tree is grown to the largest extent possible. There is no pruning. To classify a new object with an input vector of variables, put the input vector down each of the classification trees in the forest. Each tree assigns the object to a class, and we say that the tree “votes” for that class. The forest chooses the class having the most votes (over all the trees in the forest).
Random Forest ranks variables by a variable importance index (Breiman, 2001), which reflects the “importance” of a variable to the classification accuracy, while considering the interaction between variables. Specifically, in a Random Forest each tree is constructed using a different cohort of bootstrap samples from the original cohort. About one-third of the samples are left out of the bootstrap samples and hence not used in the construction of the tree. These left-out samples are referred to as the out-of-bag (oob) samples of the tree.
To determine the importance of a variable, first we randomly permute values of this variable in the oob samples; then we classify both the original oob samples and the permuted oob samples by the corresponding tree. The difference in the correct classifications between the original and permuted oob samples contributes to the calculation of the importance of the variable by averaging over all trees in the forest.
Unlike (Chen et al., 2007), step 1 of our analysis uses the Random Forests program (Breiman, 2001) instead of a classification tree. The remaining steps are identical to Algorithm 1. Comparing to a single classification tree, Random Forest is an ensemble of weak classifiers (individual trees are not pruned and do not perform well as classifiers themselves). Obviously, constructing Random Forests requires more computation time than constructing a single classification tree. Because the procedures for constructing trees in Random Forest are parallel, Algorithm 1 can be implemented easily on parallel computers to accelerate the computation.
3. Results
Significant SNPs
It is noteworthy that while the raw importance score in the Random Forest ranks the variables, it does not set a threshold as to which variables are important enough worthy further investigation. To address this need, we begin a Random Forest with a size of 50,000 trees. Then we increase the size gradually by step of 50,000 until 500, 000. For each Random Forest, we calculate the importance scores and compare them among variables in this series of forests. In the AMD data set, 7 SNPs consistently rank at the top ten of the importance scores. Hence, they are selected for subsequent analysis. These 7 SNPs are rs380390, rs1329428, rs1394608, rs970476, rs931798, rs10272438, rs404569, and rs10492272. Chen et al. (2007) analyzed the same data set using recursive classification tree in the initial screening step. Only two SNPs, rs1329428 and rs10272438 were identified.
Significant Haplotypes
By using Hapview (Daly et al., 2001) we were able to construct five haplotype blocks containing the seven selected SNPs (see Table 1). For convenience, we refer to these five haplotype blocks as regions 1, 2, 3, 4 and 5, respectively. It is worth noticing that region 1 contains 2 SNPs on chromosome 1, namely rs380390 and rs1329428; and that region 2 contains 3 SNPs on chromosome 5, which are rs1394608, rs970476 and rs931798. The haplotype frequencies of the five haplotype blocks were estimated independently using SNPHAP (Clayton, 2006). Haplotypes with frequency zero were excluded. As a result, 6, 10, 19, 9 and 35 haplotypes from regions 1 to 5 remained, respectively.
Table 1.
Selected SNPS and the Haplotype Blocks
| Region | SNP | Number of SNPs in the block | Chromosome | Gene Name | P-value |
|---|---|---|---|---|---|
| 1 | rs380390 rs1329428 |
6 | 1 | CFH | 1.98e-6 |
| 2 | rs1394608 rs970476 rs931798 |
6 | 5 | SGCD | 3.46e-3 |
| 3 | rs10272438 | 11 | 7 | BBS9 | 9.81e-3 |
| 4 | rs404569 | 5 | 7 | - | - |
| 5 | rs10492272 | 11 | 12 | ANKS1B | 3.16e-2 |
To assess the significance of the five haplotypes, we followed Chen et al (2007)’s approach to estimate the distribution of the haplotype importance under the null hypothesis: (1) generate 100 data sets by permuting the case-control status and keeping the genomewide SNP data intact; and (2) for each of the 100 data sets, (2a) screen the SNPs and identify regions of interest (those seemingly associated with the outcome), and (2b) focusing on the regions of interest (this is to reduce the computational burden), generate 5,000 unphased data sets (the parental origin of the haplotypes is unknown) by permuting the case-control status within one of the 100 permuted data sets. For each combination of the 100 by 5,000 permuted data sets, we obtain the maximum of haplotype importance, which produces the empirical null distribution of the maximum haplotype importance.
Four haplotypes were identified to be associated with the AMD at the genomewide 0.05 level. The most significant haplotype ACTCCG was found on chromosome 1 (region 1) with a p-value of 1.98e-6, which has been previously reported (Klein et al., 2005; Chen et al., 2007). Also identified to be related to AMD by previous study (Chen et al., 2007) was haplotype TCTGGACGACA on chromosome 7 (region 3), with a p-value of 9.81e-3. Furthermore, two novel haplotypes associated with AMD were identified. They are GATAGT on chromosome 5 (region 2) and TCTTACGTAGA on chromosome 12 (region 5), with the p-values of 3.46e-3 and 3.16e-2, respectively. None of the haplotypes from region 4 was identified as having significant association with AMD.
Region 1 is located in the Complement Factor H gene [CFH (MIM no. 134370)], which has been shown to be linked to AMD by numerous studies (Klein et al., 2005; Haines et al., 2005). Haplotype block 2 is in region of Sarcoglycan, delta (35kDa dystrophin-associated glycoprotein) [SCGD (MIM no. 601411)], located in 5q33-q34. This gene is near D5S1480 on chromosome 5, which has been proved to be of particular interest with AMD disease (Haddad et al., 2006; Week, et al., 2000, 2001). Haplotype block 3 is located in Bardet-Biedl syndrome 9 [BBS9 (MIM no. 607968)] in 7p14, which is consistent with Chen et al (2007). Haplotype block 5 is in Ankyrin repeat and sterile alpha motif domain containing 1B [ANKS1B (MIM no. 607815)] with a location at 12q23.1. On Chromosome 12, a linkage peak has been detected by others (Fisher et al., 2005; Haddad et al., 2006; Week, et al., 2000, 2001); however, to our knowledge, no association studies have reported any finding in this region. So, ANKS1B is a worthy candidate for further investigation.
Haplotype frequencies at the four loci vary between case and control populations. Figure 1 represents the trends in the frequencies of the expected numbers of significant haplotypes in AMD case and control groups. The haplotype in CFH is confirmed to increase the risk of AMD, whereas all the other 3 haplotypes seem to have protective effects.
Figure 1.
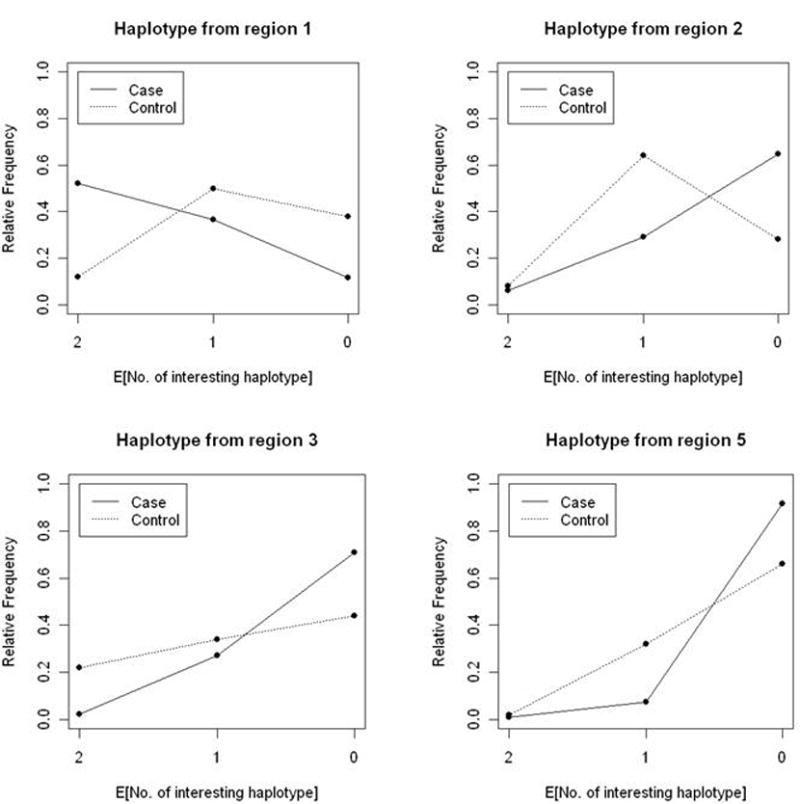
The frequencies of the expected numbers of significant haplotypes in AMD case and control groups.
Furthermore, we examined the trees constructed from the 100 phased data sets generated in step 4 of Algorithm 1. As expected, there are variations in tree structures due to the random choices in the phased haplotypes. Importantly, they also share a common profile in the first three layers, as shown in Figure 2. It can be seen that node 1 is split by haplotype ACTCCG. By this split, the whole group is partitioned into two subgroups (nodes 2 and 3), and the subjects in node 2 are not expected to have any copy of haplotype ACTCCG while the subjects in node 3 are not expected to have at least one copy of haplotype ACTCCG. Nodes 2 and 3 are then split by haplotypes GATAGT and TCTGGACGACA, respectively. Node 4 is split by haplotype TCTTACGTAGA. Therefore, the four significant haplotypes appear to act in the forest in a coherent manner.
Figure 2.
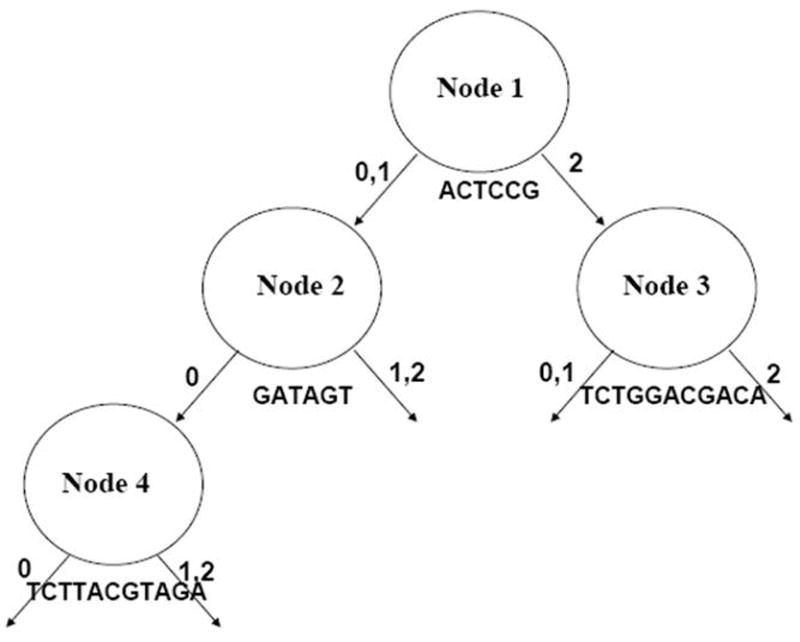
The common profile shared by the 100 phased datasets generated from the original AMD dataset.
4. Discussion
To identify haplotypes and haplotype-haplotype interactions associated with AMD, we applied a forest-based method proposed by Chen et al (2007) with modifications to a whole-genome case-control association study data set (Klein et al., 2005). The key features of Chen et al’s approach include (a) flexibility in dealing with missing data in the predictors, (b) achieving variable selection and model selection simultaneously, (c) avoiding the colinearity problem, and (d) the ability to accommodate the uncertainties in haplotype inference. The first step of Chen et al’s approach entails identifying individual markers that may contribute to the disease trait by constructing a classification tree using individual SNPs as variables and the disease status as outcome. We improved upon Chen et al’s approach by replacing the single classification tree with Random Forests. As a result, the improved approach avoids the “multiple optimal splits” problems faced by classification trees in genome-wide association studies while retaining the key features of Chen et al’s approach at the same time. This improvement is evident from our analysis of the AMD data set for which our proposed method revealed additional significant SNPs that were not discovered by Chen et al. (2007).
The improved forest-based approach can successfully identify both haplotypes with main effects and/or interactions of disease-associated haplotypes. Using this approach, we were able to identify two haplotypes that have been reported to be associated with AMD by previous studies as well as two novel haplotypes that have not been identified by existing main effect methods.
Although we focused on case-control studies in this report, the approach can be readily extended to family-based or related individuals by replacing SNPHAP (Clayton, 2006) with programs that derive haplotype frequencies for family-based data (Ye et al., 2005).
Acknowledgments
We thank the ‘Yale University Biomedical High Performance Computing Center’ (NIH grant: RR19895) for computational resources.
Funding: This research is supported in part by grants K02DA017713 and R01DA016750 from the National Institutes on Drug Abuse.
References
- 1.AREDS Research Group. A Randomized, Placebo-Controlled, Clinical Trial of High-Dose Supplementation With Vitamins C and E, Beta Carotene, and Zinc for Age-Related Macular Degeneration and Vision Loss: AREDS Report No. 8. Arch Ophthalmol. 2001;119:1417–1436. doi: 10.1001/archopht.119.10.1417. [DOI] [PMC free article] [PubMed] [Google Scholar]
- 2.Bastone L, Reilly M, Rader DJ, Foulkes AS. MDR and PRP: A Comparison of Methods for High-Order Genotype-Phenotype Associations. Human Heredity. 2004;58:82–92. doi: 10.1159/000083029. [DOI] [PubMed] [Google Scholar]
- 3.Breiman L. Random Forests. Machine Learning. 2001;45:5–32. [Google Scholar]
- 4.Carlborg O, Haley CS. Epistasis: too often neglected in complex trait studies? Nat Rev Genet. 5:618–625. doi: 10.1038/nrg1407. [DOI] [PubMed] [Google Scholar]
- 5.Chen X, Liu CT, Zhang MZ, Zhang HP. A forest-based approach to identifying gene and gene-gene interactions. PNAS. 2007;104:19199–19203. doi: 10.1073/pnas.0709868104. [DOI] [PMC free article] [PubMed] [Google Scholar]
- 6.Clayton D. [Accessed November, 12 2007];SNPHAP, A Program for Estimating Frequencies of Large Haplotypes of SNPs. 2006 Available at http://www-gene.cimr.cam.ac.uk/clayton/software/snphap.txt.
- 7.Cook NR, Zee RY, Ridker PM. Tree and spline based association analysis of gene-gene interaction models for ischemic stroke. Statistics in Medicine. 2004;23:1439–1453. doi: 10.1002/sim.1749. [DOI] [PubMed] [Google Scholar]
- 8.Daiger SP. Was the Human Genome Project worth the effort? Science. 2005;308:362–364. doi: 10.1126/science.1111655. [DOI] [PMC free article] [PubMed] [Google Scholar]
- 9.Daly MJ, Rioux JD, Schaffner SF, Hudson TJ, Lander ES. High-resolution haplotype structure in the human genome. Nature Genetics. 2001;29:229–232. doi: 10.1038/ng1001-229. [DOI] [PubMed] [Google Scholar]
- 10.Fisher SA, Abecasis GR, Yashar BM, et al. Meta-analysis of genome scans of age-related macular degeneration. Hum Mol Genet. 2005;14:2257–64. doi: 10.1093/hmg/ddi230. [DOI] [PubMed] [Google Scholar]
- 11.Foulkes AS, De Gruttola V, Hertogs K. Combining genotype groups and recursive partitioning: an application to human immunodeficiency virus type 1 genetics data. J R Stat Soc C. 2004;53:311–323. [Google Scholar]
- 12.Frankel WN, Schork NJ. Who’s afraid of epistasis? Nature Genetics. 1996;14:371–373. doi: 10.1038/ng1296-371. [DOI] [PubMed] [Google Scholar]
- 13.Haddad S, Chen CA, Santangelo SL, Seddon JM. The Genetics of Age-Related Macular Degeneration: A Review of Progress to Date. Survey of Ophthalmology. 2006;51:316–363. doi: 10.1016/j.survophthal.2006.05.001. [DOI] [PubMed] [Google Scholar]
- 14.Haines JL, Hauser MA, Schmidt S, Scott WK, Olson LM, Gallins P, Spencer KL, Kwan SY, Noureddine M, Gilbert JR, Schnetz-Boutaud N, Agarwal A, Postel EA, Pericak-Vance MA. Complement Factor H Variant Increases the Risk of Age-Related Macular Degeneration. Science. 2005;15:419–421. doi: 10.1126/science.1110359. [DOI] [PubMed] [Google Scholar]
- 15.Heinzen EL, Yoon W, Tate SK, Sen A, Wood NW, Sisodiya SM, Goldstein DB. Nova2 Interacts with a Cis-Acting Polymorphism to Influence the Proportions of Drug-Responsive Splice Variants of SCN1A. American Journal of Human Genetics. 2007;80:876–883. doi: 10.1086/516650. [DOI] [PMC free article] [PubMed] [Google Scholar]
- 16.Hyman L, Neborsky R. Risk factors for age-related macular degeneration: an update. Curr Opin Ophthalmol. 2002;13:171–175. doi: 10.1097/00055735-200206000-00007. [DOI] [PubMed] [Google Scholar]
- 17.de Jong PT. Age-Related Macular Degeneration. NEJM. 2006;355:1474–1485. doi: 10.1056/NEJMra062326. [DOI] [PubMed] [Google Scholar]
- 18.Kallberg H, Padyukov L, Plenge RM, Ronnelid J, Gregersen PK, van der Helm-van, Mil AH, Toes RE, Huizinga TW, Klareskog L, Alfredsson L. Gene-Gene and Gene-Environment Interactions Involving HLA-DRB1, PTPN22, and Smoking in Two Subsets of Rheumatoid Arthritis. American Journal of Human Genetics. 2007;80:867–875. doi: 10.1086/516736. [DOI] [PMC free article] [PubMed] [Google Scholar]
- 19.Klein RJ, Zeiss C, Chew EY, Tsai JY, Sackler RS, Haynes C, Henning AK, SanGiovanni JP, Mane SM, Mayne ST, Bracken MB, Ferris FL, Ott J, Barnstable C, Hoh C. Complement Factor H Polymorphism in Age-Related Macular Degeneration. Science. 2005;308:385–389. doi: 10.1126/science.1109557. [DOI] [PMC free article] [PubMed] [Google Scholar]
- 20.Marx J. Gene offers insight into macular degeneration. Science. 2006;314:405. doi: 10.1126/science.314.5798.405a. [DOI] [PubMed] [Google Scholar]
- 21.Musani SK, Shriner D, Liu N, Feng R, Coffey CS, Yi N, Tiwari HK, Allison DB. Detection of Gene × Gene Interactions in Genome-Wide Association Studies of Human Population Data. Human Heredity. 2007;63:67–84. doi: 10.1159/000099179. [DOI] [PubMed] [Google Scholar]
- 22.Nelson MR, Kardia SL, Ferrell RE, Sing CF. A Combinatorial Partitioning Method to Identify Multilocus Genotypic Partitions That Predict Quantitative Trait Variation. Genome Research. 2001;11:458–470. doi: 10.1101/gr.172901. [DOI] [PMC free article] [PubMed] [Google Scholar]
- 23.Schwender H, Ikstadt K. Identification of SNP Interaction Using Logic Regression. Biostatistics. 2008;9:187–198. doi: 10.1093/biostatistics/kxm024. [DOI] [PubMed] [Google Scholar]
- 24.Tiwari HK, Elston RC. Deriving components of genetic variance for multilocus models. Genetic Epidemiology. 1997;14:1131–1136. doi: 10.1002/(SICI)1098-2272(1997)14:6<1131::AID-GEPI95>3.0.CO;2-H. [DOI] [PubMed] [Google Scholar]
- 25.Tiwari HK, Elston RC. Restrictions on Components of Variance for Epistatic Models. Theoretical Population Biology. 1998;54:61–174. doi: 10.1006/tpbi.1997.1373. [DOI] [PubMed] [Google Scholar]
- 26.Wan X, Yang C, Yang Q, Xue H, Tang NLS, Yu W. MegaSNPHunter: A Learning Approach to Detect Disease Predisposition SNPs and High Level Interactions in Genome Wide Association Study. BMC Bioinformatics. 2009;10:13. doi: 10.1186/1471-2105-10-13. [DOI] [PMC free article] [PubMed] [Google Scholar]
- 27.Weeks DE, Conley YP, Mah TS, Paul TO, Morse L, Ngo-Chang J, Dailey JP, Ferrell RE, Gorin MB. A full genome scan for age-related maculopathy. Hum Mol Genet. 2000;9:1329–49. doi: 10.1093/hmg/9.9.1329. [DOI] [PubMed] [Google Scholar]
- 28.Weeks DE, Conley YP, Tsai HJ, Mah TS, Rosenfeld PJ, Paul TO, Eller AW, Morse LS, Dailey JP, Ferrell RE, Gorin MB. Age-related maculopathy: an expanded genome-wide scan with evidence of susceptibility loci within the 1q31 and 17q25 regions. Am J Ophthalmol. 2001;132:682–92. doi: 10.1016/s0002-9394(01)01214-4. [DOI] [PubMed] [Google Scholar]
- 29.Ye YQ, Zhong X, Zhang HP. A genome-wide tree- and forest-based association analysis of comorbidity of alcoholism and smoking. BMC Genetics. 2005;6(Suppl 1):S135. doi: 10.1186/1471-2156-6-S1-S135. [DOI] [PMC free article] [PubMed] [Google Scholar]
- 30.Zhang HP. Classification trees for multiple binary responses. Journal of the American Statistical Association. 1998;93:180–193. [Google Scholar]
- 31.Zhang HP, Bonney G. Use of classification trees for association studies. Genetic Epidemiology. 2000;19:323–332. doi: 10.1002/1098-2272(200012)19:4<323::AID-GEPI4>3.0.CO;2-5. [DOI] [PubMed] [Google Scholar]
- 32.Zhang HP, Singer B. Recursive Partitioning in Health Science. Springer; New York: 1999. [Google Scholar]
- 33.Zhang HP, Yu CY, Singe B. Cell and Tumor Classification using Gene Expression Data: Construction of Forests. Proceedings of the National Academy of Sciences USA. 2003;100:4168–4172. doi: 10.1073/pnas.0230559100. [DOI] [PMC free article] [PubMed] [Google Scholar]