

Abstract
The variability in phenotypic presentations and the lack of consistency of genetic associations in mental illnesses remain a major challenge in molecular psychiatry. Recently, it has become increasingly clear that altered promoter DNA methylation could play a critical role in mediating differential regulation of genes and in facilitating short-term adaptation in response to the environment. Here, we report the investigation of the differential activity of membrane-bound catechol-O-methyltransferase (MB-COMT) due to altered promoter methylation and the nature of the contribution of COMT Val158Met polymorphism as risk factors for schizophrenia and bipolar disorder by analyzing 115 post-mortem brain samples from the frontal lobe. These studies are the first to reveal that the MB-COMT promoter DNA is frequently hypomethylated in schizophrenia and bipolar disorder patients, compared with the controls (methylation rate: 26 and 29 versus 60%; P = 0.004 and 0.008, respectively), particularly in the left frontal lobes (methylation rate: 29 and 30 versus 81%; P = 0.003 and 0.002, respectively). Quantitative gene-expression analyses showed a corresponding increase in transcript levels of MB-COMT in schizophrenia and bipolar disorder patients compared with the controls (P = 0.02) with an accompanying inverse correlation between MB-COMT and DRD1 expression. Furthermore, there was a tendency for the enrichment of the Val allele of the COMT Val158Met polymorphism with MB-COMT hypomethylation in the patients. These findings suggest that MB-COMT over-expression due to promoter hypomethylation and/or hyperactive allele of COMT may increase dopamine degradation in the frontal lobe providing a molecular basis for the shared symptoms of schizophrenia and bipolar disorder.
INTRODUCTION
Despite strong evidence supporting a genetic basis for schizophrenia and bipolar disorder, no specific gene with a major effect has been identified as causing these complex and devastating disorders that affect five million people in the USA and 120 million worldwide (1). Several lines of evidence indicate that an improved understanding of the etiology of psychiatric illnesses can only be obtained using integrative approaches that consider multiple factors linked to these diseases, i.e. genetic, epigenetic and/or environmental factors (1,2). Methylation of the cytosine residues in the regulatory CpG islands of genes (3,4) is one of the major molecular mechanisms for regulating differential gene expression in response to environment. There are several DNA methyltransferases that act interactively to mediate gene-specific methylation patterns in response to environmental effects as well as the physiological state of the cell (5–7). Although S-adenosyl methionine (SAM) is the major donor of methyl groups for DNA methylation, folic acid and vitamin B12 are required for homocysteine metabolism to regenerate the pool of SAM (8). Modification of the gene promoter methylation pattern in response to a variable environment can have deleterious effects similar to those derived from malfunctional alleles. The ability of altered DNA methylation to produce a disease phenotype in response to specific environmental insults likely depends upon genetic susceptibility to a specific disease (2). Recently, we and others (9,10) showed that DNA hypermethylation-mediated hypo-expression of the reelin gene (RELN) in the frontal lobe of the brain correlated with schizophrenia pathogenesis. These findings led us to hypothesize that alterations in the expression patterns of other neuronal network genes involved in the pathogenesis of schizophrenia and bipolar disorder may be mediated by epigenetic modifications such as altered DNA methylation of regulatory regions.
Catechol-O-methyltransferase (COMT ), one of the most intensively investigated genes in psychiatric illnesses (2), regulates the homeostatic levels of neurotransmitter dopamine in the synapses. This gene is located in chromosome 22q11.21, a region linked by several studies to schizophrenia and bipolar disorder (11–14). COMT has two known isoforms: membrane-bound COMT (MB-COMT ) and soluble COMT (S-COMT ), each with its own promoter (15). MB-COMT is the predominant form involved in the degradation of synaptic dopamine in the human brain (15,16). MB-COMT exhibits a functional polymorphism at codon 158 where an adenine (A) substitution for guanine (G) in the gene sequence produces a methionine (Met) substitution for valine (Val) in the COMT protein. The Val-coding allele of the Val158Met polymorphism codes for an enzyme with approximately three times higher physiological activity (17). Several studies showed that increased dopamine degradations arising from COMT hyperactivity are associated with disturbances in attention, executive cognition and working memory performance in normal populations and schizophrenic patients (18–22) and that these effects may even be progressive over time (21). In contrast, the hypoactive allele (Met) of the gene is associated with less variability in reaction time and greater stability in performance (23).
Despite the fact that several studies reported an association between the Val allele and the risk of schizophrenia and bipolar disorder (16,24,25), meta-analyses of family-based and case–control association studies were inconsistent (26–28). Furthermore, the COMT Val158Met polymorphism is linked to early onset major depressive disorder (29) and suicide (30), suggesting that depressive symptoms may also be associated with COMT functions. The variability in genetic associations between the COMT Val158Met polymorphism and major psychiatric disorders suggests that, in addition to a genetic basis for COMT activity, environmental factors may also be involved in modulating the effects of the risk allele. For example, besides folic acid and vitamin B12, butyrate (31), tea polyphenols (32) and alcohol (33–35) influence genes promoter DNA methylation and may also affect expression level and modulate the phenotypic outcome of risk alleles. There is precedence in the field of cancer research supporting epigenetic modulation of COMT function, as DNA hypermethylation of the CpG-rich islands in the promoter of MB-COMT has been correlated with hypo-expression of the gene in some types of cancer (36). Here, our overall goal is to analyze the combined genetic and epigenetic data in correlation with the role of gene–environmental interactions in an integrated model. In the present study, we provide evidence for over-activity of the MB-COMT in the frontal lobe of patients with schizophrenia and bipolar disorder due to over-expression of the gene resulting from epigenetic promoter DNA hypomethylation and, preliminarily to a lesser extent, the presence of the hyperactive allele of COMT Val158Met polymorphism.
RESULTS
The differential promoter DNA methylation patterns associated with altered gene expression are tissue-specific (3–5). Frontal lobe is one of the most commonly observed dysfunctional regions of the brain in schizophrenia and bipolar disorder (37,38). Recent studies indicate that epigenetic modifications may be involved in the dysfunction of pre-frontal cortex in schizophrenia (9,10,39). Furthermore, schizophrenia-associated problems in attention, cognitive processes and working memory have been linked to frontal lobe dopamine deficiency (40). Because of the relative scarcity of dopamine transporters in the frontal lobe of the brain, the turnover of dopamine is likely to be primarily dependent on the catabolism of dopamine by the action of COMT in this brain region (41). Therefore, we compared the status of promoter DNA methylation and the corresponding transcript levels of the MB-COMT in the frontal lobe of post-mortem brains of schizophrenia and bipolar disorder patients against the control subjects. In the same samples, the allele and genotype frequencies of the COMT Val158Met polymorphism were also determined as an alternate or an additional mechanism for regulating dopamine levels due to the hyperactivity associated with the Val allele.
The DNA and RNA samples were derived from Brodmann’s area 46 (dorso-lateral frontal cortex dissected from post-mortem brains) obtained from the Stanley Medical Research Institute (SMRI). In addition, the Harvard Brain Tissue Resource Center (HBTRC) provided 10 well-matched samples of brain tissue from the frontal lobe (Brodmann’s area 9 and 10) of schizophrenia patients and normal controls. Demographics of these subjects are summarized in Table 1. The ethnicity of most of the samples was white (96.6%), except for two samples from blacks: one from a Hispanic and one from a Native American. Although only the SMRI data were used for matching samples for methylation analysis (because of the lack of information on all the variables for the HBTRC samples), the patterns of methylation were similar in the two subgroups. Gene-expression analysis was performed using total RNA obtained from the SMRI and RNA extracted from the cortical area of the HBTRC brain samples.
Table 1.
Sample characteristics
| Source | Diagnosis | Number of cases |
Sex M/F | Age mean (SD) |
Laterality L/R |
|---|---|---|---|---|---|
| SMRI | Schizophrenia | 35 | 26/9 | 42.5 (8.47) | 17/18 |
| SMRI | Bipolar disorder | 35 | 18/17 | 45.2 (10.54) | 20/15 |
| SMRI | Control | 35 | 26/9 | 44.2 (7.63) | 16/19 |
| HBTRC | Schizophrenia | 5 | 5/0 | 46.0 (2.74) | 3/2 |
| HBTRC | Control | 5 | 5/0 | 45.4 (2.61) | 3/2 |
M, male; F, female; L, left; R, right.
There were no significant differences between the case and control groups with respect to age (t = 0.86, P = 0.39), post-mortem interval (t = −0.59, P = 0.55) and brain laterality (χ2 = 0.06, P = 0.81). Further details of the SMRI brain samples are provided at: http://www.stanleyresearch.org/programs/brain_collection.asp. Although there was a trend for greater brain pH in controls compared with patients (mean = 6.6 versus 6.45, two-sample median test Z = −1.79, P = 0.07), there was no effect of pH on any of the variables (data not shown).
MB-COMT promoter methylation status of schizophrenia and bipolar disorder patients
The methylation status of the promoter region of MB-COMT was analyzed using methylation-specific PCR (MSP), and representative examples are shown in Figure 1. At least two MSP trials were carried out for each sample. Although there was ~90% consistency between two trials (the same unmethylated or methylated signals in both MSP trials), a third trial was also undertaken to define the predominant methylation status of any ambiguous samples. In addition, bisulfite sequencing (as described under Materials and Methods) was undertaken for further clarification and confirmation. A summary of the analyses of 35 schizophrenia patients, 35 bipolar disorder patients and 35 controls is shown in Table 2. In general, it appeared that MB-COMT promoter was predominantly unmethylated in the frontal lobe of human post-mortem brain tissue from both patients and controls. However, careful examination of these brain samples revealed a significantly higher frequency of methylation in control subjects (60%), compared with either schizophrenia (26%; χ2 = 7.01; P = 0.004) or bipolar disorder patients (29%; χ2 = 7.89; P = 0.008) (Table 2). Although the frequency of methylation in the left brain of the controls was significantly higher than in the right brain (81 versus 42% methylated, respectively), this difference was less pronounced in schizophrenia (29 versus 22% methylated) and bipolar disorder patients (30 versus 27% methylated) (Fig. 2). These results suggested that the group differences in total methylation derived primarily from differences inherent to the left brain between controls and patients with schizophrenia (P = 0.003) or bipolar disorder (P = 0.002). As shown in Figure 1, a representative example for the left brain of the control subjects (Fig. 1B, M) indicates that the degree of CpG methylation was relatively high in the promoter region corresponding to base pairs − 150 to + 100 relative to the start point of the coding region, as determined by bisulfite sequencing and detailed in the Materials and Methods section. On the contrary, in schizophrenia and bipolar disorder patients, the target cytosines of the promoter region were hypomethylated and these changes were found to extend even into the coding region (Fig. 1B, U). These differences were not attributable to the effects of age or gender (Table 3).
Figure 1.

Representative examples of the MSP and sequence analyses of MB-COMT promoter. Brain samples from schizophrenia and bipolar disorder patients and control subjects were analyzed using MSP as outlined under Materials and Methods. (A) MSP: lanes U and M indicate the presence of unmethylated and methylated templates, respectively. Placental DNA (PD) and in vitro methylated DNA (ID) served as negative and positive controls, respectively. A no-template sample (H2O) was used to detect DNA contamination in the PCR reactions. Samples 1–3 indicate the presence of a methylated promoter DNA and samples 4–7 represent an unmethylated promoter. (B) Bisulfite sequencing of the MB-COMT promoter of an un-methylated template (sample 4) correlates with conversion of cytosine (C) to thymine (T) in the DNA sequence traces in the promoter region corresponding to CpGs (U). However, the samples exhibiting methylation (sample 1) contained sequence traces for Cs in addition to Ts at several CpGs (which include two SP1 binding sites), indicating that the template is a mixture of unmethylated and methylated DNA (M). The color codes for the nucleotides are as follows: red, thymine; green, adenine; black, guanine and blue, cytosine. The original DNA sequence is indicated at the top of the trace; red Cs are within CpG sequences and are targets for methylation.
Table 2.
Frequency of MB-COMT promoter methylation in the SMRI samples as determined by MSP
| Methylated/total (%) | |||
|---|---|---|---|
| Frontal lobe hemisphere | Left | Right | Total |
| Schizophrenia | 5/17 (29) | 4/18 (22) | 9/35 (26) |
| Bipolar | 6/20 (30) | 4/15 (27) | 10/35 (29) |
| Control | 13/16 (81) | 8/19 (42) | 21/35 (60) |
| Comparison | OR (95% CI); P | OR (95% CI); P | OR (95% CI); P |
| Control versus schizophrenia | 0.10 (0.01–0.61); 0.003 | 0.39 (0.10–1.59); 0.197 | 0.23 (0.07–0.71); 0.004 |
| Control versus bipolar disorder | 0.10 (0.02–0.46); 0.002 | 0.50, (0.12–2.07); 0.350 | 0.27 (0.09–0.80); 0.008 |
Figure 2.
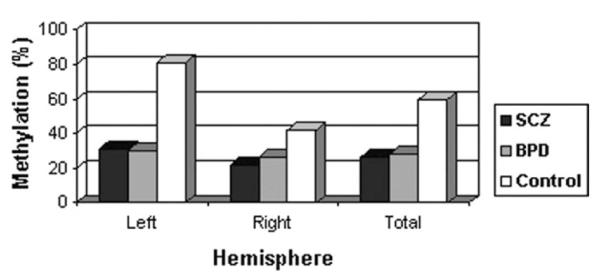
The effect of laterality of brain in MB-COMT promoter DNA methylation. The frequency of methylated MB-COMT promoter in the left and right hemispheres of the brains of patients with schizophrenia (SCZ) or bipolar disorder (BPD) and normal controls.
Table 3.
DNA methylation status as a function of gender
| Methylated/total (%) | |||
|---|---|---|---|
| Male | Female | Gender (χ2, P) | |
| Total sample | 27/69 (39) | 13/36 (36) | 0.13 (0.72) |
| Schizophrenia | 7/26 (27) | 2/9 (22) | 0.11 (0.74) |
| Bipolar disorder | 4/17 (23) | 6/18 (33) | 0.41 (0.52) |
| Control | 16/26 (62.) | 5/9 (56) | 0.10 (0.75) |
MB-COMT promoter methylation and alcoholism
The history and degree of life-time alcohol consumption for all of the samples (until death) were provided by the SMRI. As recent studies reported an association between alcoholism and promoter DNA hypermethylation of several genes (33–35), the relationship between alcohol abuse and the frequency of MB-COMT methylation was examined. Among schizophrenia patients, MB-COMT promoter methylation was remarkably more frequent in current heavy (4/9) and moderate (2/3) alcohol users (total 6/12 methylated = 50%) than patients with no history of alcohol use (1/9) or social drinking (1/7) (total 2/16 methylated = 12.5%, P = 0.04, Fisher’s exact test). Such a pattern of alcohol abuse was rare in controls (i.e. among the 35 control cases examined, there were only two current-moderate abusers with an unmethylated and two previous-heavy abusers with a methylated MB-COMT promoter).
Overall, only nine out of 35 schizophrenic patients and 10 out of 35 bipolar patients of the SMRI samples exhibited MB-COMT promoter methylation. Interestingly, most of these schizophrenic patients were moderate/heavy alcohol abusers at the time of their death (6/9, 66%). Similarly, 30% of these bipolar patients were either previously or at the time of their death heavy alcohol abuser. Thus, overall, our data suggest that a portion of the observed methylation could be due to alcohol abuse and hence the actual MB-COMT methylation rate may be even lower than what has been observed in schizophrenia and bipolar patients. Despite the fact that these preliminary results may be informative, the data should be interpreted cautiously because of our small sample size.
MB-COMT promoter methylation and drug use
We also examined the link between antipsychotic and mood stabilizer drugs and MB-COMT promoter methylation by comparing the frequency of methylation in bipolar disorder patients who were either treated or untreated with such drugs. In the bipolar disorder samples from the SMRI, 12 patients had used antipsychotic drugs at the time of death, whereas 16 patients did not. The frequency of MB-COMT promoter methylation was the same in these two subgroups (no antipsychotic drugs: 37% methylated versus antipsychotic drugs: 33% methylated; χ2 = 0.05; P = 0.82). Among the bipolar disorder patients, 20 used either antipsychotic or mood stabilizer drugs at the time of death, whereas eight had used neither class of drugs (we did not have drug use information for seven of the patients). Only three patients with schizophrenia were drug-free at the time of death. Altogether, the frequency of MB-COMT promoter methylation was not significantly different in these two sub-groups as well (neither drug: 45% methylated versus either drug: 30% methylated, P = 0.4). Note that half of the bipolar patients who used neither drug and exhibited methylation of MB-COMT promoter were heavy alcohol abusers at the time of death. By excluding them from this analysis, 33% of non-drug users show methylation of MB-COMT promoter. Interestingly, the use of histone deacetylase/DNA methylation-inhibitor valproate also did not specifically alter methylation status (29% exhibited methylation out of 17 valproate users). These results support the idea that antipsychotic or mood-stabilizing drugs were not responsible for the observed methylation differences. Furthermore, our analyses indicate that smoking, brain pH, post-mortem interval and age of onset did not affect the frequency of MB-COMT methylation (data not shown).
Expression analysis of MB-COMT
It has been well established in the literature that hypermethylation of the promoter DNA generally correlates with silencing of gene expression (3,5). We treated a cancer cell line, H441, which exhibited partial MB-COMT promoter DNA methylation, with 5-azacytidine (a demethylating agent) as described elsewhere (42). We found that there was a prominent induction of MB-COMT expression (data not shown) confirming a similar observation made in an independent study (36). Therefore, we examined the relationship between MB-COMT promoter DNA methylation status and gene expression in the HBTRC and SMRI samples.
The expression analysis of MB-COMT at the transcript level was undertaken for the frontal cortical area of the brain tissues provided by the HBTRC using semi-quantitative reverse transcriptase PCR (RT-PCR) and was subsequently confirmed by quantitative real-time PCR (qRT-PCR). To minimize the effects of confounding variables, we dissected the brain cortex of the HBTRC samples who were male with a mean age of 46 and a narrow range of age (SD = 2.7). Pure gray matter was excised and DNA and RNA were extracted from the same sections using TRIzol. Semi-quantitative RT–PCR analysis of these samples showed a distinct pattern of over-expression of MB-COMT in schizophrenia patients, compared with control subjects (Fig. 3A). In order to further clarify and confirm the differences in MB-COMT expression in patients and controls, we re-evaluated these samples by qRT-PCR (Table 4). Overall, we found that there was 2.7 times higher expression of MB-COMT in schizophrenia patients than in controls using the samples from the HBTRC (Table 4). Furthermore, qRT-PCR analysis of the SMRI samples also showed that the transcript level was significantly (t = −2.37, P = 0.02) higher in patients with schizophrenia and bipolar disorder compared with control subjects (Fig. 3B). However, the magnitude of this difference was less than what was observed in the HBTRC samples. One possibility for this difference may be derived from the nature of the tissues used for the extraction of RNA. We used the same brain section from the gray matter for the isolation of both DNA and RNA for the HBTRC samples, whereas homogenized brain tissues dissected from adjacent cortical brain regions were used to extract either DNA or RNA for the SMRI samples, due to an established sample collection procedure of the provider. Nevertheless, as expected, both semi-quantitative RT–PCR (Fig. 3A) and qRT-PCR data (Fig. 3B, Table 4) were consistent in revealing an inverse correlation between MB-COMT promoter methylation and expression (Fig. 3C). Furthermore, the level of MB-COMT expression of combined samples exhibiting unmethylated MB-COMT promoters was 56% more than the controls that exhibited methylation in the left brain. This was even more prominent among 11 schizophrenic and bipolar patients who were drug-free at the time of death. Excluding the two patients who were severely alcoholic, the expression of MB-COMT among these patients with an unmethylated promoter was more than 2-fold higher than controls with a methylated promoter in the left frontal lobe of the brain. These studies also showed that the expression levels of MB-COMT with Metor Val-coding alleles were not drastically different (data not shown).
Figure 3.

MB-COMT expression profiles of schizophrenia and bipolar disorder and the relationship between methylation status and MB-COMT expression. (A) Semi-quantitative RT-PCR of schizophrenia and control samples was performed as described under Materials and Methods. Control samples were loaded in lanes 1–5 and samples from schizophrenia patients were loaded in lanes 6–10. βActin was used as an internal standard to normalize the abundance of the RT-PCR product derived from the MB-COMT gene. (B) qRT-PCR analysis of the patients and control subjects was performed as described under Materials and Methods. For each sample (1–35, X-axis), the relative quantitation of the MB-COMT expression compared with the mean of the controls is sorted from minimum to maximum level (Y-axis). As indicated earlier, most of the schizophrenic (SCZ) and bipolar disorder patients (BPD) show higher levels of expression of the MB-COMT in the frontal lobe compared with the controls. (C) MSP analysis showing levels of methylation in representative samples from (A).
Table 4.
MB-COMT expression analysis of HTBRC samples by qRT-PCR
| Samples | 1 | 2 | 3 | 4 | 5 | 6 | 7 | 8 | 9 | 10 |
|---|---|---|---|---|---|---|---|---|---|---|
| Brain laterality | R | R | L | L | L | L | R | L | R | L |
| Methylation status | M | M | M | M | U | U | U | U | U | M |
| Relative expression of MB-COMT | 0.84 | 1.15 | 0.5 | 0.87 | 2.45 | 2.3 | 4.6 | 2.3 | 4.6 | 1.7 |
| Relative fold change | Controls = 1.16 (SD = 0.76) | SCZ = 3.1 (SD = 1.4) | ||||||||
| Patients versus controls | (t = −2.74, P = 0.026) | |||||||||
R, right; L, left; M, methylated; U, unmethylated.
Samples 1–5 are from controls and 6–10 from schizophrenic patients. CT value was used for relative quantitation of MB-COMT expression (normalized to GADPH gene expression as an internal control). Fold changes was calculated as 2–△△CT.
Inverse correlation between MB-COMT and DRD1 expression
As aberrant MB-COMT promoter methylation and corresponding differential expression patterns could influence the level of synaptic dopamine and the expression of downstream genes, we analyzed the expression of DRD1 at the level of transcription in the same brain samples using qRT-PCR, as described under Materials and Methods. In general, there was an overall hypo-expression of DRD1 in the patients compared with the control subjects, with a clear inverse correlation between MB-COMT and DRD1 expression both in controls and in patients (Fig. 4). In order to quantify the correlation between MB-COMT and DRD1expression, we classified the total samples, controls and patients groups into two subgroups (low and high MB-COMT expressive) as sorted by MB-COMT expression levels. There was a significant degree of inverse correlation between MB-COMT and DRD1 expression in the 52 low and 52 high MB-COMT expressive groups of the total samples (P = 0.001; two-tailed t-test). The expression of DRD1 in 17 schizophrenic and bipolar disorder patients with high levels of MB-COMT was also significantly reduced compared with the same group with low levels of MB-COMT (P = 0.045 and 0.025, respectively; two-tailed t-test) (Fig. 4). A trend for such relationship in the control subjects was also detected (P = 0.058). It is also noteworthy that the expression of DRD1, in high MB-COMT expressive schizophrenic and bipolar disorder patients, was significantly less than the control subjects (P = 0.006 and 0.03, respectively).
Figure 4.

Relationship between the expression of MB-COMTand DRD1. The upper (A) and lower (B) panels represent the gene expression profiles of high and low expressive MB-COMT groups, respectively, in total samples, control subjects, schizophrenia (SCZ) and bipolar disorder patients (BPD). As it is shown, when MB-COMT expression is high, the expression of DRD1is low and vice versa, both in control subjects and in the patient group implying that, in general, hyper-expression of MB-COMT is associated with hypo-expression of DRD1.
COMT Val158Met polymorphism in schizophrenia and bipolar disorder
The hyperactive Val allele of the Val158Met polymorphism was linked to schizophrenia and bipolar disorder (25,26). Therefore, to determine the relative contributions of either genetic or epigenetic alterations in the pathogenesis of schizophrenia and bipolar disorder, we surveyed the potential contribution of this polymorphism in the same samples used for the evaluation of MB-COMT promoter methylation status (Fig. 5). Although the data should be interpreted cautiously because of the small sample size (i.e. 115), we found that the frequency of the Val allele was significantly low in controls (37.5%) compared with the patients with schizophrenia (55.0%, P = 0.026) in the SMRI and HBTRC samples combined. In addition, controls were less frequently homozygous for the Val allele (10%) compared with the patients with bipolar disorder (28.5%, P = 0.040) (Table 5). The frequency of Met homozygosity also exhibited a corresponding increase in controls compared with the schizophrenics (35 versus 15%, P = 0.04), but not bipolar disorder patients. Additionally, the overall age of onset of schizophrenia in patients homozygous or heterozygous for the Val allele was 7 years younger compared with the patients homozygous for Met (20.2 versus 27.4 years, t = 2.60, P = 0.014). Thus, the presence of the Val allele exhibits a significant correlation (P = 0.01) with an earlier onset of schizophrenia. Furthermore, we found a correlation between COMT Val homozygosity and DNA hyper-methylation of the RELN promoter in a cAMP-response element as determined using a previously described method (9). All of the schizophrenics and control subjects with a Val/Val genotype exhibited a hyper-methylated RELN promoter (14/14), whereas it was only 50% (10/20) in Met/Met homozygotes (P = 0.01) and 75.5% in Val/Met heterozygotes.
Figure 5.
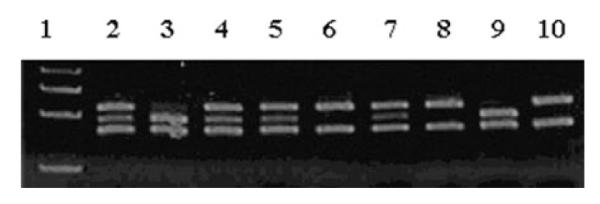
COMTVal158Met polymorphism in schizophrenia and bipolar disorder. The COMT Val158Met polymorphism analysis was performed as described under Materials and Methods. Briefly, COMT gene-specific PCR products encompassing the polymorphic region were cleaved by the NlaIII restriction enzyme to an 88 bp fragment and two variable fragments 96 and 114 bp in length, which indicated the Met and Val alleles, respectively. The first lane contains a 50 bp DNA ladder used as the marker. Representative examples are shown for heterozygosity (lanes 2, 4, 5 and 7), Met homozygosity (lanes 3 and 9) and Val homozygosity (lanes 6, 8 and 10).
Table 5.
Frequency of Val and Met alleles of the Val158Met polymorphism of COMT in schizophrenia, bipolar disorder and control subjects
| Diagnosis | Genotype frequency | Allele frequency | |||
|---|---|---|---|---|---|
| Val/Val, N (%) | Val/Met, N (%) | Met/Met, N (%) | Val, N (%) | Met, N (%) | |
| Control | 4/40 (10.0) | 22/40 (55.0) | 14/40 (35.0) | 30 (37.5) | 50 (62.5) |
| Schizophrenia | 10/40 (25.0) | 24/40 (60.0) | 6/40 (15.0) | 44 (55.0) | 36 (45.0) |
| OR (95% CI); P | 3.00 (0.76–14.27); 0.078 | 1.23 (0.46–3.28); 0.651 | 0.33 (0.09–1.08); 0.039 | 2.04 (1.03–4.03); 0.026 | |
| Bipolar disorder | 10/35 (28.6) | 16/35 (45.7) | 9/35 (25.7) | 36 (51.4) | 34 (48.6) |
| OR (95% CI); P | 3.60 (1.06–12.08); 0.040 | 0.62 (0.23–1.68); 0.303 | 1.90 (0.62–5.83); 0.270 | 0.86 (0.45–1.64); 0.652 |
ORs and test statistics are for each patient group versus the control group.
Genotype comparisons are computed in relation to the sum of the other genotypes.
Our analyses reported here provide a clear trend that needs to be further validated in a larger population in the future studies. Indeed, given our small sample size, the observed association between Val allele and these mental diseases should be considered cautiously, particularly due to the lower frequency of the Val allele in our control subjects compared with larger studies in Caucasians (e.g. 49% in reference 26 and 42% in alfred.med.yale.edu). Note that within our data set, the data on allele frequencies are consistent with the Hardy–Weinberg equilibrium. The observed frequencies of COMT genotypes did not significantly deviate from those expected under Hardy–Weinberg equilibrium for controls [, P = 0.273], schizophrenia patients [, P = 0.180] or bipolar disorder patients [, P = 0.615].
As mentioned earlier, our objective in studying this polymorphism was to undertake an integrated approach to examine both genetic and epigenetic factors involved in the pathogenesis of major mental disorders. In our sample set, differences in frequency of MB-COMT hypomethylation in the left brain (51%) and differences in Val homozygosity between all cases and controls (16.5%) were found to explain 60% of the variance in risk for either schizophrenia or bipolar disorder (51% plus 16.5% minus overlaps). Interestingly, among 14 schizophrenic and bipolar patients of the SMRI samples with Met homozygosity, the only patient who was diagnosed as schizo-affective and one bipolar patient with severe alcoholism had a methylated MB-COMT promoter (13%, both of them in right hemisphere), whereas nine of 13 controls with such genotype had a methylated MB-COMT promoter (69%, χ2 = 10.83, P = 0.001).
The effect of COMT Val158Met polymorphism and promoter hypomethylation on suicide
Val homozygosity and MB-COMT hypomethylation were also examined in bipolar patients who had committed suicide. Among 15 bipolar patients who died due to suicide, 12 had MB-COMT promoter hypomethylation (80%), whereas two of the three who had a methylated COMT promoter were Val homozygous. The rate of suicide was 60% (6/10) and 33% (3/9) among Val and Met homozygotes, respectively. It is also noteworthy that all of the Met homozygotes in the suicidal group had a hypomethylated MB-COMT promoter. After excluding the three patients from the non-suicidal group who died due to drowning which may or may not reflect a suicidal attempt, the frequency of either MB-COMT hypomethylation or Val homozygosity was 93% (14/15) and 65% (11/17) in the suicidal and non-suicidal bipolar groups, respectively (χ2 = 3.82, P = 0.05). Despite no conclusive pattern of promoter methylation or Val158Met COMT polymorphism in the seven schizophrenic patients who died by suicide, there were no cases exhibiting Met homozygosity with a methylated MB- COMT promoter among all suicidal patients, including schizophrenics. Interestingly, the average level of MB-COMT expression in the suicidal patients with Met homozygosity was 55% more than other patients.
These data suggest that Met homozygosity and MB-COMT promoter hypermethylation may be protective against schizophrenia, bipolar disorder and suicide.
COMT polymorphism and promoter methylation in cardiac disease
Because most of our control subjects died due to cardiac diseases, we compared MB-COMT methylation and polymorphism status in patients and controls with the same cause of death to exclude the possibility that higher frequencies of MB-COMT methylation and Met homozygosity may be attributed to cardiac diseases. We were particularly interested in the fact that the frequency of the Met allele in our control samples (62.5%) was slightly more than the average in populations of European descent (58%) (alfred.med.yale.edu). However, our analysis excluded this possibility as the frequency of MB-COMT methylation was the same in 15 schizophrenic patients who died by cardiac disease (26.5%) and in 20 bipolar patients who died by cardiac and other diseases (35%).
DISCUSSION
Our studies provide the first comprehensive molecular explanation at the level of genetic and epigenetic alterations for a direct relationship between the risk for schizophrenia and bipolar disorder and hyperactivity of MB-COMT. MB-COMT over-expression or hyperactivity observed in schizophrenia and bipolar disorder (Fig 3 and Tables 4–5) could lead to a significant increase in the rate of degradation of dopamine in the synaptic cleft resulting in a hypodopaminergic state and frontal lobe hypoactivity. Both schizophrenia and bipolar disorder patients exhibit hypofrontality, executive dysfunctions and frontal lobe lesions with associated unresponsiveness and failures to suppress inappropriate responses (38,43). Additionally, negative/depressive symptoms and recognized schizophrenia-associated problems in attention, hedonic activities, cognitive processes, working memory and social functioning have also been linked to dopamine dysfunction in the frontal lobe of the brain (1,40).
There have been contradictory data on the differences in expression of COMT in schizophrenia and mood disorders in the literature. One study suggested that there is no difference in the levels of COMT transcripts between cases and controls (44), whereas another study reported a reduction in expression in superficial cortical layers and a corresponding increase in deep layers in schizophrenia (45). Although one possibility is that the differential laminar distribution of COMT transcripts could explain the lack of difference in the overall expression levels noted in the first study, our examination of the PCR primers/probe sequences used for the analysis of the COMT transcripts suggests that the primers/probes used in these studies could amplify or hybridize with both S-COMT and MB-COMT isoforms. A recent study reported that promoter DNA methylatin of the S-COMT was not involved in the pathogenesis of schizophrenia (46). In this study, we evaluated the MB-COMT, which is regulated by a distinct promoter and is the primary mediator of the catabolism of synaptic dopamine in the human brain (15).
Recent studies indicate that a DRD1-mediated dopaminergic mechanism is responsible for working memory function (47) and synaptic plasticity (48) in the prefrontal cortex. Here, an inverse correlation between MB-COMT and DRD1 expression was observed both in the controls and in the patients. This implies that frontal lobe dopamine deficiency may cause under-stimulation of dopamine receptors and hence a developmentally regulated hypo-expression of DRD1gene. Thus, MB-COMT over-expression in schizophrenic and bipolar patients may aggravate the end-effects in the patients leading to long-term downstream defects in the developing brain. In the promoter of several neuronal genes [e.g. brain-derived neurotrophic factor (BDNF)], the cAMP response elements (CREs) are regulated indirectly by DRD1-like receptors through a cascade of events mediated by cAMP, protein kinase-A and cAMP responsive element modulator (CREM). Although promoter DNA de-methylation leads to gene expression, neuronal inactivation could lead to BDNF promoter methylation and lack of gene expression (49). The promoter sequence of RELN, a gene hypo-expressed in schizophrenia and bipolar disorder patients (10,50–53), also harbors a CRE element that could be subject to regulation by dopamine through DRD1 receptors (9). The observed inverse correlation between MB-COMT and DRD1 expression and the association between MB-COMT over-activity and hyper-methylation of CRE in the RELN promoter in schizophrenia imply that the modulatory effects of DRD1 on RELN expression could be compromised by epigenetically and/or genetically determined MB-COMT over-activity. Considering the roles of RELN in cell signaling and synapse formation, the resultant RELN hypo-expression should influence the brain neuronal network development and contribute to the diseases (10,50–53). However, a hypoactive Met allele or promoter methylation and hypo-expression of MB-COMT could lead to a higher synaptic dopamine level that could illicit protective effects. Recent findings showed that activation of different forms of dopamine receptors in the fontal lobe depends on the synaptic dopamine level (54). Low levels of dopamine are associated with DRD1 activation, whereas higher levels are associated with activations of both DRD1 and DRD2 receptors that co-operate to provide the basis for the functionality of working memory. Interestingly, higher levels of synaptic dopamine delivered by DRD2 antagonists could also augment DRD1-mediated neuronal functions (54). It is also noteworthy that our analysis of other dopamine-related genes in the same samples revealed that in control subjects, when MB-COMT promoter was hypomethylated, almost always the DRD2 promoter was also hypomethylated (data not shown). Thus, it appears that the synaptic dopamine deficiency associated with MB-COMT hypomethylation could result in secondary DRD2 promoter hypomethylation in order to fine tune the dopamine transmission in the frontal lobe. On the contrary, in schizophrenic and bipolar patients, the level of compensatory DRD2 hypomethylation was significantly low compared with the extent observed in the control subjects (data not shown).
The Met allele of the COMT gene is associated with greater stability in performance in normal individuals (21), whereas the Val allele is correlated with susceptibility for schizophrenia, particularly in cannabis abusers (55). Also a recent study indicates that children with 22q11 deletion, who are hemizygous for COMT Met allele, have higher IQ and achievement scores and perform better on measures of pre-frontal cognition (e.g. Continuous Performance Task) compared with those with the Val allele (56). Schizophrenic patients homozygote for the Val also exhibit a significant degree of reduction in brain volumes particularly on the left side (anterior cingulate cortex, left amygdala-uncus and left thalamus), compared with Met homozygotes (57). Hence, the observed epigenetic MB-COMT hypomethylation/over-expression effects may also contribute to worsening of these brain abnormalities through reduction of RELN expression or other mechanisms.
Despite the fact that the MB-COMT promoter region is often hypomethylated in schizophrenia and bipolar disorder patients, there was a predominant unilateral partial methylation in the control subjects. These observations may indicate that differential expression of MB-COMT in the left frontal lobe may occur in response to the effects of other neuronal pathways and genes involved in brain laterality. Alternatively, MB-COMT promoter methylation in controls could occur as a physiological feedback response to environmentally mediated MB-COMT over-expression. Accordingly, a steady-state level of dopamine, required for specific neurons, is maintained to ensure the consolidation of the left brain dominancy in defined end effects. In contrast, the observed promoter hypomethylation in the left brain of schizophrenia and bipolar disorder patients is likely a consequence of a failure to adhere to the predestined methylation pattern during a critical period for the establishment of brain laterality or a failure of physiological feedback modulation of the MB-COMT. This idea may also provide a plausible explanation for the loss of brain lateralization in schizophrenia and bipolar disorders noted in several studies (58–61). One of the potential molecular mechanisms responsible for these defects could be loss of imprinting, as there is some evidence for linkage to maternally (but not paternally) transmitted alleles at the chromosome 22q locus in mental disorders (13).
Note that a systemic pathogenic insult such as folic acid deficiency during a critical developmental period can influence the extent of epigenetic modifications, including loss of imprinting and/or aberrant promoter DNA methylation patterns (62–64). Several lines of evidence indicate that folic acid deficiency and polymorphism of genes related to folate metabolism are associated with schizophrenia and mood disorders (65–67) as reviewed elsewhere (68). Furthermore, even the style of maternal care is known to alter offspring’s genetic methylation patterns, as observed for the glucocorticoid receptor in the hippocampus (69).
Overall, these observations suggest that it may be possible to trace the environmental influences on the modification of methylation patterns of genes, which may affect susceptibility to schizophrenia, bipolar disorder and possibly other mental disorders. Accordingly, the concept of the roles of different methylomes as the means of short-term/long-term adaptation in response to the influences of the environment requires further extensive studies to understand the molecular basis of the major psychiatric disorders. It should be noted that the analyses reported here were conducted using brain samples corresponding to the left and right lobes from different individuals rather than derived from the same persons due to the lack of availability of the latter type of samples. Although we expect that the overall findings reported here should remain the same as pooling of the data derived with samples from several individuals should cancel out inter-individual variations, these investigations should be repeated in the future using left and right lobe-derived brain samples from the same individuals for further validation.
Despite the unavailability of an antibody to measure the COMT protein and the lack of the ideal samples for research due to practical issues, the establishment of an association between promoter DNA hypomethylation and the Val158Met polymorphism of MB-COMT in schizophrenia and bipolar disorder would suggest new treatment modalities in psychiatry targeting the specific dysfunctional genes. Animal studies have demonstrated that COMT inhibitor drugs prevent stress-induced anhedonic state, improve pre-frontal cortex performance and potentate clozapine-induced extra-cellular dopamine release (70,71). In human, these drugs (e.g. tolcapone) were effective in treating major depressive disorders (72,73). These observations along with the results presented here argue that COMT inhibitor drugs may be of benefit in the treatment of other major mental diseases. It is interesting to note that other drugs with similar end effects (e.g. amphetamine) improve prefrontal cortex functions affecting working memory tasks in subjects with the Val/Val genotype of COMT (74). Mirtazapine, an antidepressant with noradrenergic property, is also more effective than specific serotonin re-uptake inhibitors in depressed patients with the COMT Val allele (75). In schizophrenia, apomorphine, a dopamine agonist, was also known to improve psychotic symptoms (76). A recent meta-analysis of 700 patients from 30 studies showed that the concurrent administration of L-dopa with antipsychotic drugs could further improve the symptoms of schizophrenia in half of the cases (77). While generally, improvement of cognitive symptoms by atypical antipsychotic drugs is related to prefrontal cortex dopamine release (78), even atypical anti-psychotics such as olanzapine are less effective in aiding working memory performance and prefrontal physiology in schizophrenic patients with the COMT Val allele (79). These findings along with the observed efficacy of aripiprazole, a partial agonist of dopamine receptors in psychotic disorders, imply that negative and cognitive symptoms of schizophrenia as well as depressive symptoms of bipolar and unipolar disorders could be targeted by COMT-inhibitor drugs, particularly in patients with a hypomethylated MB-COMT promoter or the Val/Val genotype, as we and others discussed elsewhere (2,80,81).
Conclusion
Promoter hypomethylation-associated over-expression of MB-COMT in the left frontal lobe and or the presence of the hyperactive Val allele of the Val158Met polymorphism may play a significant role in the pathogenesis of major psychiatric disorders. The connection established between MB-COMT over-activity and pathogenesis in this report strongly suggests that it is worthwhile to consider preventive strategies such as nutrition- or drug-based modulation of COMT promoter DNA methylation or the use of COMT-inhibitor drugs to prevent or improve the symptoms of schizophrenia and bipolar disorder.
MATERIALS AND METHODS
DNA and RNA extraction
Total RNA and DNA were prepared from the same dissected cortex of the HBTRC brain samples, using TRIzol (Life Technologies, Inc., Grand Island, NY, USA) according to manufacturer’s instructions. The SMRI extracted the total RNA and DNA using TRIzol and standard phenol–chloroform protocol, respectively, from the adjacent cortical areas of the post-mortem brains. cDNA synthesis and PCR amplification were performed using standard protocols as previously described (42).
Bisulfite treatment
Bisulfite converts unmethylated cytosine to uracil, whereas methylated cytosine remains unchanged (82). Then, a subsequent NaOH treatment coverts uracil to thymine. Approximately 1 μg of genomic DNA was denatured by treatment with 2 M NaOH and then treated with 10 mM hydroquinone and 3 M sodium bisulfite (pH 5) at 50°C for 16 h. The bisulfite-treated DNA was purified using Wizard DNA purification resin (Promega) and treated with 3 M NaOH, ethanol precipitated with ammonium acetate and glycogen and re-suspended in 20 μl of water.
MSP and bisulfite sequencing
MSP is known as one of the most sensitive screening methods to distinguish between methylated and unmethylated DNA at CpG sites. Although the sensitivity of direct sequencing of the bisulfite-treated DNA or cloned DNA is ~10–20% (83,84), the sensitivity of MSP is known to be >1% (83). This high sensitivity places the MSP as a highly favored method for screening of the methylated CpG sites within the CpG islands (83,85,86). Our MSP analysis of the COMT gene was carried out using primer sets described by Sasaki et al. (36). The two sets of primers corresponding to a CpG-rich area located in the MB-COMT gene promoter were used to amplify methylated and unmethylated strands in separate PCR reactions. The primer sequences used for the MSP analysis are as follows: methylated forward (MF) primer: 5′-TATTTTGGTTATCGTCGCGC-3′; methylated reverse (MR) primer: 5′-AACGAACGCAAACCGTAACG-3′; unmethylated forward (UF) primer: 5′-TATTTTGGTTATTGTTGTGT-3′ and unmethylated reverse (UR) primer: 5′-AACAAACACAAACCATAACA-3′.
For the MSP analysis, unmethylated (placental) DNA and in vitro methylated DNA were used as negative and positive controls, respectively, whereas a no DNA control (water) was used to detect any PCR contaminations. Various combinations of PCR cycles and annealing temperatures were examined to optimize PCR conditions, so that the unmethylated and methylated template-specific primers only generated PCR products that represent the unmethylated and methylated conditions, respectively. The high level of sensitivity of MSP allows the efficient high throughput examination of the DNA methylation status of test samples.
For bisulfite sequencing, the following primers were used to amply a 421 bp fragment. Forward primer: 5′-GTAAGATTAGATTAAGAGGT-3′ (36); reverse primer: 5′-CAATATTCCACCCTAAATCTAAAA-3′ and a nested primer (5′-GATATTTTTAC(T)GAGGATATT-3′) or the reverse primer was used as the sequencing primer.
PCR conditions
Master mixes were prepared and used in the PCR amplifications. A typical reaction of a total volume of 25 μl consisted of 2.5 μl of 10× standard buffer, 0.4 μl of 10 μM dNTPs, 1.5 μl of DMSO, 2.5 U of platinum Taq DNA polymerase (Invitrogen) and 25 pmol of each of methylated or unmethylated specific primers. Approximately 30 ng bisulfite-modified genomic DNA was used as template. PCR amplification was done with an initial incubation at 94°C for 2 min, followed by 31 cycles of 94°C for 30 s, 57°C for 40 s, 72°C for 40 s, followed by a final extension for 10 min at 72°C. Ten micro-liters of the MSP products were run on 6% polyacrylamide gel by electrophoresis, stained with ethidium bromide and visualized under UV light.
Approach for determination of MB-COMT promoter methylation status
There were two MSP trials for each sample. As indicated earlier, for each MSP trial, two sets of primers were used to amplify methylated or unmethylated strands in separate PCR reactions. Approximately, 90% of the samples showed the same results for both MSP trials. Samples were classified as unmethylated if no methylation signal was detected in the two MSP trials. Similarly, a sample was designated as methylated when a methylated signal was also detected in both MSP trials. Representative examples of samples exhibiting unmethylated or methylated status were subject to bisulfite sequencing (Fig. 1). Our results indicated that samples designated unmethylated did not exhibit traces corresponding to Cs due to complete conversion, whereas those determined to be methylated contained sequence traces of Cs indicating the presence of methylated Cs resistant to conversion by bisulfite treatment (see Fig. 1B for example). When the two initial MSP trials were not consistent (i.e. unmethylated in the first reaction and methylated in the second reaction), or whenever a weak methylated signal was observed, a third trial was also undertaken to define the methylation. Additionally, bisulfite sequencing was performed to make the final determination of the methylation status for these ambiguous samples. As these ‘ambiguous’ cases were distributed almost equally in different groups (three to four in each group, 11 in total) and excluding them from the analysis did not change the results of our statistical analyses in general, and for the observed findings as reported, we included them in the final analysis. Please also note that to avoid any bias with experiments, the investigators were blinded for the diagnosis of the samples until the MSP trials were completed. After the determination of the methylation status of the samples, the identity of samples was declared for data analysis.
Primers for MB-COMT expression analysis using semi-quantitative RT–PCR and qRT-PCR
The gene-specific primer pair used in the analysis of MB-COMT expression was designed from different exons to avoid any genomic DNA amplification and by placing them in locations which would exclusively amplify the MB-COMT isoform. The forward and reverse primers for the semi-quantitative RT–PCR were 5′-CTGCTTTGCTGCCGAGCTCAGAGGAGAC-3′ and 5′-TTCTTGTCGCCCACGTTCATG-3′. The qRT-PCR primers that solely amplify a 110 bp fragment were 5′-CTGCTTTGCTGCCGAGCTCAGAGGAGAC-3′ and 5′-GCCCAGCAACACAGCTGCCAACAG-3′.
Semi-quantitative RT–PCR of the βactin gene and real-time PCR of the GAPDH and βactin genes were used as an internal standard to normalize the abundance of the semi-quantitative RT–PCR and qRT-PCR products derived from the MB-COMT gene for the HBTRC samples. The β-actin primer sequences for the semi-quantitative RT–PCR were 5′-ACACTGTGCCCATCTACGAGG-3′ and 5′-AGGGGCCGGACTCGTCATACT-3′ and for the qRT-PCR were 5′-CGAGCACAGAGCCTCGCCTTTGCC-3′ and 5′- TGTCGACGACGAGCGCGGCGATAT-3′. The GAPDH primers were 5′-CACAAGAGGAAGAGAGAGACCCTC-3′ and 5′-TGAGTGTGGCAGGGACTC C-3′.
qRT-PCR analysis was done twice for the HBTRC samples, using ABI PRISM 7700 following several test trials with 1/2, 1/10, 1/100, 1/1000 diluted and no template controls with varying amount of primers to optimize for the best conditions. The qRT-PCR was set up in a reaction volume of 50 μl using components supplied in a Sybr-green PCR mix (BIO-RAD, Hercules, CA, USA). Each reaction also contained 100 nM each amplification primer and 2 μl of 1/10 diluted DNA. DNA amplifications were carried out in a 96-well reaction plate (MicroAmp, Foster City, CA, USA). Thermal cycling was initiated with a first denaturation step of 15 min at 95°C. The subsequent thermal cycling profile was 95°C for 15 s and 60°C for 45 s. Data obtained following 40 cycles of amplification were analyzed using the SDS 1.9.1 software.
The qRT-PCR for the SMRI samples was carried out twice in a 384-well plate (Applied Biosystem, Foster City, CA, USA) in a reaction volume of 10 μl using ABI PRISM 7900HT. Gene expression was measured with good reproducibility between duplicates and without the formation of primer dimers as evidenced by the appearance of a single product with a Tm of 82°C in the dissociation curve (data not shown). Cycle threshold (CT) value was used for relative quantitation of MB-COMT expression. Fold changes was calculated as 2−△△CT.
Primers for DRD1 expression analysis
qRT-PCR was carried out using the same condition as described earlier for the MB-COMT analysis using ABI PRISM 7900HT. The primers were, forward primer: 5′-CTGCGACGAATAATGCCATAGAGA-3′ and reverse primer: 5′-ATTGCACTCCTTGGAGATGGAGC-3′.
COMT gene Val158Met polymorphism
The COMT region was PCR amplified using a previously described primer set to evaluate the existence of the Val158Met polymorphism (87). The primers, 5′-TCGTGGACGCCGATTCAGG-3′ and 5′-ACAACGGGTCAGGCATGC-3′, were used to amplify a 207 bp fragment after 35 cycles using the previously described conditions. The PCR products were further analyzed by restriction digestion by targeting the 177th base of the fragment with the NlaIII restriction enzyme to distinguish between the Val and Met alleles (Fig. 5).
Data analysis
Univariate, bivariate and multivariate statistical tests were used for the analysis of the data. Parametric tests were used wherever possible. Large sample approximations (e.g. χ2) were used wherever possible; otherwise, for small samples, exact tests were used (e.g. Fisher’s exact test). Differences between cases (either schizophrenic or bipolar) and controls were examined. All statistical analyses were conducted using SAS software version 8.2. Note that the data from SMRI and HBTRC samples were pooled only for the polymorphism analysis.
ACKNOWLEDGEMENTS
Post-mortem DNA and RNA samples were donated by The Stanley Brain Collection courtesy of Drs Michael B. Knable, E. Fuller Torrey, Maree J. Webster and Robert H. Yolken. The authors express their gratitude to the Stanley Medical Research Institute for providing DNA and RNA samples. We thank Dr Francine Benes for providing the brain tissues from the Harvard Brain Tissue Resource Center, which is supported in part by PHS grant number MH/NS 31862. We thank Dr Nassir Ghaemi for critical review of this work. This work was supported by grants from the Iran University of Medical Sciences, Tehran Psychiatric Institute and Mental Health Research Center and NIMH (R25MH60485). S.T. is a Dolphin Trust Investigator of the Medical Foundation (Boston, MA, USA) and supported by a grant from the NIH (CA101773).
Footnotes
Conflict of Interest statement. Dr Stephen V Faraone receives financial support as a member of the speaker’s bureau and a consultant for Eli Lilly and Co., McNeil Pharmaceutical, Shire US, Inc. and Cephalon.
REFERENCES
- 1.Saddock B, Saddock V. Kaplan and Sadock’s Comprehensive Textbook of Psychiatry. Vol. 1. Lippincott Williams & Wilkins; Philadelphia, PA: 2005. pp. 236–272.pp. 1330–1395. [Google Scholar]
- 2.Abdolmaleky HM, Thiagalingam S, Wilcox M. Genetics and epigenetics in major psychiatric disorders: dilemmas, achievements, applications, and future scope. (Review) Am. J. Pharmacogenomics. 2005;5:149–160. doi: 10.2165/00129785-200505030-00002. [DOI] [PubMed] [Google Scholar]
- 3.Bird A. DNA methylation patterns and epigenetic memory. Genes Dev. 2002;16:6–21. doi: 10.1101/gad.947102. [DOI] [PubMed] [Google Scholar]
- 4.Abdolmaleky HM, Smith CL, Faraone SV, Shafa R, Stone W, Glatt SJ, Tsuang MT. Methylomics in psychiatry: modulation of gene–environment interactions may be through DNA methylation. Am. J. Med. Genet. B Neuropsychiatr. Genet. 2004;127:51–59. doi: 10.1002/ajmg.b.20142. [DOI] [PubMed] [Google Scholar]
- 5.Singal R, Ginder GD. DNA methylation. Blood. 1999;93:4059–4070. [PubMed] [Google Scholar]
- 6.Bestor TH. The DNA methyltransferases of mammals. Hum. Mol. Genet. 2000;9:2395–2402. doi: 10.1093/hmg/9.16.2395. [DOI] [PubMed] [Google Scholar]
- 7.Kim GD, Ni J, Kelesoglu N, Roberts RJ, Pradhan S. Co-operation and communication between the human maintenance and de novo DNA (cytosine-5) methyltransferases. EMBO J. 2002;21:4183–4195. doi: 10.1093/emboj/cdf401. [DOI] [PMC free article] [PubMed] [Google Scholar]
- 8.Fenech M. The role of folic acid and vitamin B12 in genomic stability of human cells. Mutat. Res. 2001;475:57–67. doi: 10.1016/s0027-5107(01)00079-3. [DOI] [PubMed] [Google Scholar]
- 9.Abdolmaleky HM, Cheng KH, Russo A, Smith CL, Faraone SV, Wilcox M, Shafa R, Glatt SJ, Nguyen G, Ponte JF, Thiagalingam S, Tsuang MT. Hypermethylation of the reelin (RELN) promoter in the brain of schizophrenic patients: a preliminary report. Am. J. Med. Genet. B Neuropsychiatr. Genet. 2005;134:60–66. doi: 10.1002/ajmg.b.30140. [DOI] [PubMed] [Google Scholar]
- 10.Grayson DR, Jia X, Chen Y, Sharma RP, Mitchel CP, Guidotti A, Costa E. Reelin promoter hypermethylation in schizophrenia. Proc. Natl Acad. Sci. USA. 2005;102:9341–9346. doi: 10.1073/pnas.0503736102. [DOI] [PMC free article] [PubMed] [Google Scholar]
- 11.Takahashi S, Ohtsuki T, Yu SY, Tanabe E, Yara K, Kamioka M, Matsushima E, Matsuura M, Ishikawa K, Minowa Y, et al. Significant linkage to chromosome 22q for exploratory eye movement dysfunction in schizophrenia. Am. J. Med. Genet. B Neuropsychiatr. Genet. 2003;123:27–32. doi: 10.1002/ajmg.b.10046. [DOI] [PubMed] [Google Scholar]
- 12.Potash JB, Zandi PP, Willour VL, Lan TH, Huo Y, Avramopoulos D, Shugart YY, MacKinnon DF, Simpson SG, McMahon FJ, et al. Suggestive linkage to chromosomal regions 13q31 and 22q12 in families with psychotic bipolar disorder. Am. J. Psychiatry. 2003;160:680–686. doi: 10.1176/appi.ajp.160.4.680. [DOI] [PubMed] [Google Scholar]
- 13.De Lisi LE, Shaw SH, Crow TJ, Shields G, Smith AB, Larach VW, Wellman N, Loftus J, Nanthakumar B, Razi K, et al. A genome-wide scan for linkage to chromosomal regions in 382 sibling pairs with schizophrenia or schizoaffective disorder. Am. J. Psychiatry. 2002;159:803–912. doi: 10.1176/appi.ajp.159.5.803. [DOI] [PubMed] [Google Scholar]
- 14.Lachman HM, Kelsoe JR, Remick RA, Sadovnick AD, Rapaport MH, Lin M, Pazur BA, Roe AM, Saito T, Papolos DF. Linkage studies suggest a possible locus for bipolar disorder near the velo-cardio-facial syndrome region on chromosome 22. Am. J. Med. Genet. 1997;74:121–128. doi: 10.1002/(sici)1096-8628(19970418)74:2<121::aid-ajmg2>3.0.co;2-x. [DOI] [PubMed] [Google Scholar]
- 15.Tenhunen J, Salminen M, Lundstrom K, Kiviluotot T, Savolainen R, Ulmanen I. Genomic organization of the human catechol O-methyltransferase gene and its expression from two distinct promoters. Eur. J. Biochem. 1994;223:1049–1059. doi: 10.1111/j.1432-1033.1994.tb19083.x. [DOI] [PubMed] [Google Scholar]
- 16.Chen X, Wang X, O’Neill AF, Walsh D, Kendler KS. Variants in the catechol-o-methyltransferase (COMT) gene are associated with schizophrenia in Irish high-density families. Mol. Psychiatry. 2004;9:962–967. doi: 10.1038/sj.mp.4001519. [DOI] [PubMed] [Google Scholar]
- 17.Lachman HM, Papolos DF, Saito T, Yu YM, Szumlanski CL, Weinshilboum RM. Human catechol-O-methyltransferase pharmacogenetics: description of a functional polymorphism and its potential application to neuropsychiatric disorders. Pharmacogenetics. 1996;6:243–250. doi: 10.1097/00008571-199606000-00007. [DOI] [PubMed] [Google Scholar]
- 18.Egan MF, Goldberg TE, Kolachana BS, Callicott JH, Mazzanti CM, Straub RE, Goldman D, Weinberger DR. Effect of COMT Val108/158 Met genotype on frontal lobe function and risk for schizophrenia. Proc. Natl Acad. Sci. USA. 2001;98:6917–6922. doi: 10.1073/pnas.111134598. [DOI] [PMC free article] [PubMed] [Google Scholar]
- 19.Blasi G, Mattay VS, Bertolino A, Elvevag B, Callicott JH, Das S, Kolachana BS, Egan MF, Goldberg TE, Weinberger DR. Effect of catechol-O-methyltransferase val158met genotype on attentional control. J. Neurosci. 2005;25:5038–5045. doi: 10.1523/JNEUROSCI.0476-05.2005. [DOI] [PMC free article] [PubMed] [Google Scholar]
- 20.Bruder GE, Keilp JG, Xu H, Shikhman M, Schori E, Gorman JM, Gilliam TC. Catechol-O-Methyltransferase (COMT) Genotypes and Working Memory: associations with differing cognitive operations. Biol. Psychiatry. 2005;58:901–907. doi: 10.1016/j.biopsych.2005.05.010. [DOI] [PubMed] [Google Scholar]
- 21.De Frias CM, Annerbrink K, Westberg L, Eriksson E, Adolfsson R, Nilsson LG. Catechol O-methyltransferase Val158Met polymorphism is associated with cognitive performance in nondemented adults. J. Cogn. Neurosci. 2005;17:1018–1025. doi: 10.1162/0898929054475136. [DOI] [PubMed] [Google Scholar]
- 22.Galderisi S, Maj M, Kirkpatrick B, Piccardi P, Mucci A, Invernizzi G, Rossi A, Pini S, Vita A, Cassano P, et al. Catechol- O-methyltransferase Val158Met polymorphism in schizophrenia: associations with cognitive and motor impairment. Neuropsychobiology. 2005;52:83–89. doi: 10.1159/000087096. [DOI] [PubMed] [Google Scholar]
- 23.Stefanis NC, van, Os J, Avramopoulos D, Smyrnis N, Evdokimidis I, Stefanis CN. Effect of COMT Val158Met polymorphism on the continuous performance test, identical pairs version: tuning rather than improving performance. Am. J. Psychiatry. 2005;162:1752–1754. doi: 10.1176/appi.ajp.162.9.1752. [DOI] [PubMed] [Google Scholar]
- 24.Kunugi H, Vallada HP, Sham PC, Hoda F, Arranz MJ, Li T, Nanko S, Murray RM, McGuffin P, Owen M, et al. Catechol-O-methyltransferase polymorphisms and schizophrenia: a transmission disequilibrium study in multiply affected families. Psychiatr. Genet. 1997;7:97–101. doi: 10.1097/00041444-199723000-00001. [DOI] [PubMed] [Google Scholar]
- 25.Shifman S, Bronstein M, Sternfeld M, Pisante A, Weizman A, Reznik I, Spivak B, Grisaru N, Karp L, Schiffer R, et al. COMT: a common susceptibility gene in bipolar disorder and schizophrenia. Am. J. Med. Genet. B Neuropsychiatr. Genet. 2004;128:61–64. doi: 10.1002/ajmg.b.30032. [DOI] [PubMed] [Google Scholar]
- 26.Glatt SJ, Faraone SV, Tsuang MT. Association between a functional catechol O-methyltransferase gene polymorphism and schizophrenia: meta-analysis of case–control and family-based studies. Am. J. Psychiatry. 2003;160:469–476. doi: 10.1176/appi.ajp.160.3.469. [DOI] [PubMed] [Google Scholar]
- 27.Williams HJ, Glaser B, Williams NM, Norton N, Zammit S, Macgregor S, Kirov GK, Owen MJ, O’donovan MC. No association between schizophrenia and polymorphisms in COMT in two large samples. Am. J. Psychiatry. 2005;162:1736–1738. doi: 10.1176/appi.ajp.162.9.1736. [DOI] [PubMed] [Google Scholar]
- 28.Munafo MR, Bowes L, Clark TG, Flint J. Lack of association of the COMT (Val158/108 Met) gene and schizophrenia: a meta-analysis of case–control studies. Mol. Psychiatry. 2005;10:765–770. doi: 10.1038/sj.mp.4001664. [DOI] [PubMed] [Google Scholar]
- 29.Massat I, Souery D, Del-Favero J, Nothen M, Blackwood D, Muir W, Kaneva R, Serretti A, Lorenzi C, Rietschel M, et al. Association between COMT (Val158Met) functional polymorphism and early onset in patients with major depressive disorder in a European multicenter genetic association study. Mol. Psychiatry. 2005;10:598–605. doi: 10.1038/sj.mp.4001615. [DOI] [PubMed] [Google Scholar]
- 30.Jia CX, Zhao ZT, Hu MH, Gao LJ, Wang XT. A paired case–control study on related factors to attempted suicide. Zhonghua Liu Xing Bing Xue Za Zhi. 2005;26:339–343. [PubMed] [Google Scholar]
- 31.Chen ZJ, Pikaard CS. Epigenetic silencing of RNA polymerase I transcription: a role for DNA methylation and histone modification in nucleolar dominance. Genes Dev. 1997;11:2124–2136. doi: 10.1101/gad.11.16.2124. [DOI] [PMC free article] [PubMed] [Google Scholar]
- 32.Fang MZ, Wang Y, Ai N, Hou Z, Sun Y, Lu H, Welsh W, Yang CS. Tea polyphenol (−)-epigallocatechin-3-gallate inhibits DNA methyltransferase and reactivates methylation-silenced genes in cancer cell lines. Cancer Res. 2003;63:7563–7570. [PubMed] [Google Scholar]
- 33.Bonsch D, Lenz B, Kornhuber J, Bleich S. DNA hypermethylation of the alpha synuclein promoter in patients with alcoholism. Neuroreport. 2005;16:167–170. doi: 10.1097/00001756-200502080-00020. [DOI] [PubMed] [Google Scholar]
- 34.Bonsch D, Lenz B, Fiszer R, Frieling H, Kornhuber J, Bleich S. Lowered DNA methyltransferase (DNMT-3b) mRNA expression is associated with genomic DNA hypermethylation in patients with chronic alcoholism. J. Neural Transm. 2006;113:1299–1304. doi: 10.1007/s00702-005-0413-2. [DOI] [PubMed] [Google Scholar]
- 35.Bleich S, Lenz B, Ziegenbein M, Beutler S, Frieling H, Kornhuber J, Bonsch D. Epigenetic DNA hypermethylation of the HERP gene promoter induces down-regulation of its mRNA expression in patients with alcohol dependence. Alcohol. Clin. Exp. Res. 2006;30:587–591. doi: 10.1111/j.1530-0277.2006.00068.x. [DOI] [PubMed] [Google Scholar]
- 36.Sasaki M, Kaneuchi M, Sakuragi N, Dahiya R. Multiple promoters of catechol O-methyltransferase gene are selectively inactivated by CpG hypermethylation in endometrial cancer. Cancer Res. 2003;63:3101–3106. [PubMed] [Google Scholar]
- 37.Goldstein JM, Goodman JM, Seidman LJ, Kennedy DN, Makris N, Lee H, Tourville J, Caviness VS, Jr, Faraone SV, Tsuang MT. Cortical abnormalities in schizophrenia identified by structural magnetic resonance imaging. Arch. Gen. Psychiatry. 1999;57:537–548. doi: 10.1001/archpsyc.56.6.537. [DOI] [PubMed] [Google Scholar]
- 38.Sharafi M. Comparison of classical and clozapine treatment on schizophrenia using positive and negative syndrome scale of schizophrenia (PANSS) and SPECT imaging. Int. J. Med. Sci. 2005;2:79–86. doi: 10.7150/ijms.2.79. [DOI] [PMC free article] [PubMed] [Google Scholar]
- 39.Akbarian S, Ruehl MG, Bliven E, Luiz LA, Peranelli AC, Baker SP, Roberts RC, Bunney WE, Jr, Conley RC, Jones EG, et al. Chromatin alterations associated with down-regulated metabolic gene expression in the prefrontal cortex of subjects with schizophrenia. Arch. Gen. Psychiatry. 2005;62:829–840. doi: 10.1001/archpsyc.62.8.829. [DOI] [PubMed] [Google Scholar]
- 40.Rosa A, Peralta V, Cuesta MJ, Zarzuela A, Serrano F, Martinez-Larrea A, Fananas L. New evidence of association between COMT gene and prefrontal neurocognitive function in healthy individuals from sibling pairs discordant for psychosis. Am. J. Psychiatry. 2004;161:1110–1112. doi: 10.1176/appi.ajp.161.6.1110. [DOI] [PubMed] [Google Scholar]
- 41.Wang GJ, Volkow ND, Fowler JS, Ding YS, Logan J, Gatley SJ, MacGregor RR, Wolf AP. Comparison of two pet radioligands for imaging extrastriatal dopamine transporters in human brain. Life Sci. 1995;57:PL187–PL191. doi: 10.1016/0024-3205(95)02099-5. [DOI] [PubMed] [Google Scholar]
- 42.Cheng KH, Ponte JF, Thiagalingam S. Elucidation of epigenetic inactivation of SMAD8 in cancer using targeted expressed gene display. Cancer Res. 2004;64:1639–1646. doi: 10.1158/0008-5472.can-03-2688. [DOI] [PubMed] [Google Scholar]
- 43.Kravariti E, Dixon T, Frith C, Murray R, McGuire P. Association of symptoms and executive function in schizophrenia and bipolar disorder. Schizophr. Res. 2005;74:221–231. doi: 10.1016/j.schres.2004.06.008. [DOI] [PubMed] [Google Scholar]
- 44.Tunbridge E, Burnet PW, Sodhi MS, Harrison PJ. Catechol-o-methyltransferase (COMT) and proline dehydrogenase (PRODH) mRNAs in the dorsolateral prefrontal cortex in schizophrenia, bipolar disorder, and major depression. Synapse. 2004;51:112–118. doi: 10.1002/syn.10286. [DOI] [PubMed] [Google Scholar]
- 45.Matsumoto M, Weickert CS, Beltaifa S, Kolachana B, Chen J, Hyde TM, Herman MM, Weinberger DR, Kleinman JE. Catechol O-methyltransferase (COMT) mRNA expression in the dorsolateral prefrontal cortex of patients with schizophrenia. Neuropsychopharmacology. 2003;28:1521–1530. doi: 10.1038/sj.npp.1300218. [DOI] [PubMed] [Google Scholar]
- 46.Murphy BC, O’Reilly RL, Singh SM. Site-specific cytosine methylation in S- COMT promoter in 31 brain regions with implications for studies involving schizophrenia. Am. J. Med. Genet. B Neuropsychiatr. Genet. 2005;133:37–42. doi: 10.1002/ajmg.b.30134. [DOI] [PubMed] [Google Scholar]
- 47.Mizoguchi K, Ishige A, Takeda S, Aburada M, Tabira T. Endogenous glucocorticoids are essential for maintaining prefrontal cortical cognitive function. J. Neurosci. 2004;24:5492–5499. doi: 10.1523/JNEUROSCI.0086-04.2004. [DOI] [PMC free article] [PubMed] [Google Scholar]
- 48.Huang YY, Simpson E, Kellendonk C, Kandel ER. Genetic evidence for the bidirectional modulation of synaptic plasticity in the prefrontal cortex by D1 receptors. Proc. Natl Acad. Sci. USA. 2004;101:3236–3241. doi: 10.1073/pnas.0308280101. [DOI] [PMC free article] [PubMed] [Google Scholar]
- 49.Chen WG, Chang Q, Lin Y, Meissner A, West AE, Griffith EC, Jaenisch R, Greenberg ME. Derepression of BDNF transcription involves calcium-dependent phosphorylation of MeCP2. Science. 2003;302:885–889. doi: 10.1126/science.1086446. [DOI] [PubMed] [Google Scholar]
- 50.Fatemi SH, Earle JA, McMenomy T. Reduction in Reelin immunoreactivity in hippocampus of subjects with schizophrenia, bipolar disorder and major depression. Mol. Psychiatry. 2000;5:654–663. doi: 10.1038/sj.mp.4000783. [DOI] [PubMed] [Google Scholar]
- 51.Guidotti A, Auta J, Davis JM, Di-Giorgi-Gerevini V, Dwivedi Y, Grayson DR, Impagnatiello F, Pandey G, Pesold C, Sharma R, et al. Decrease in reelin and glutamic acid decarboxylase67 (GAD67) expression in schizophrenia and bipolar disorder: a postmortem brain study. Arch. Gen. Psychiatry. 2000;57:1061–1069. doi: 10.1001/archpsyc.57.11.1061. [DOI] [PubMed] [Google Scholar]
- 52.Costa E, Davis J, Grayson DR, Guidotti A, Pappas GD, Pesold C. Dendritic spine hypoplasticity and downregulation of reelin and GABAergic tone in schizophrenia vulnerability. Neurobiol. Dis. 2001;8:723–742. doi: 10.1006/nbdi.2001.0436. [DOI] [PubMed] [Google Scholar]
- 53.Eastwood SL, Harrison PJ. Interstitial white matter neurons express less reelin and are abnormally distributed in schizophrenia: towards an integration of molecular and morphologic aspects of the neurodevelopmental hypothesis. Mol. Psychiatry. 2003;8:821–831. doi: 10.1038/sj.mp.4001399. [DOI] [PubMed] [Google Scholar]
- 54.Seamans JK, Yang CR. The principal features and mechanisms of dopamine modulation in the prefrontal cortex. (Review) Prog. Neurobiol. 2004;74:1–58. doi: 10.1016/j.pneurobio.2004.05.006. [DOI] [PubMed] [Google Scholar]
- 55.Caspi A, Moffitt TE, Cannon M, McClay J, Murray R, Harrington H, Taylor A, Arseneault L, Williams B, Braithwaite A, et al. Moderation of the effect of adolescent-onset cannabis use on adult psychosis by a functional polymorphism in the catechol-O-methyltransferase gene: longitudinal evidence of a gene X environment interaction. Biol. Psychiatry. 2005;57:1117–1127. doi: 10.1016/j.biopsych.2005.01.026. [DOI] [PubMed] [Google Scholar]
- 56.Shashi V, Keshavan MS, Howard TD, Berry MN, Basehore MJ, Lewandowski E, Kwapil TR. Cognitive correlates of a functional COMT polymorphism in children with 22q11.2 deletion syndrome. Clin. Genet. 2006;69:234–238. doi: 10.1111/j.1399-0004.2006.00569.x. [DOI] [PubMed] [Google Scholar]
- 57.Ohnishi T, Hashimoto R, Mori T, Nemoto K, Moriguchi Y, Iida H, Noguchi H, Nakabayashi T, Hori H, Ohmori M, et al. The association between the Val158Met polymorphism of the catechol-O-methyl transferase gene and morphological abnormalities of the brain in chronic schizophrenia. Brain. 2006;129:399–410. doi: 10.1093/brain/awh702. [DOI] [PubMed] [Google Scholar]
- 58.Crow TJ. Temporal lobe asymmetries as the key to the etiology of schizophrenia. (Review) Schizophr. Bull. 1990;6:433–443. doi: 10.1093/schbul/16.3.433. [DOI] [PubMed] [Google Scholar]
- 59.Rockstroh B, Clementz BA, Pantev C, Blumenfeld LD, Sterr A, Elbert T. Failure of dominant left-hemispheric activation to right-ear stimulation in schizophrenia. Neuroreport. 1998;9:3819–3822. doi: 10.1097/00001756-199812010-00010. [DOI] [PubMed] [Google Scholar]
- 60.Annett M. The theory of an agnosic right shift gene in schizophrenia and autism. Schizophr. Res. 1999;39:177–182. doi: 10.1016/s0920-9964(99)00072-9. [DOI] [PubMed] [Google Scholar]
- 61.Sassi RB, Brambilla P, Hatch JP, Nicoletti MA, Mallinger AG, Frank E, Kupfer DJ, Keshavan MS, Soares JC. Reduced left anterior cingulate volumes in untreated bipolar patients. Biol. Psychiatry. 2004;56:467–475. doi: 10.1016/j.biopsych.2004.07.005. [DOI] [PubMed] [Google Scholar]
- 62.Bertino L, Ruffini MC, Copani A, Bruno V, Raciti G, Cambria A, Nicoletti F. Growth conditions influence DNA methylation in cultured cerebellar granule cells. Dev. Brain Res. 1996;95:38–43. doi: 10.1016/0165-3806(96)00059-4. [DOI] [PubMed] [Google Scholar]
- 63.Cooney CA, Dave AA, Wolff GL. Maternal methyl supplements in mice affect epigenetic variation and DNA methylation of offspring. J. Nutr. 2002;132:2393S–2400S. doi: 10.1093/jn/132.8.2393S. [DOI] [PubMed] [Google Scholar]
- 64.Waterland RA, Lin JR, Smith CA, Jirtle RL. Post-weaning diet affects genomic imprinting at the insulin-like growth factor 2 (Igf2) locus. Hum. Mol. Genet. 2006;15:705–716. doi: 10.1093/hmg/ddi484. [DOI] [PubMed] [Google Scholar]
- 65.Horvath A, Morava E, Toth G, Czako M, Melegh B, Kosztolanyi G. Vascular diseases, spina bifida and schizophrenia in a single family associated with the heterozygote mutation of the heat-sensitive variant of methylenetetrahydrofolate reductase. Orv. Hetil. 2001;142:1445–1448. [PubMed] [Google Scholar]
- 66.Muntjewerff JW, van der Put N, Eskes T, Ellenbroek B, Steegers E, Blom H, Zitman F. Homocysteine metabolism and B-vitamins in schizophrenic patients: low plasma folate as a possible independent risk factor for schizophrenia. Psychiatry Res. 2003;121:1–9. doi: 10.1016/s0165-1781(03)00200-2. [DOI] [PubMed] [Google Scholar]
- 67.Reif A, Pfuhlmann B, Lesch KP. Homocysteinemia as well as methylenetetrahydrofolate reductase polymorphism are associated with affective psychoses. Prog. Neuropsychopharmacol. Biol. Psychiatry. 2005;29:1162–1168. doi: 10.1016/j.pnpbp.2005.06.027. [DOI] [PubMed] [Google Scholar]
- 68.Picker JD, Coyle JT. Do maternal folate and homocysteine levels play a role in neurodevelopmental processes that increase risk for schizophrenia? (Review) Harv. Rev. Psychiatry. 2005;13:197–205. doi: 10.1080/10673220500243372. [DOI] [PubMed] [Google Scholar]
- 69.Weaver IC, Cervoni N, Champagne FA, D’Alessio AC, Sharma S, Seckl JR, Dymov S, Szyf M, Meaney MJ. Epigenetic programming by maternal behavior. Nat. Neurosci. 2004;8:847–854. doi: 10.1038/nn1276. [DOI] [PubMed] [Google Scholar]
- 70.Moreau JL, Borgulya J, Jenck F, Martin JR. Tolcapone: a potential new antidepressant detected in a novel animal model of depression. Behav. Pharmacol. 1994;5:344–350. [PubMed] [Google Scholar]
- 71.Tunbridge EM, Bannerman DM, Sharp T, Harrison PJ. Catechol-o-methyltransferase inhibition improves set-shifting performance and elevates stimulated dopamine release in the rat prefrontal cortex. J. Neurosci. 2004;24:5331–5335. doi: 10.1523/JNEUROSCI.1124-04.2004. [DOI] [PMC free article] [PubMed] [Google Scholar]
- 72.Fava M, Rosenbaum JF, Kolsky AR, Alpert JE, Nierenberg AA, Spillmann M, Moore C, Renshaw P, Bottiglieri T, Moroz G, et al. Open study of the catechol-O-methyltransferase inhibitor tolcapone in major depressive disorder. J. Clin. Psychopharmacol. 1999;19:329–335. doi: 10.1097/00004714-199908000-00008. [DOI] [PubMed] [Google Scholar]
- 73.Moroz G, Magni G, Fava M. Update on ‘open study of the catechol-O-methyltransferase inhibitor tolcapone in major depressive disorder’. J. Clin. Psychopharmacol. 2000;19:329–335. doi: 10.1097/00004714-199908000-00008. [DOI] [PubMed] [Google Scholar]
- 74.Mattay VS, Goldberg TE, Fera F, Hariri AR, Tessitore A, Egan MF, Kolachana B, Callicott JH, Weinberger DR. Catechol O-methyltransferase val158-met genotype and individual variation in the brain response to amphetamine. Proc. Natl Acad. Sci. USA. 2003;100:6186–6191. doi: 10.1073/pnas.0931309100. [DOI] [PMC free article] [PubMed] [Google Scholar]
- 75.Szegedi A, Rujescu D, Tadic A, Muller MJ, Kohnen R, Stassen HH, Dahmen N. The catechol-O-methyltransferase Val108/158Met polymorphism affects short-term treatment response to mirtazapine, but not to paroxetine in major depression. Pharmacogenomics J. 2005;5:49–53. doi: 10.1038/sj.tpj.6500289. [DOI] [PubMed] [Google Scholar]
- 76.Tamminga CA, Schaffer MH, Smith RC, Davis JM. Schizophrenic symptoms improve with apomorphine. Science. 1978;200:567–568. doi: 10.1126/science.347574. [DOI] [PubMed] [Google Scholar]
- 77.Jaskiw GE, Popli AP. A meta-analysis of the response to chronic Ls-dopa in patients with schizophrenia: therapeutic and heuristic implications. (Review) Psychopharmacology (Berl.) 2004;171:365–374. doi: 10.1007/s00213-003-1672-y. [DOI] [PubMed] [Google Scholar]
- 78.Moghaddam B, Bunney BS. Acute effects of typical and atypical antipsychotic drugs on the release of dopamine from prefrontal cortex, nucleus accumbens, and striatum of the rat: an in vivo microdialysis study. J. Neurochem. 1990;54:1755–1760. doi: 10.1111/j.1471-4159.1990.tb01230.x. [DOI] [PubMed] [Google Scholar]
- 79.Bertolino A, Caforio G, Blasi G, De Candia M, Latorre V, Petruzzella V, Altamura M, Nappi G, Papa S, Callicott JH, et al. Interaction of COMT (Val(108/158)Met) genotype and olanzapine treatment on prefrontal cortical function in patients with schizophrenia. Am. J. Psychiatry. 2004;161:1798–1805. doi: 10.1176/ajp.161.10.1798. [DOI] [PubMed] [Google Scholar]
- 80.Tunbridge EM, Harrison PJ, Weinberger DR. Catechol-o-methyltransferase, cognition, and psychosis: Val(158)Met and beyond. Biol. Psychiatry. 2006;60:141–151. doi: 10.1016/j.biopsych.2005.10.024. [DOI] [PubMed] [Google Scholar]
- 81.Diaz-Asper CM, Weinberger DR, Goldberg TE. Catechol-O-methyltransferase polymorphisms and some implications for cognitive therapeutics. (Review) NeuroRx. 2006;3:97–105. doi: 10.1016/j.nurx.2005.12.010. [DOI] [PMC free article] [PubMed] [Google Scholar]
- 82.Frommer M, McDonald LE, Millar DS, Collis CM, Watt F, Grigg GW, Molloy PL, Paul CL. A genomic sequencing protocol that yields a positive display of 5-methylcytosine residues in individual DNA strands. Proc. Natl Acad. Sci. USA. 1992;89:1827–1831. doi: 10.1073/pnas.89.5.1827. [DOI] [PMC free article] [PubMed] [Google Scholar]
- 83.Herman JG, Graff JR, Myohanen S, Nelkin BD, Baylin SB. Methylation-specific PCR: a novel PCR assay for methylation status of CpG islands. Proc. Natl Acad. Sci. USA. 1996;93:9821–9826. doi: 10.1073/pnas.93.18.9821. [DOI] [PMC free article] [PubMed] [Google Scholar]
- 84.Lewin J, Schmitt AO, Adorjan P, Hildmann T, Piepenbrock C. Quantitative DNA methylation analysis based on four-dye trace data from direct sequencing of PCR amplificates. Bioinformatics. 2004;20:3005–3012. doi: 10.1093/bioinformatics/bth346. [DOI] [PubMed] [Google Scholar]
- 85.Derks S, Lentjes MH, Hellebrekers DM, de Bruine AP, Herman JG, van Engeland M. Methylation-specific PCR unraveled. (Review) Cell Oncol. 2004;26:291–299. doi: 10.1155/2004/370301. [DOI] [PMC free article] [PubMed] [Google Scholar]
- 86.Galm O, Herman JG. Methylation-specific polymerase chain reaction. Methods Mol. Med. 2005;113:279–291. doi: 10.1385/1-59259-916-8:279. [DOI] [PubMed] [Google Scholar]
- 87.Qian Q, Wang Y, Zhou R, Li J, Wang B, Glatt S, Faraone SV. Family-based and case-control association studies of catechol-O-methyltransferase in attention deficit hyperactivity disorder suggest genetic sexual dimorphism. Am. J. Med. Genet. B. Neuropsychiatr. Genet. 2003;118B:103–109. doi: 10.1002/ajmg.b.10064. [DOI] [PubMed] [Google Scholar]