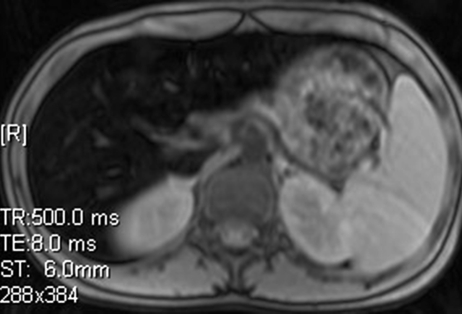
Figure 13c.
Iron overload imaging of the upper portion of the abdomen. Axial T2*-weighted GRE MR images (Siemens) (500/2.4–30; flip angle, 60°; bandwidth, 380 Hz/pixel; voxel size, 1.4 × 1.0 × 6.0 mm; FOV, 400 × 400 mm) acquired with TEs of 2.4 msec (a), 5.2 msec (b), 8.0 msec (c), and 10.8 msec (d) show progressive darkening of the liver with increasing TE, which is suggestive of iron overload.

