

Abstract
High-throughput oligonucleotide microarrays are commonly employed to investigate genetic disease, including cancer. The algorithms employed to extract genotypes and copy number variation function optimally for diploid genomes usually associated with inherited disease. However, cancer genomes are aneuploid in nature leading to systematic errors when using these techniques. We introduce a preprocessing transformation and hidden Markov model algorithm bespoke to cancer. This produces genotype classification, specification of regions of loss of heterozygosity, and absolute allelic copy number segmentation. Accurate prediction is demonstrated with a combination of independent experimental techniques. These methods are exemplified with affymetrix genome-wide SNP6.0 data from 755 cancer cell lines, enabling inference upon a number of features of biological interest. These data and the coded algorithm are freely available for download.
Keywords: Allelic, Cancer, Copy, Number, Somatic, Variation
1. INTRODUCTION
Cancer is a genetic disease arising when mutations of genes provide sufficient growth advantage to induce neoplastic transformation. For example, the p14arf and p16ink4a proteins coded from the CDKN2A tumor suppressor gene locus regulate RB1 and p53, controlling cell cycle and apoptosis, respectively. Homozygous deletion of this locus removes such control, promoting cell division and providing a selective advantage towards cancer. Tumor suppressor genes can also be inactivated by small single nucleotide mutations, such as p53 and PTEN, for example. The mutation inactivates 1 allele, and hemizygous deletion can remove the other allele to achieve functional inactivation. This results in loss of homozygosity (LOH) across the loci. Conversely, genomic amplification of ERBB2 contributes to uncontrolled positive growth signaling. The copy number status of cancer genes can serve as prognostic markers in various cancer types and, as in the case of ERBB2, can constitute an effective target for therapy. It is therefore imperative to be able to accurately assess cancer genomes for copy number changes and to accurately analyze this data taking into account the full information content available. Given that genotypes enable sample identification, microarrays offer an all encompassing solution.
These platforms perform genotyping experiments across millions of single nucleotide polymorphisms (SNPs) simultaneously, which produce copy number information in addition to SNP genotypes. Microarray technologies have a proven record for investigating genetic disease. For example, oligonucleotide microarrays produce both genotypes applied to genome-wide association studies (WTCCC, 2007) and to analyze population copy number variation (CNV) (McCarroll and others, 2006). These methods have also been successfully applied to examine CNV in cancers (Bignell and others, 2004; Weir and others, 2007). Modern platforms such as the affymetrix genome-wide SNP6.0 platform contain additional nonpolymorphic probes, designed to give greater genomic resolution of copy number in regions of lower SNP density. Alternative technologies such as molecular inversion probes (MIPs) (Wang, Li, and others, 2007) and SNP bead arrays (Collela and others, 2007; Wang, Moorhead, and others, 2007; Peiffer and others, 2007) have similarly been used and produce allelic ratios that can be used to infer “allelic” copy number. All these platforms require algorithms to infer these features.
Methods to extract copy number segmentation range from circular binary segmentation to hierarchical clustering (Huang and others, 2007; Laframboise and others, 2005, 2006; Li and others, 2008; Li and Zhu, 2007; Marioni and others, 2007; Olshen and others, 2004; Rueda and Diaz-Uriarte, 2007; Xing and others, 2007). Hidden Markov models (HMMs) have proven to be a particularly powerful tool in this field (Beroukhim and others, 2006; Colella and others, 2007; Fridlyand and others, 2004; Lamy and others, 2007; Scharpf and others, 2008; Shah and others, 2006; Stjernqvist and others, 2007) and have been used to identify LOH in addition to copy number segmentation. A comparison of various methods can be found in Baross and others (2007).
There are also a variety of methods by which SNP genotypes are classified (Affymetrix (I), 2006; Affymetrix (II), 2006; Carvalho and others, 2007; Giannoulatou and others, 2008; Lamy and others, 2006; Hua and others, 2007; Rabbee and Speed, 2006; Xiao and others, 2007).
Increasingly, methods are offering more integrated approaches to the 3-fold problem of estimating total copy number across the genome, finding the allelic ratio of segments, and identifying the true genotype of SNPs. These include the VanillaICE package from Scharpf and others (2008) that takes SNP data consisting of copy number intensities and genotypes (classified as heterozygous or homozygous) and implement an HMM. The states are designed to capture trends in copy number and do not resolve copy number into its allelic integer components. However, it is a generic method for SNP data requiring no training data that is quick to implement only requiring data from a single sample. The mixed model approach of Wang, Carvalho, and others, (2007) harnesses patterns of genotype clustering across multiple samples with a mixed model approach to infer both allelic copy number and genotype at individual SNPs. The calculations are done on a per SNP basis and treat consecutive SNPs independently. Accurate segmentation and break-point estimation will require smoothing (such as with an HMM), which can be critical in cancer studies when it is desirable to know if a particular break point is disrupting a gene's function, for example. The PennCNV (Wang, Li, and others, 2007) and Birdsuite packages (Korn and others, 2008) are the most comprehensive, providing allelic copy number and genotype inference for illumina SNP bead arrays and the affymetrix genome-wide SNP6.0 arrays, respectively.
This work considers the problems that arise when cancer data is analyzed using these methods and discusses bespoke techniques that may be applied to circumvent these issues. Specifically, cancer is frequency aneuploid in nature, which causes a systematic bias in preprocessing techniques utilized by these methods. This can also result in the misalignment of copy number states with these algorithms. This problem is explored in more detail in Section 2. We then introduce preprocessing and segmentation techniques suitable for cancer data. This method is validated using the affymetrix genome-wide SNP6.0 platform upon 460 wild-type and 755 cancer samples using a range of independent validation methods. A discussion completes the paper.
2. CANCER ASSOCIATED BIASES
Cancer samples are known to commonly exhibit aneuploidy (Rajagopalan and Lengaue, 2004) with many quadraploid and triploid samples, for example. Such variable ploidy affects the preprocessing used in such algorithms. More specifically, when seeding DNA to a microarray plate, the quantity is controlled by fixing the mass of DNA used. For noncancerous samples, cells in different samples have very similar amounts of DNA (i.e. from a diploid genome). A constant mass of DNA then effectively fixes the number of cells in each well on the plate, and the signals derived from each SNP allele are directly proportional to the allelic copy number for all samples. These signals are sensitive enough to distinguish allelic differences as seen in Figure 1(A), where the allelic intensities for a single SNP across a set of 461 normals clearly cluster according to the 3 wild-type genotype classes AA, AB, and BB. Such a structure is required for both Birdsuite and the mixed model approach of Wang, Carvalho, and others (2007). For example, Birdsuite correctly identified the heterozygous state across a sample of 108 cancer samples genotyped in only 70.13% of cases when compared to cDNA genotypes, far lower than figures reported using benchmarking with wild-type cells.
Fig. 1.

Allelic intensities for a single SNP across multiple samples. (A) The A allele intensity is plotted against the B allele intensity for each wild-type training sample at a single polymorphic probe. The MAP estimates of the linearly separated mean allelic intensities for genotypes AA, AB, and BB are indicated in red. (B) The same allelic intensities are plotted using the cancer samples. The significant reduction in clustering is evident.
Because the DNA delivered to each well in a microarray plate is controlled by total mass, a quadraploid sample will have half the number of cells seeded than a diploid sample. If 2 such samples have a region of identical copy number, then wells designed to hybridize within this region will produce half the signal in the quadraploid sample than from the diploid sample. In particular, the signal is no longer proportional to copy number, which will produce biases in any inference making this assumption. This adversely affects the clustering of the allelic copy number intensities by genotype. Figure 1(B) displays the allelic intensities for the same SNP as Figure 1(A) across a series of cancers, where the clustering is clearly compromised. Although this effect could in theory be corrected by incorporating the ploidy of the cancer, this is usually not a priori knowledge and would require spectral karyotyping (SKY) or flow sorting the samples to control the total number of cells.
The deviations in ploidy are readily observed via SKY. For example, using cancer cell line samples HCC1806 (diploid), HCC1187 (triploid), and ZR-75-30 (quadraploid), the average copy number of each chromosome was calculated using SKY (Howarth and others, 2008), and using Birdsuite upon SNP6.0 array data. The results can be seen in Figure 2 (and Supplementary Figure 2, available at Biostatistics online) where Birdsuite does not capture differences in ploidy revealed by SKY.
Fig. 2.

Genome-wide copy number estimates of diploid, triploid, and quadraploid samples HCC1806, HCC1187, and ZR-75-30, respectively. Copy number estimates are obtained using SKY (dashed), Birdsuite (red), and PICNIC (green).
These data show that although current integrative methods such as those of Scharpf and others (2008), Wang, Carvalho, and others (2007) and Korn and others (2008) work well for integrated copy number analyses in wild-type cells, these methods are less applicable to cancer samples and exhibit greatest error where the ploidy departs from normal. A bespoke preprocessing procedure that captures the departure from the normal clustering seen in Figure 1(B), and a segmentation routine that can calibrate to unusual ploidy, and ultimately provide accurate integrated allelic copy number and genotyping analyses in cancer, is thus desirable.
To this end, we next introduce the 2 stage procedure predict integral copy numbers in cancer (PICNIC). We first introduce a preprocessing step that utilizes the genotype structure observed by others (Wang, Carvalho, and others, 2007; Korn and others, 2008) in normal tissues to convert the raw cancer data into copy number and genotype intensities. We then introduce a Bayesian HMM to identify segments of fixed integer allelic copy number using the data produced by the preprocessing step. We also use the model to classify the SNPs into their complex cancer genotypes.
3. CANCER BESPOKE METHODS
The preprocessing is essentially composed of 2 steps; a microarray plate correction and a normalization step. The segmentation step then follows.
Across the sample set, the total probe intensity from each array varies substantially due to different running times and conditions in the experimental process. In order to reduce this “microarray plate” variation, we simply dividing all intensities by the total microarray signal from each sample.
The normalization step is a correction for the probe variation observed in Figure 1(B). We first need to gain an understanding of the wild-type behavior at each probe. This is achieved by fitting a mixture of bivariate normal distribution to the 3 clusters observed in Figure 1(A). A Bayesian approach helps with this fitting where the clustering structure is less clear with less informative SNPs. This results in maximum a priori (MAP) estimates (Ag, Bg) representing the mean cluster positions corresponding to genotypes g ∈ {AA, AB, BB}. These are assumed to align linearly so that,
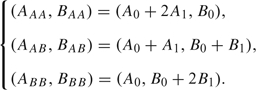 |
(3.1) |
We next utilized this information to transform cancer data into a copy number intensity rct and a genotype intensity ϑct. We would like any point (xctA, xctB) on the line passing through the 3 genotype clusters to have a copy number intensity of unity. We first linearly transform the intensities to map clusters AA, AB, and BB to mean positions (1,3), (2,2), and (3,1), and map the residual intensity loci (A0, B0) to (1,1). The genotype intensity ϑct is then defined to be the (normalized) angle from the origin to the transformed cancer intensities. We then define transformation,
| (3.2) |
This completes the preprocessing. Examples can be seen in Figures 3(A) and (B), where copy number and genotype intensities for genomic regions of cancer cell line HCC1187 are displayed. The combination of copy number and genotype intensities clearly reveal the full range of allelic copy numbers present in the samples.
Fig. 3.

Absolute copy number, genotype intensity, and break-point likelihoods for cancer cell lines HCC1187. Each plot contains 3 sections. First are copy number intensities, followed by genotype intensities. Associated genotypes are indicated. Green and blue lines indicate total and minor estimated copy number. Black and red lines represent heterozygous and homozygous segments. Finally, the likelihoods of state change are plotted. The horizontal scale is genomic position in megabases. Vertical scales represent chromosomal copy number. (A and B) derive from chromosomes 14 and 19, respectively.
The final step involves the segmentation and genotyping of the data, which was achieved using a Bayesian HMM. Such methods have previously been successfully applied to allelic copy number such as with PennCNV and Birdsuite. The states used tend to encompass a large range of genotypes observed in genetic disease. However, cancer does not exhibit such a wide range, and the HMM requires a specific copy number state space relevant to cancer. Specifically, prior to the formation of a somatic copy number variant, there is 1 copy of each parental wild-type segment, and the genotypes of the SNPs within the region are AA, AB, or BB. After the copy number variant is formed, the segment contains g and h − g copies of each parental segment (h segments in total), ordered such that g ≤ h − g. Here, g and h − g denote the “minor” and “major” copy numbers, respectively. For a segment of the genome of fixed total copy number h, there are  possible copy number states, indexed by
 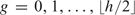 . For each state pair (g, h), we get 4 genotypes; {A × h}, {A ×(h − g), B × g}, {A × g, B ×(h − g)}, or {B × h}. These genotypes can coincide where LOH is present (g = 0) or we have an even number of chromosomes (g = h/2). This results in between 1 and 4 possible genotypes within a segment of copy number state (g,h). This information is summarized in Table 1, examples of which can be seen in Figure 3.
Table 1.
Genotype classes by copy number states. A description of possible genotypes for the first few minor and major copy numbers
| Total copy number (h) | Number of genotype classes | Number of minor alleles (g) 0 (LOH) | 1 | 2 |
| 0 | 1 | DEL | – | – |
| 1 | 1 | {A,B} | – | – |
| 2 | 2 | {AA,BB} | {AA,AB,BB} | – |
| 3 | 2 | {AAA,BBB} | {AAA,AAB,ABB,BBB} | – |
| 4 | 3 | {AAAA,BBBB} | {AAAA,AAAB,ABBB,BBBB} | {AAAA,AABB,BBBB} |
| 5 | 3 | {AAAAA,BBBBB} | {AAAAA,AAAAB, ABBBB,BBBBB} | {AAAAA,AAABB, AABBB,BBBBB} |
The Bayesian HMM was fitted with the Baum–Welch algorithm and segmented with the Viterbi algorithm (Rabiner, 1989). This process is sensitive to the initial seeding of the parameters, which requires a heuristic approach to accurately calibrate copy number with copy number intensity. The forward–backward equations can then be used to infer several features of interest including genotype classification and to associate confidence to break-point estimates. Full details of these methods can be found in Supplementary Text 1, available at Biostatistics online.
4. VALIDATION
In order to assess performance, we examined the HMM's prediction of deletions, LOH, amplifications, break points, copy number estimation, and genotyping using cancer cell lines cultured from a variety of tissue types. We also benchmarked these results against Birdsuite. These are considered below and summarized in Table 2. Further details can be found in Supplementary Table 1, available at Biostatistics online.
Table 2.
Validation methods. Results are summarized for validation of homozygous deletions, genotypes, LOH, copy number, break points, and amplifications. Statistics used include true positive and false positive rates (TPR, FPR), the percentage of correct calls and the mean error
| Data type | Validation set | Test set | Statistic | PICNIC | Birdsuite |
| Copy number | SKY | HCC1806(diploid) | % Correct | 65.35% | 59.83% |
| Copy number | SKY | HCC1187(triploid) | % Correct | 80.56% | 52.55% |
| Copy number | SKY | ZR-75-30(quadraploid) | % Correct | 77.67% | 6.43% |
| Homozygous deletions | confirmatory PCR for 7 known TSGs | 102 cell lines | TPR (FPR) | 77.55% (0.15%) | 59.18% (0.15%) |
| Genotypes | cDNA hom genotyping | 108 cell lines | % Correct | 96.45% | 70.13% |
| LOH | 400 microsatellite markers | 755 cell lines | TPR (FPR) | 58.20% (5.34%) | NA |
| Break points | SKY | HCC1806(diploid) | TPR | 55.41% | 56.76% |
| Break points | SKY | HCC1187(triploid) | TPR | 46.81% | 48.94% |
| Break points | SKY | ZR-75-30(quadraploid) | TPR | 75.51% | 63.27% |
| Amplicons | qPCR of GLO1 amplified cluster | 58 cell lines | Mean error | 5.44% | 11.51% |
The predicted copy number of PICNIC and Birdsuite was assessed by comparing results to copy numbers obtained using SKY (Howarth and others, 2008). This was determined for HCC1806 (diploid), HCC1187 (triploid), and ZR-75-30 (quadraploid). The genomic extent (Mb) of correctly and incorrectly predicted copy numbers were then determined, giving 65.35%, 80.56%, and 77.67% for PICNIC, respectively. The values for Birdsuite are 59.83%, 52.55%, and 6.43%, respectively. Although results for the diploid sample are similar, the improvement for the more complex genomes using the cancer specific software is clear, as can be seen in Figure 2. We also used the break points estimated by Howarth and others (2008) in these 3 samples to determine how many were detected using PICNIC and Birdsuite. PICNIC identified 55.41%, 46.81%, and 75.51%, and Birdsuite was comparible identifying 56.76%, 48.94%, and 63.27%, respectively.
To investigate specificity and sensitivity of deletion detection, 7 known tumor suppressor genes (CDKN2C, CDKN2A, PTEN, RB1, MAP2K4, SMAD4, and STK11) were screened for the presence of deletions using PICNIC and Birdsuite. The same genes were also screened using multiplex polymerase chain reaction (PCR) with a probe per exon. These 2 independent methods were then compared across 102 cell lines. A total of 38/49 (77.55%) deletions were detected by PICNIC, showing excellent sensitivity and specificity. This reduces to 59.18% for Birdsuite.
In order to test the performance of LOH prediction, the repeat lengths of both alleles of approximately 400 microsatellite markers are derived. As both alleles derive from a wide choice of counts, an identical pair of repeat lengths is indicative of LOH and was designated as so. The HMM LOH status at each marker was compared to the microsatellite LOH status. Excellent specificity was shown, with only 4989/93410 (5.34%) markers with 2 distinct microsatellite repeat lengths being identified as LOH by PICNIC. Although sensitivity was lower, with 40970/70391 (58.2%) agreement, this is consistent with the rate that markers produced identical repeat length alleles (32.7% from normal samples). Segmental LOH status could not be obtained from Birdsuite.
To test the performance of amplification prediction, quantitative PCR (qPCR) with 20 probes was implemented comparing the copy number of a commonly amplified gene cluster containing GLO1 to the reference control gene β-actin. The relative copy number of this cluster to the reference gene was also calculated from the predicted copy number states for both methods and results compared. The average relative copy number across this region differed from qPCR by 5.44% and 11.51% using PICNIC and Birdsuite, respectively.
PICNIC provides genotype likelihoods for all polymorphic probes. Maximum likelihood was then used to determine whether the probe was heterozygous or specify the homozygous allele. To validate the classifications, cDNA of 20 probes were genotyped across 108 cell lines. A total of 1406/1448 (97.10%) homozygous SNPs were correctly identified as homozygous and 441/467 (94.43%) as heterozygous. These figures drop to 78.12% and 45.27%, respectively, for Birdsuite.
In summary, although using generalized copy number software upon cancer data can lead to systematic errors which are most apparent with anueploid genomes, techniques bespoke to tumor data, such as PICNIC, provide an effective means by which these biases can be overcome and provide accurate information regarding allelic integer copy number and genotype information in cancer.
5. DISCUSSION
Methods to investigate the genotypes and CNV in tumor samples are an important component of cancer genomics. Although oligonucleotide platforms such as affymetrix genome-wide SNP6.0 arrays have been successfully applied to wild-type genetics with integrative algorithms such as VanillaICE, that of Wang, Carvalho, and others (2007), and Birdsuite, the aneuploid nature of cancer produces biases that require more bespoke methods. We have introduced an algorithm that successfully caters for these effects. These techniques allow a complete portrait of integral allelic copy number in cancer to be derived for the full range of aneuploidy observed in cancer.
This process (PICNIC) was implemented with a training set of 461 normal samples and 755 cancer cell lines from a wide spectrum of tissue types and histologies using data obtained through affymetrix genome-wide SNP6.0 array technology and implemented with Matlab. The method was shown to accurately predict integer major and minor copy numbers, complex cancer genotypes, homozygous deletion, amplification, and regions of LOH with good break-point accuracy. This allows detection of subtle changes such as copy neutral LOH and hemizygous deletion providing a more complete profile of CNV in cancer genomes.
The preprocessing training steps were implemented using 461 normal samples and took approximately 3 Ghz × 100 h computing time to complete for the affymetrix genome-wide SNP 6.0 array. This step only needs to be done once and the renormalization can then be implemented quickly on many samples. The segmentation step was implemented for the 1216 wild-type and cancer samples in approximately 3 Ghz × 3 h running time per sample (a multinode farm was used in application), with a maximum segmented copy number of 15. This time could be reduced by dropping either the maximum segmented copy number or dropping the Baum–Welch optimization and just using Viterbi segmentation with seeded parameters. The running time scales linearly with the number of samples and the number of probes but scales quadratically with the maximum segmented copy number.
Data quality was occasionally compromised due to various factors. Experimental protocols or conditions could produce noisy data, readily fixed by optimization, or repeat runs. Contaminated samples produce spurious results, Supplementary Figure 1, available at Biostatistics online exhibiting a putative example, but such cases can be resourced. Although cell lines are typically composed of a single outgrown clone, there is some evidence that cell lines occasionally contain multiple subclones with different copy numbers in different genomic regions. Regions that contain distinct copy number by clone will likely produce unexpected (nonintegral) copy number intensities. Such mosaicism provides a difficult problem for the entire field of CNV in cancer. Chromosome 11 of sample HCC1187 is a probable example of this (see Figure 1(B) in Supplementary Text 1, available at Biostatistics online), where the mean copy number intensity for this chromosome is between the mean values associated with copy numbers of 3 and 4). Genotype intensities were also affected, reproducing the mean signal from all present clones. Finally, we note that this algorithm has only been applied to cell lines, and that primary samples with normal tissue contamination or containing multiple dominant clones may not segment as well. We note that the preprocessing step is suitable for all samples, however, irrespective of any mosaicism or normal contamination that may be present.
These experiments have produced a significant volume of invaluable data, aiding the identification of candidate tumor suppressor genes, oncogenes, and gene fusions. The segmented data of all analyzed samples can be viewed at http://www.sanger.ac.uk/cgi-bin/genetics/CGP/cghviewer/CghHome.cgi. The raw data (*.cel files) are an open resource available at www.sanger.ac.uk/genetics/CGP/Archive/. The algorithm was coded in (UNIX) Matlab and both the preprocessing and segmentation algorithms are available under a free Berkeley software distribution license from www.sanger.ac.uk/genetics/CGP/Software/.
SUPPLEMENTARY MATERIAL
Supplementary material is available at http://biostatistics.oxfordjournals.org.
FUNDING
Funding to pay the Open Access publication charges for this article was provided by the Wellcome Trust.
Supplementary Material
Acknowledgments
We would like to thank Todd Golub for the use of genotyped cDNA. We also thank Chris Barnes, Karen Howarth, Paul Edwards and the referees for useful discussions. These studies were funded by the Wellcome Trust. Conflict of Interest: None declared.
References
- Affymetrix (I) Technical Report. 2006. BRLMM: an improved genotype calling method for the genechip human mapping 500k array set. Affymetrix, Inc. White Paper http://www.affymetrix.com/support/technical/whitepapers/brlmm_whitepaper.pdf. [Google Scholar]
- Affymetrix (II) BRLMM–P: a genotype calling method for the SNP 5.0 array. Technical Report. 2006 Affymetrix, Inc. White Paper http://www.affymetrix.com/support/technical/whitepapers/brlmmp_whitepaper.pdf. [Google Scholar]
- Baross A, Delaney A, Li HI, Nayar T, Flibotte S, Qian H, Chan S, Asano J, Ally A, Cao M and others. Assessment of algorithms for high throughput detection of genomic copy number variation in oligonucleotide microarray data. BMC Bioinformatics. 2007;8:368. doi: 10.1186/1471-2105-8-368. [DOI] [PMC free article] [PubMed] [Google Scholar]
- Beroukhim R, Lin M, Park Y, Hao K, Zhao X, Garraway LA, Fox EA, Hochberg EP, Mellinghoff IK, Hofer MD and others. Inferring loss-of-heterozygosity from unpaired tumors using high-density oligonucleotide SNP arrays. PLoS Computational Biology. 2006 doi: 10.1371/journal.pcbi.0020041. 2, e41. [DOI] [PMC free article] [PubMed] [Google Scholar]
- Bignell GR, Huang J, Greshock J, Watt S, Butler A, West S, Grigorova M, Jones KW, Wei W, Stratton MR and others. High-resolution analysis of DNA copy number using oligonucleotide microarrays. Genome Research. 2004;14:287–295. doi: 10.1101/gr.2012304. [DOI] [PMC free article] [PubMed] [Google Scholar]
- Carvalho B, Bengtsson H, Speed TP, Irizarry RA. Exploration, normalization, and genotype calls of high-density oligonucleotide SNP array data. Biostatistics. 2007;8:485–499. doi: 10.1093/biostatistics/kxl042. [DOI] [PubMed] [Google Scholar]
- Colella S, Yau C, Taylor JM, Mirza G, Butler H, Clouston P, Bassett AS, Seller A, Holmes CC, Ragoussis J. QuantiSNP: an objective Bayes hidden-Markov model to detect and accurately map copy number variation using SNP genotyping data. Nucleic Acids Research. 2007;35:2013–2025. doi: 10.1093/nar/gkm076. [DOI] [PMC free article] [PubMed] [Google Scholar]
- Fridlyand J, Snijders A, Pinkel D, Albertson D, Jain A. Hidden Markov models approach to the analysis of array CGH data. Journal of Multivariate Analysis. 2004;90:132–153. [Google Scholar]
- Giannoulatou E, Yau C, Colella S, Ragoussis J, Holmes CC. GenoSNP: a variational Bayes within-sample SNP genotyping algorithm that does not require a reference population. Bioinformatics. 2008;24:2209–2214. doi: 10.1093/bioinformatics/btn386. [DOI] [PubMed] [Google Scholar]
- Howarth KD, Blood KA, Ng BL, Beavis JC, Chua Y, Cooke SL, Raby S, Ichimura K, Collins VP, Carter NP and others. Array painting reveals a high frequency of balanced translocations in breast cancer cell lines that break in cancer-relevant genes. Oncogene. 2008;27:3345–3359. doi: 10.1038/sj.onc.1210993. [DOI] [PMC free article] [PubMed] [Google Scholar]
- Hua J, Craig DW, Brun M, Webster J, Zismann V, Tembe W, Joshipura K, Huentelman MJ, Dougherty ER, Stephan DA. SNiPer-HD: improved genotype calling accuracy by an expectation-maximization algorithm for high-density SNP arrays. Bioinformatics. 2007;23:57–63. doi: 10.1093/bioinformatics/btl536. [DOI] [PubMed] [Google Scholar]
- Huang J, Wei W, Chen J, Zhang J, Liu G, Di X, Mei R, Ishikawa S, Aburatani H, Jones KW and others. CARAT: a novel method for allelic detection of DNA copy number changes using high density oligonucleotide arrays. BMC Bioinformatics. 2007;7:83. doi: 10.1186/1471-2105-7-83. [DOI] [PMC free article] [PubMed] [Google Scholar]
- Korn JM, Kuruvilla FG, Mccarroll SA, Wysoker A, Nemesh J, Cawley S, Hubbell E, Veitch J, Collins PJ, Darvishi K and others. Integrated genotype calling and association analysis of SNPs, common copy number polymorphisms and rare CNVs. Nature Genetics. 2008;40:1253–1260. doi: 10.1038/ng.237. [DOI] [PMC free article] [PubMed] [Google Scholar]
- Laframboise T, Harrington D, Weir BA. PLASQ: a generalized linear model-based procedure to determine allelic dosage in cancer cells from SNP array data. Biostatistics. 2006;8:323–336. doi: 10.1093/biostatistics/kxl012. [DOI] [PubMed] [Google Scholar]
- Laframboise T, Weir BA, Zhao X, Beroukhim R, Li C, Harrington D, Sellers WR, Meyerson M. Allele-specific amplification in cancer revealed by SNP array analysis. PLoS Computtional Biology. 2005 doi: 10.1371/journal.pcbi.0010065. 1, e65. [DOI] [PMC free article] [PubMed] [Google Scholar]
- Lamy P, Andersen CL, Dyrskjot L, Torring N, Wiuf C. A hidden Markov model to estimate population mixture and allelic copy-numbers in cancers using affymetrix SNP arrays. BMC Bioinformatics. 2007;8:434. doi: 10.1186/1471-2105-8-434. [DOI] [PMC free article] [PubMed] [Google Scholar]
- Lamy P, Andersen CL, Wikman FP, Wiuf C. Genotyping and annotation of affymetrix SNP arrays. Nucleic Acids Research. 2006 doi: 10.1093/nar/gkl475. 34, e100. [DOI] [PMC free article] [PubMed] [Google Scholar]
- Li C, Beroukhim R, Weir BA, Winkler W, Garraway LA, Sellers WR, Meyerson M. Major copy proportion analysis of tumour samples using SNP arrays. BMC Bioinformatics. 2008;9:204. doi: 10.1186/1471-2105-9-204. [DOI] [PMC free article] [PubMed] [Google Scholar]
- Li Y, Zhu J. Analysis of array CGH data for cancer studies using fused quantile regression. Bioinformatics. 2007;23:2470–2476. doi: 10.1093/bioinformatics/btm364. [DOI] [PubMed] [Google Scholar]
- Marioni JC, Thorne NP, Valsesia A, Fitzgerald T, Redon R, Fiegler H, Andrews TD, Stranger BE, Lynch AG, Dermitzakis ET and others. Breaking the waves: improved detection of copy number variation from microarray-based comparative genomic hybridization. Genome Biology. 2007;8:R228. doi: 10.1186/gb-2007-8-10-r228. [DOI] [PMC free article] [PubMed] [Google Scholar]
- Mccarroll SA, Hadnott TN, Perry GH, Sabeti PC, Zody MC, Barrett JC, Dallaire S, Gabriel SB, Lee C, Daly MJ and others. Common deletion polymorphisms in the human genome. Nature Genetics. 2006;38:86–92. doi: 10.1038/ng1696. [DOI] [PubMed] [Google Scholar]
- Olshen AB, Venkatraman ES, Lucito R, Wigler M. Circular binary segmentation for the analysis of array-based DNA copy number data. Biostatistics. 2004;5:557–572. doi: 10.1093/biostatistics/kxh008. [DOI] [PubMed] [Google Scholar]
- Peiffer DA, Le JM, Steemers FJ, Chang W, Jenniges T, Garcia F, Haden K, Li J, Shaw CA, Belmont J and others. High-resolution genomic profiling of chromosomal aberrations using infinium whole-genome genotyping. Genome Research. 2007;16:1136–1148. doi: 10.1101/gr.5402306. [DOI] [PMC free article] [PubMed] [Google Scholar]
- Rabbee N, Speed TP. A genotype calling algorithm for affymetrix SNP arrays. Bioinformatics. 2006;22:7–12. doi: 10.1093/bioinformatics/bti741. [DOI] [PubMed] [Google Scholar]
- Rabiner LR. A tutorial on hidden Markov models and selected applications in speech recognition. Proceedings of the IEEE. 1989;77:257–286. [Google Scholar]
- Rajagopalan H, Lengaue C. Aneuploidy and cancer. Nature. 2004;432:338–341. doi: 10.1038/nature03099. [DOI] [PubMed] [Google Scholar]
- Rueda OM, Díaz-uriarte R. Flexible and accurate detection of genomic copy-number changes from aCGH. PLoS Computational Biology. 2007 doi: 10.1371/journal.pcbi.0030122. 3, e122. [DOI] [PMC free article] [PubMed] [Google Scholar]
- Scharpf RB, Parmigiani G, Pevsner J, Ruczinski I. Hidden Markov models for the assessment of chromosomal alterations using high-throughput SNP arrays. The Annals of Applied Statistics. 2008;2:687–713. doi: 10.1214/07-AOAS155. [DOI] [PMC free article] [PubMed] [Google Scholar]
- Shah SP, Xuan X, Deleeuw RJ, Khojasteh M, Lam WL, Ng R, Murphy KP. Integrating copy number polymorphisms into array CGH analysis using a robust HMM. Bioinformatics. 2006;22:e431–e439. doi: 10.1093/bioinformatics/btl238. [DOI] [PubMed] [Google Scholar]
- Stjernqvist S, Ryden T, Skold M, Staaf J. Continuous-index hidden Markov modelling of array CGH copy number data. Bioinformatics. 2007;23:1006–1014. doi: 10.1093/bioinformatics/btm059. [DOI] [PubMed] [Google Scholar]
- Wang K, Li M, Hadley D, Liu R, Glessner J, Grant SFA, Hakonarson H, Bucan M. PennCNV: an integrated hidden Markov model designed for high-resolution copy number variation detection in whole-genome SNP genotyping data. Genome Research. 2007;17:1665–1674. doi: 10.1101/gr.6861907. [DOI] [PMC free article] [PubMed] [Google Scholar]
- Wang W, Carvalho B, Miller ND, Pevsner J, Chakravarti A, Irizarry RA. Estimating genome-wide copy number using allele-specific mixture models. Journal of Computational Biology. 2008;15:857–866. doi: 10.1089/cmb.2007.0148. [DOI] [PMC free article] [PubMed] [Google Scholar]
- Wang Y, Moorhead M, Karlin-neumann G, Wang N, Ireland J, Lin S, Chen C, Heiser L, Chin K, Esserman L and others. Performance of molecular inversion probes (MIP) in allele copy number determination. Genome Biology. 2007;8:R246. doi: 10.1186/gb-2007-8-11-r246. [DOI] [PMC free article] [PubMed] [Google Scholar]
- Weir BA, Woo MS, Getz G, Perner S, Ding L, Beroukhim R, Lin WM, Province MA, Kraja A, Johnson LA and others. Characterizing the cancer genome in lung adenocarcinoma. Nature. 2007;450:893–898. doi: 10.1038/nature06358. [DOI] [PMC free article] [PubMed] [Google Scholar]
- Wellcome Trust Case Control Consortium (WTCCC) Genome-wide association study of 14,000 cases of seven common diseases and 3,000 shared controls. Nature. 2007;447:661–678. doi: 10.1038/nature05911. [DOI] [PMC free article] [PubMed] [Google Scholar]
- Xiao Y, Segal MR, Yang YH, Yeh R. A multi-array multi-SNP genotyping algorithm for affymetrix SNP microarrays. Bioinformatics. 2007;23:1459–1467. doi: 10.1093/bioinformatics/btm131. [DOI] [PubMed] [Google Scholar]
- Xing B, Greenwood CMT, Bull SB. A hierarchical clustering method for estimating copy number variation. Biostatistics. 2007;8:632–653. doi: 10.1093/biostatistics/kxl035. [DOI] [PubMed] [Google Scholar]
Associated Data
This section collects any data citations, data availability statements, or supplementary materials included in this article.