


Abstract
In an attempt to elucidate the underlying longevity-promoting mechanisms of mutants lacking SCH9, which live three times as long as wild type chronologically, we measured their time-course gene expression profiles. We interpreted their expression time differences by statistical inferences based on prior biological knowledge, and identified the following significant changes: (i) between 12 and 24 h, stress response genes were up-regulated by larger fold changes and ribosomal RNA (rRNA) processing genes were down-regulated more dramatically; (ii) mitochondrial ribosomal protein genes were not up-regulated between 12 and 60 h as wild type were; (iii) electron transport, oxidative phosphorylation and TCA genes were down-regulated early; (iv) the up-regulation of TCA and electron transport was accompanied by deep down-regulation of rRNA processing over time; and (v) rRNA processing genes were more volatile over time, and three associated cis-regulatory elements [rRNA processing element (rRPE), polymerase A and C (PAC) and glucose response element (GRE)] were identified. Deletion of AZF1, which encodes the transcriptional factor that binds to the GRE element, reversed the lifespan extension of sch9Δ. The significant alterations in these time-dependent expression profiles imply that the lack of SCH9 turns on the longevity programme that extends the lifespan through changes in metabolic pathways and protection mechanisms, particularly, the regulation of aerobic respiration and rRNA processing.
INTRODUCTION
The ageing process in organisms ranging from yeast to humans is complex, yet it is partially conserved from yeast to mammals (1). Researchers have been making efforts to understand the biological mechanisms of ageing from various perspectives and have proposed many theories including the free radical (2), the stress (3), the disposable soma (4), the accumulated mutation (5), the mitochondrial (6), the programmed longevity and the programmed and altruistic ageing theories of ageing (7). Since ageing is the composite effect of many factors, it is our belief that these theories and hypotheses may be interlinked. This perspective is consistent with the network theory of ageing (8), where a systems biology view was taken to integrate several ageing theories to model the ageing processes (9,10).
Extensive experimental studies regarding these ageing theories exist in the literature, particularly in the context of Saccharomyces cerevisiae (11,12). The unicellular model organism, budding yeast, is a good candidate to study ageing process due to its short life cycle, rich literature of genetic studies and relatively complete genomic databases. In S. cerevisiae, two different models are used to measure longevity: (i) the replicative lifespan (RLS), defined as the number of daughter cells generated by a single mother cell before senescence (13); and (ii) the chronological lifespan (CLS), defined as the survival time of a population of non-dividing yeast in the post-diauxic and stationary phase (14,15).
Calorie restriction (CR) promotes longevity in a variety of organisms, including yeast, worms, flies and rats (1,16). In S. cerevisiae, CR increases lifespan in both chronological and replicative ageing models. The Sch9, Ras2/cAMP/PKA and TOR signalling pathways play important roles in CR-modulated ageing (17,18). Growing evidences support that these pathways are partially conserved from yeast to mammals (1,17). The yeast Sch9 protein kinase is a homologue of mammalian Akt and S6K (19,20). The yeast sch9Δ mutant has a smaller cell size, grows at a slower rate and shows extended CLS up to 3-fold compared with that of wild-type cells (21). The deletion of the SOD2 gene, which encodes a mitochondrial superoxide dismutase, abolishes the lifespan extension of the sch9Δ mutant (15). This demonstrates that the CLS longevity in the sch9Δ mutant is at least partially due to the protection against oxidative damage. Protein kinase Rim15 is required for this lifespan extension (21). Rim15 functions via the transcription factors (TFs) Msn2/4 and Gis1, which bind to the stress response element (STRE) and post-diauxic shift (PDS) element, respectively, and activate a variety of stress response genes to promote long-term survival in stationary phase (18).
Evidences from chronological ageing studies also indicate that the regulation of lifespan and genomic instability are tightly linked (22,23). The lifespan extension of the sch9Δ mutant is associated with a decrease of age-dependent mutation frequency (22). In fact, the rate of rDNA recombination decreases approximately 4-fold in the sch9Δ mutant compared with the wild type (24). The lack of Sch9 activity also prevents the recombination errors and protects against the genomic instability that is associated with the accelerated ageing in the sgs1Δ mutant (23).
In our previous study, we analysed the expression profiles of three long-lived yeast strains ras2Δ, tor1Δ and sch9Δ mutants together with that of wild-type cells at one point of time after the diauxic shift. We identified significant and systematic expression differentiation in the three strains, including down-regulation of Tricarboxylic Acid Cycle (TCA cycle), oxidative phosphorylation compared with glycolysis and reduction of mitochondrial activities (25,26). These results support the free radical (2) and the programmed longevity theories of ageing (7).
In this study, we obtained the expression profiles of the sch9Δ mutant and the wild type every 12 h from 12 h to 120 h. From the consecutive snapshots of the cellular expression profiles, we traced the different paths taken by the two strains. We monitored how they respond to the nutrient depletion, the changes required to enter stationary phases and those to their CLSs. The scheme of our analyses is shown in Supplementary Figure S1. The data processing of microarrays was based on a series of work previously developed (26–29). The resulting expression profiles were interpreted into cellular activities by statistical inferences using biological instruments and were graphically displayed. Finally, the dynamic and systematic view of the cellular biological activities will shed light on the mechanisms of ageing.
MATERIALS AND METHODS
Microarray experiment
We obtained the gene expression profiles of the wild-type (DBY746) and the sch9Δ mutant every 12 h from 12 h to 120 h. We used the same growth conditions as described previously (17,26). Briefly, each strain was inoculated in 1 ml synthetic dextrose complete (SDC) medium and grown overnight. The overnight cultures were diluted to an initial density of 1–2 × 10⁶ cells ml−1 (OD600 of 0.1–0.2) by fresh SDC medium into two flasks each containing a final volume of 50 ml. Both strains were then maintained at 30°C with shaking (220 r.p.m.) to ensure proper aeration. Every 12 h, yeast cells were collected from each flask by centrifugation, washed with cold water once and resuspended in 400 µl of 10 mM Tris pH 7.5, 10 mM Ethylenediaminetetraacetic Acid (EDTA) and 0.5% Sodium Dodecyl Sulfate (SDS). After adding 400 µl of warm acid phenol, the cell suspension was incubated at 65°C for 20 min with vortexing every 5 min, centrifuged and the supernatant was extracted twice with acid phenol and once with chloroform. Total RNA was recovered by precipitation with ethanol and cleaned up by using the RNAsy kit (Qiagen). RNA (5 µg/sample) was sent to the UCLA DNA array Core Facility. They generated the complementary RNA (cRNA), which was labelled by biotin and hybridized onto Affymetrix GeneChip Yeast 2.0 arrays.
In the SDC medium, after ∼10 h of exponential growth, yeast cells (wild type) undergo a diauxic shift, switching the metabolism from fermentation to respiration. The diauxic shift is followed by a post-diauxic phase, in which growth continues slowly till ∼48 h, and then stops (17). We carried out the time-course experiment for wild type limited to first 5 days (before majority of cells die), so that it is easier to keep enough mRNA for hybridization experiments without further amplification. To make their expression profiles comparable, we measured expressions of the sch9Δ mutant in the same time frame in this round of experiment.
Data processing
After image processing, each .CEL file contained the probe fluorescent intensities of the corresponding array. We applied the probe-treatment-reference method (29) coupled with sub-array normalization (27,28) to estimate gene expression from probe intensities. We carried out the sub-array normalization between each reference-target array pair illustrated in Supplementary Table S1. Specifically, for each pair, we divided both arrays into sub-arrays of size 50 by 50, and sub-arrays overlap by half the sub-array size. Within each sub-array, we fitted the reference intensities by α + β*target intensities via least trimmed squares (LTS), in which the trimming fraction of LTS was 0.45. Finally, we replaced each target intensity by the average of α + β*target intensities fitted from each sub-array that covered the spot. The PTR method allows multiple references in normalization, and models the normalized intensities from one probe-set by the three-factor model: log2(intensity) = treatment effect + probe effect + reference effect. The model fitting was based on minimization of L1 norm, or the least absolute deviations (LAD). The three-way median polishing algorithm (30) was used for computation.
Definition of gene sets from biological knowledge
We defined gene sets primarily based on three sources of biological knowledge: Gene Ontology (GO), Kyoto Encyclopedia of Genes and Genomes (KEGG) pathway and protein localization data. The GO data are available from SGD’s ftp site (ftp://genome-ftp.stanford.edu/pub/go/). The whole GO data are organized as a directed acyclic graph (DAG), where each node is a set of genes with a specific annotation. These gene sets are defined through three key biological concepts molecular function, biological process and cellular component. In order to avoid redundancy, we only selected informative GO nodes. In the GO DAG, one node was selected as an informative node when it contained more than 30 genes and none of its children contained more than 30 genes. This selection ended up with gene sets of 41 cellular components, 50 molecular functions and 107 biological processes. In addition, we added some gene sets that were particularly relevant to our interests. For example, we considered three gene sets from GO: RNA polymerases (RNAPs) I, II and III (GO:0005736, GO:0005665 and GO:0005666). Although they are small gene sets, we were interested in knowing their gene expression patterns with the reference of each other. The KEGG pathway database was downloaded from ftp://ftp.genome.jp/pub/kegg/pathway/organisms/sce/. It provides manually annotated metabolic and signalling pathways. We selected 100 well-established S. cerevisiae pathways to define KEGG gene sets. The protein localization data were downloaded from http://yeastgfp.ucsf.edu/. It provides subcellular localization information for 4156 proteins, representing 75% of the yeast proteome (31). These proteins had been classified into 22 distinct subcellular localization categories, including nucleus, cytoplasm and other specific subcellular regions. We defined 22 localization gene sets based on these subcellular localization categories. In this article, we labelled the data source of each gene set by the tag: ‘GO.cel’ for GO cellular component, ‘GO.mol’ for molecular function, ‘GO.bio’ for biological process, ‘KEGG’ for KEGG pathway and ‘GFP’ for protein localization data.
Gene set enrichment analysis
Gene set enrichment analysis is a method to determine whether a pre-defined set of genes show significantly up- or down-regulation compared with other gene sets. In this study, we conducted the enrichment analysis based on expression time differences for each strain. The analyses were based on the Wilcoxon scoring scheme as previously described (26). Briefly, based on the expression differentiation between one pair of adjacent time points, we compared the fold changes of gene set Si against the background expression changes denoted by G − Si, where G is the union of all gene sets. We adopted the Wilcoxon rank test to calculate P-value (one sided) and assigned the final significance scores after multiple testing correction using ‘q value’ package (32) in R. After we finished the enrichment analysis for all pairs of adjacent time points, we combined them together and displayed the significance scores over time (Figure 2).
Figure 2.

Graphical display of enrichment analysis on expression time difference. We illustrated the inference results for gene sets involved in carbohydrate metabolism, energy production, RiBi and degradation. The significance scores of up- or down-regulation between adjacent time points were represented by shades of red or green, as shown in the colour bar. For example, the red colour for gene set TCA (KEGG) in the first column (24_12) indicates that the expression for TCA genes are significantly (q-value <0.001) up-regulated in 24 h compared with 12 h. These gene sets were defined by GO cellular components (GO.cel), molecular function (GO.mol), biological process (GO.bio), KEGG pathway (KEGG) and protein localization data (GFP).
Volatility analysis
In this time-course expression profile, we used a volatility score to quantify the fluctuation of gene expression during a specific time period in each strain. Suppose we have the log2 expression values (e1, e2, … , en) of a specific gene, where n is the total number of time points in that time period. We first calculated the rate of gene expression change (REC) between each adjacent two time points as follows,
Then we defined the volatility score (V) of this gene to be the standard deviation of these RECs. Namely,
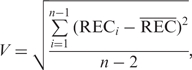 |
where  is the average of RECs and n – 1 is the total number of RECs.
In addition, we defined the trend score (T) as the ratio of the sum of REC versus the sum of absolute REC values:
In this study, we calculated the volatility and trend scores for all the genes in the 36–108 h time period.
We further compared the volatility scores of each defined gene set between the two strains. Given a gene set having m genes, we denoted volatility scores for the wild type and the sch9Δ mutant to be  and
and  , respectively. We adopted the one-sided Wilcoxon rank test on Vwt and Vsch9 to evaluate the significance of the difference. Since there were a number of gene sets, once again, we corrected the multiple comparisons by the ‘qvalue’ method (32). Those significant gene sets were further examined by their median expression curves and the significances of up-/down-regulation between each adjacent time points.
Motif identification
To identify the regulatory motifs in the 50 most volatile genes in the sch9Δ mutant, we extracted upstream regions of 1000 bp in length for each gene. We applied the MEME software (33) (version 3.5.7) to find overrepresented motifs. The MEME program performs local multiple sequence alignments with expectation–maximization (EM) algorithm (34), and searches the most frequent and significant sub-string pattern(s) [motif(s)], which occurs repeatedly in the given sequences. The MEME software was set to search both forward and reverse strands of the given upstream sequences, assuming that each gene contains at most one occurrence of each motif. We also specified the software to search at most eight different motifs and required that each motif must occur in more than 10 genes. The minimum and maximum motif widths were 5 and 15 bp, respectively.
Based the position-specific scoring matrix (PSSM) of the three motifs [polymerase A and C (PAC), ribosomal RNA (rRNA) processing element (rRPE) and glucose response element (GRE)], we conversely applied the MAST software (35) to scan the 50 sequences to identify the positions of each motif. The PSSM was obtained from the MEME output. The MAST program was set to identify non-overlapping motif positions with p-value <0.0001. When we analysed the distances of each motif to the gene start position, only the shortest distance was used for the motif that had multiple positions on one promoter sequence.
CLS assay
All the mutant strains were derivatives of DBY746 (MATα leu2-3, 112, his3Δ, trp1-289, ura3-52 and GAL+). Knockout strains were generated by one-step gene replacement as described previously (36). Yeast cells were grown in the SDC supplemented with 2% glucose and various amino acids, as well as a 4-fold access of tryptophan, leucine, uracil and histidine.
Yeast CLS was monitored by measuring colony-forming units (CFUs). Overnight SDC culture was diluted (1:200) into fresh SDC medium (with flask to culture volume of 5:1) and was maintained at 30°C with shaking (200 r.p.m.). After 24 h (Day 1), cells from the culture were diluted appropriately and plated on Yeast Peptone Dextrose (YPD) plates. The YPD plates were incubated at 30°C for 2–3 days, and CFUs were measured. Every 48 h, we repeated this step and got the CFUs for each time. CFU of Day-3 culture was considered to be the initial survival (100%) as the yeast reached the stationary phase. Mean (50% survival) and maximum life (10% survival) spans were calculated from curve fitting of the survival data. Cell size was measured by fluorescence microscope as previously described (18). The cell size is quantified as the diameter (the average of the long and short axes of the cell). On Day 1, 129–249 cells per genotype were measured.
RESULTS
Experimental design and microarray data
We measured gene expression profiles of the S. cerevisiae wild type (DBY746) and the long-lived sch9Δ mutant every 12 h from 12 h to 120 h. At each time point, one sample was hybridized onto one Affymetrix GeneChip Yeast 2.0 array. In total, 10 time points were measured for each strain. We denoted the arrays hybridized with the wild-type cDNA, respectively, as 12-h wt, … , 108-h wt and 120-h wt. A similar notation was used to label arrays hybridized with the sch9Δ mutant cDNA. Yeast 2.0 array has 11 probes for each probe-set, and probes are laid out on a chip according to a random design. Therefore, these 11 probes serve as replicates to some extent. We bear in mind that the probe-specific effect and spatial variation need to be well taken care of in the microarray processing. These considerations together with the cost issue led to our experimental design.
We first performed a check of the data quality. We inspected the fluorescent intensity image of each array, in particular, the internal and external spiked-in controls. All arrays looked normal except for the 120-h sch9Δ array. The probe intensities for this array were extremely low; the alternating pattern of intensities on the border and the chip name at the upper-left corner were difficult to recognize; the external hybridization controls, BioB, BioC, BioD and CreX (37), did not show a desired low-to-high intensity pattern. Thus, we excluded this array from further data analysis.
Normalization and summarization
The Affymetrix GeneChip Yeast 2.0 Array is a single-channel technology, that is, one chip is hybridized with only one cDNA sample. To fairly compare fluorescent intensities between two arrays, we have to adjust the ‘block effect’ of each array due to uncontrollable variation in order to detect possible expression differences between the two cDNA samples. Technically, we need to find a monotone transformation that matches the distributions of hybridization levels of those probes corresponding to undifferentiated genes between the two samples. This procedure is referred to as normalization. We performed normalization in a pairwise fashion among the raw array data: one array was taken as a reference and the other was taken as its target. The fluorescent intensities on the target array were transformed so that the distribution of a large portion of the intensities matched that on the reference array.
We chose the sub-array method (27,28) to normalize each pair of arrays. Namely, each Yeast 2.0 array of size 496 by 496 features was decomposed into sub-arrays of smaller size, 50 by 50. At this sub-array level, a simple linear transformation that represents the difference in their average background and scale is sufficient for normalization or close to be so. The parameter estimation, however, is challenging because control genes or known house-keeping genes are not available across the whole array. It is possible that both strains might undergo substantial expression changes at certain time points along the ageing processes. In addition, the biochemical properties of probes vary to some extent. Thus, a reasonable estimator should be able to avoid statistical breakdown due to these complications. In this study, we estimated the parameters by LTS to capture the biochemical feature of the majority of the probes and to detect expression differentiation.
After normalization, hybridization intensities of probes from one probe-set are summarized into an expression value for the corresponding gene. Since each probe has its own binding affinity (38,39), the summarization needs to adjust for the probe-specific effect. We also expect the treatment-specific information (a treatment refers to a time point in this time-course data) to be, more or less, separated from the block effect for each reference array as the result of the sub-array normalization. Naturally, we adopted the three-factor PTR model (29) that includes probe-, treatment- and reference-specific effects to summarize the fluorescent intensities into expression values. That is, the normalized data were fitted by the three-factor PTR model according to the reference–target relations for each probe-set, and the parameters were estimated by LAD. The computation was implemented by a three-way median polishing.
The measured time-course expression profiles covered several stages of the yeast life. In the SDC medium, when yeast cells exhaust glucose, they undergo the diauxic shift and move from fermentative- to respiratory-based growth. In the post-diauxic and stationary phase, the carbon sources were approaching depletion and cells were arrested in the G0 stage (17). When cells approach the stationary phase, several physiological and biochemical changes occur, including the thickening of the cell wall, the accumulation of reserve carbohydrates and the increase of stress resistance (40). These changes are accompanied by global gene expression changes over time. A long-standing technique in the studies of non-stationary time series data is to analyse them in a moving-window fashion. Accordingly, we adopted a moving time-window scheme (Supplementary Table S1), in which only the marked pairs of reference–target were included in the normalization and summarization. For example, the 12-h wt served as a reference for normalizing the 24-, 36- and 48-h wt but not others; the 24-h sch9Δ was normalized with respected to the reference 12-, 36- and 48-h sch9Δ. In other words, we conducted pairwise normalization in a time-window and shifted this window along the time-course. In this study, we focused on time-course expression patterns of each strain, and cross-strain normalization was not included in the summarization.
The Affymetrix Yeast 2.0 GeneChip contains probe-sets for both S. cerevisiae and S. pombe. The observed fluorescent intensities of S. pombe probes are primarily due to cross-hybridization. We kept these probe-sets in normalization. After summarization, we examined the results by checking S. pombe probe-sets and the scale factors estimated from LTS of the sub-array method as previously described (26).
The expression M–A plots of adjacent time points are shown in Supplementary Figures S2 and S3. M values are the log2 ratios of expressions between two adjacent time points and A values are the average of log2 expressions for the two points (41). Most of the results were reasonable according to the examination of S. pombe probe-sets and the distribution of scale parameters. The expression differentiations between 12 and 24 h, between 24 and 36 h, were relatively high compared with other time points, particularly in the wild type.
Different time-course expression profiles in the wild-type and the sch9Δ mutant
Since the wild-type and the sch9Δ mutant have different ageing rates, it is difficult to match time points between their time-course expression profiles. Thus, our analyses focused on different features of the two time-courses rather than the differences at a specific time point. For convenience, we referred to the log2 ratio of gene expression between adjacent time points as expression time difference.
We illustrated the distributions of log2 expression values for S. pombe and S. cerevisiae probe-sets at each time point using box plots (Figure 1A–D). The estimated expression values for S. pombe probe-sets were low and almost unchanged over time in both strains. This validated, from one aspect, the proposed normalization and summarization procedure. We further examined the S. pombe probe-sets which had extremely high signal values (the outliers in the box plots). They turned out to be genes encoding cytosolic ribosomal units that are highly conserved between S. pombe and S. cerevisiae (42,43).
Figure 1.

The marginal distributions of global time-course expression profiles of the two strains. (A–D) The box plots of the expression profiles of S. pombe and S. cerevisiae probe-sets at each time points, respectively. (E and F) The box plots of expression time difference. There are a total of 5031 S. pombe probe-sets and 5841 S. cerevisiae probe-sets.
The global expression patterns were different in the two S. cerevisiae strains, whereas the intensity levels of the S. pombe probe-sets were well aligned. In the wild type, the global expression may undergo substantial changes as cells move from the phases of late exponential growth, diauxic shift, post-diauxic to the stationary phase in the SDC medium (17). Indeed, we observed an up-then-down pattern during the first 60 h in the wild type. In contrast, the global gene expression in the sch9Δ mutant was relatively stable over time. Statistically, we tested the changes of expression marginal distribution over time using one-sided Wilcoxon rank tests (see p-values in Supplementary Table S2). These test scores demonstrated that during the period covered by the microarray experiment, which was up to 5 days, the global expression changes occurred less often and less drastically in the sch9Δ mutant than in the wild type (also see the distributions of the expression time difference in Figure 1E and F).
Interpretation of expression time differences as changes of biological activities
Our next goal was to translate expression time differences into changes of biological activities. Following the enrichment analysis previously described (26), we inferred significant biological changes by integrating expression time difference with the gene sets defined by the knowledge from informative GO category, KEGG pathway, protein localization data (31) and other sources (see ‘Materials and Methods’ section). We graphically displayed the inference results for gene sets involved in carbohydrate metabolism, energy production, ribosome biogenesis (RiBi) and degradation (Figure 2). In this heatmap, each column corresponds to a statistical comparison of expressions between two adjacent time points; each row corresponded to a gene set. The value in each cell, depicted in various shades of red or green, represented the significance score of up- or down-regulation for the gene set between two specific time points. The enrichment analyses were arranged along the horizontal direction by time and along the vertical direction roughly by clustering gene sets based upon the similarities of significance scores over time. The gene sets with relevant biological functions tended to be close to each other after the clustering step. We deliberately put the cluster including electron transport right above the cluster including processing of 20S rRNA for a comparison that will be discussed later. The inferences drawn from three different kinds of biological knowledge were quite consistent. In the following sections, we investigated the biological activities which exhibited different expression patterns between the two strains and elaborated the most significant results in an integrative way.
Different transcript profiles of mitochondrial ribosomal proteins in the wild-type and the sch9Δ mutant
Mitochondria are the organelles where the reactions of TCA cycle, electron transport and oxidative phosphorylation occur. In the wild type, after ∼10 h, the glucose level decreases to very low levels. Saccharomyces cerevisiae cells activate the transcription of many respiratory-related genes and switch from fermentation to aerobic respiration (17). Later, the mitochondrial activity continues to decrease, and then stabilizes when ethanol and other non-fermentable carbon sources are approaching depletion (44).
Part of the mitochondrial activities can, to some extent, be measured by the gene expression of mitochondrial ribosomal proteins (MRPs), which are nucleus encoded. Meanwhile, the cytosolic ribosomal protein (CRP) gene set is a perfect reference for the statistical comparison of MRPs between the two strains, as previously described (26). In that report, we compared the expression profiles of long-lived strains including the sch9Δ, ras2Δ and tor1Δ mutants with the wild type, and demonstrated that MRP genes were significantly down-regulated with the reference of CRP genes at one point of time during the PDS (26). This observation was extended by the new time-course data in this study (Figure 3A and B).
Figure 3.

Expression profiles of genes involved in aerobic respiration. (A and B) The expression patterns of CRP genes were similar between the two strains, while genes encoding the MRPs were different in the sch9Δ mutant compared to the wild type. (C and D) In the wild type, gene expressions for oxidative phosphorylation, electron transport and TCA were up-regulated drastically between 12 and 24 h and kept at a high level until 48 h; in the sch9Δ mutant, their gene expressions were less up-regulated between 12 and 24 h, then were immediately down-regulated to a lower level. In this figure, each expression curve was drawn from the median expression value of the corresponding GO or KEGG gene set at each time point.
The expression profiles of CRP genes in the wild type were quite stable after 24 h, while that in the sch9Δ mutant exhibited a slight down- and up-regulation curve. In contrast, the expression profiles of MRP genes were very different between the two strains: the MRP genes in the wild type were first up-regulated and then down-regulated during the 12- to 60-h period (Figure 3A); while the mRNA levels of MRP genes were relatively stable in the sch9Δ mutant (Figure 3B), indicating that the sch9Δ cells took a different path of diauxic shift.
Early down-regulation of electron transport and oxidative phosphorylation gene expressions in the sch9Δ mutant
Under aerobic conditions, the electron transport chain in the mitochondrial inner membrane is the site of oxidative phosphorylation and of ATP production. The leakage of electrons to oxygen generates reactive oxygen species (ROS) which are toxic and are thought to be one of the causes of ageing (2). The expression profiles of MRPs in the wild type were different from those in the sch9Δ mutant. We further investigated the expression profiles for gene sets: oxidative phosphorylation, electron transport and TCA. In the wild type, the expressions of these gene sets were up-regulated dramatically between 12 and 24 h and remained at a high level till 48 h (Figure 3C); in the sch9Δ mutant, the respective gene expressions were comparatively less up-regulated between 12 and 24 h, and were immediately down-regulated to a lower level that did not change much until 108 h (Figure 3D). The down-regulation of oxidative phosphorylation and electron transport gene sets between 24 and 36 h was even more drastic than that of TCA gene set.
We also examined the expression patterns for two key respiration genes, RSF1 and RSF2. Both gene products are required for respiratory growth: they influence mitochondrial transcription and coordinate transcriptional regulation of respiration-related nuclear genes (45,46). Their expression curves were consistent with the expression pattern of oxidative phosphorylation and electron transport gene sets in both strains (Supplementary Figure S4).
These results implied that the expressions of genes involved in the aerobic respiration were down-regulated earlier in the sch9Δ mutant. These expression changes, especially the change of electron transport, could lead to the reduction of ROS generation and might account for part of the lifespan extension of the sch9Δ mutant. Moreover, these expression changes are in agreement with the change of gene expression of MRP, and consistent with our recent experimental study of the metabolic switch in sch9Δ. In that study, we found that the ethanol produced by the fermentation of glucose during the exponential growth is depleted early in the sch9Δ mutant, and that there is a metabolic switch from biosynthesis and release of ethanol in the wild type to that of glycerol in the sch9Δ cells (47).
Volatility of gene expressions
As shown in Figure 2, expressions of several gene sets fluctuate more than others over time. It motivated us to conduct a volatility analysis (see ‘Materials and Methods’ section) based on the expression profiles. First, we calculated the volatility score (V) of each gene to quantify its expression fluctuation. Second, we calculated the trend score (T) to quantify the upward or downward trend of each gene embedded in the expression time-course. The trend score takes values from −1 to 1. In the extreme case of continuous up- or down-regulation, we have T = 1 and −1, respectively. Since we had excluded the 120-h sch9Δ array and the expression changes were extremely large during the early time period of the experiments in both strains, we restricted our volatility analysis to the 36- to 108-h period.
The volatility distributions of the two strains were quite different from each other, as shown by the scatter plots of the volatility versus the trend (Figure 4A and B). We considered a volatility score to be high if it was larger than the 90% quantile of the pooled volatility scores from both strains. We identified 668 and 512 genes with high-volatility scores in wild type and sch9Δ, respectively. In the wild type, 278 and 282 (41.62% and 42.22%) high-volatile genes had trend scores in the range  and
and  ; in the sch9Δ mutant, 329 and 141 (64.26% and 27.54%) high-volatile genes have trend scores in the range
  and
and  (Supplementary Table S3). It suggested that many genes were down-regulated during the 36- to 108-h period in the wild type. On the other hand, in the sch9Δ mutant, the highly volatile genes had trend scores close to 0. In fact, the distribution of volatility versus trend in the sch9Δ exhibited an up-side-down T-shape, indicating that the expressions of a portion of genes fluctuated but did not exhibit an obvious trend.
Figure 4.

The volatility of gene expressions. (A and B) The scatter plots of volatility versus trend during the 36- to 108-h period. The marginal distributions of volatility and trend scores were plotted along the right and top axes, respectively. Green points: genes encoding MRP; red points: rRNA processing genes. The MRP genes were downward regulated in the wild-type but not in the sch9Δ mutant. The rRNA processing genes in the sch9Δ mutant fluctuated more but without an obvious trend. (C and D) The expression pattern of rRNA processing gene sets. The median expression curves were drawn based on the following gene sets: the processing of 35S and 20S pre-rRNA (GO.bio), the cellular component of snoRNP (GO.cel), the nucleolus-located proteins (GFP), RNAP I/III (GO.cel) and the RiBi regulon.
rRNA processing gene expressions were more volatile in the sch9Δ mutant
In S. cerevisiae, three of the four rRNAs (18S, 5.8S and 25S) are first transcribed by RNAP I, as a single 35S rRNA precursor; the other rRNA (5S) is transcribed by RNAP III (42). After the transcription, the 35S pre-rRNA is extensively modified and processed into mature rRNAs with the help of small nucleolar ribonucleoprotein (snoRNP). Both rRNA transcription and processing mainly take place in nucleolus (48). In our volatility analysis, the gene sets related to the rRNA processing were much more volatile in the sch9Δ mutant compared with the wild type (q-value <0.05) (Figure 4).
The volatile expression pattern was also observed for the RNAP I/III subunit genes and the RiBi regulon (49) (Figure 4C and D). There are multiple copies (more than 100) of rRNA locus (rDNA) in the yeast genome, but only a fraction of them are actively transcribed (50). A study of the exponentially growing yeast cells showed that the rRNA synthesis rate is determined by the RNAP I loading rate rather than by the copy number (51). Several studies also point out that Rrn3 is the key regulatory factor for the transcriptional initiation of RNAP I (51–53). In this time-course data, the expression of RRN3 fluctuated over time in the wild type but relatively stable in the sch9Δ mutant. In contrast to RRN3, the expression of RRN11 gene, which encodes one component of the initiation core factor (54), fluctuated in the similar way as RNAP I genes in both strains (Supplementary Figure S5), indicating that Rrn11 might play an important role in the regulation of RNAP I during the synthesis of mature rRNA in the sch9Δ mutant.
Up-regulation of TCA was accompanied by deep down-regulation of rRNA processing genes
Not only were the rRNA processing genes in the sch9Δ mutant volatile during the 36- to 108-h period, but they were also down-regulated drastically between 12 and 24 h (Figure 4D). The rDNA region occupies a large portion of the genome and resides in the nucleolus. The stability of rDNA is highly connected to ageing, as shown by the accumulation of extrachromosomal rDNA circles (ERCs) in ageing yeast cells (55). When we compared the rRNA processing gene sets such as the nucleolus-localized gene products, processing of 35S and 20S pre-rRNA, with electron transport, oxidative phosphorylation and TCA over time, we observed that the up-regulation of these respiration gene sets was accompanied by deep down-regulation of rRNA processing genes over time in the sch9Δ mutant (Figure 5G–L; Supplementary Figure S6). Take the TCA gene set for example, their genes were significantly up-regulated in the 12- to 24-h, 48- to 60-h and 84- to 96-h period (Figure 5H); correspondingly, the genes encoding nucleolus-located proteins were down-regulated at these time periods, particularly so during the 12- to 24-h and 84- to 96-h period (Figure 5G). During other time intervals, TCA genes were either down-regulated or almost unchanged, whereas nucleolus gene set (localization) was up-regulated.
Figure 5.

The opposite gene expression differentiation between rRNA processing and respiration gene sets over time. We illustrated the marginal distributions of expression time difference by horizontal box plots for gene sets related to rRNA processing and gene sets related to oxidative phosphorylation and TCA. Left two columns (A–F) indicate the wild type; whereas right two columns (G–L) indicate the sch9Δ mutant. In all box plots, a red colour indicates significant positive median log2 ratios (P-value <0.01 by sign test); green colour indicates significant negative median log2 ratios; and a grey colour indicates insignificant median log2 ratios.
More quantitatively, this phenomenon can be seen from two aspects: first, at each adjacent time interval, if the down-regulation of rRNA processing genes is coupled with up-regulation of TCA or the non-down-regulation of rRNA processing genes is coupled with non-up-regulation of TCA, then we call it a match. Eight adjacent time intervals exist for the sch9Δ mutant, while nine exist for the wild type. In Supplementary Table S4, we show the relevant statistical significance values of enrichment analysis as displayed in Figure 2. If we take the chance model of independent fair-coin flipping for the eight events of sch9Δ, the chance of seeing eight matches is 2−8 (∼0.0039); the chance of observing the matches in wild type is relatively larger (>0.05). Second, in the sch9Δ mutant, when genes involving respiration are up-regulated, the down-regulation of genes involving rRNA processing is very deep (see the medians of rRNA processing gene expression time difference in Supplementary Table S4). Moreover, by computing the complete expression correlation between rRNA processing and respiration gene sets (Supplementary Figure S6), we can further prove that the anti-correlated expression pattern is more prominent in sch9Δ. As another reference for comparison, in the sch9Δ mutant, the nucleus gene set (genes encoding nucleus-located proteins) did not show the opposite expression differentiation as strong as the nucleolus gene set (see the eighth row in Figure 2).
Cis-regulatory elements upstream of the most volatile genes in the sch9Δ mutant
Next, we searched regulatory element(s) that may account for the volatility in the sch9Δ mutant. Namely, we applied the MEME algorithm (33) to the promoter regions, the 1000-bp upstream sequences, of the 50 most volatile genes. These promoter regions were enriched with the motifs of rRPE, PAC (56,57) and GRE (58,59) (Figure 6B). The transcriptional regulation via these three cis-acting elements is known to play an essential role in response to nutrients (60).
Figure 6.

Three motifs found in the promoter regions of the 50 most volatile genes in the sch9Δ mutant. (A) The clustering of expression time difference for the 50 most volatile genes. The table illustrates the presents (indicated by ‘Y’) of PAC, rRPE and GRE on the promoter region of each gene. (B) The Venn diagram of genes containing three motifs. The motifs are graphically depicted using enoLOGOS (76). (C) The distribution of distances between motifs and the coding sequence. 1, containing both PAC and rRPE; 2, containing both PAC and GRE; 3, containing both rRPE and GRE; no mark, all genes containing that motif. (D) The distribution of pairwise Pearson’s correlation coefficients for expressions of the genes containing the combinations of the three motifs.
We scanned the 50 sequences using the PSSM of the three motifs, and identified 27 genes with PAC element, 41 genes with rRPE and 34 genes with GRE. The combinations of their presence or occurrences are shown in Figure 6A and B. Based on the clustering of expression time difference and the distribution of pairwise gene expression correlation, we noticed that the genes with both rRPE and PAC were co-expressed more tightly than the genes with rRPE only (Figure 6A and D). The positions of rRPE were much closer to the genes when they also contained the PAC element (Figure 6C). These findings are consistent with the previous results on the two motifs (61,62), and further suggest their combinatorial regulation roles on the volatile genes in sch9Δ.
GRE element and Azf1
Azf1 has been identified as a positive transcriptional regulator that binds to the GRE motif and activates the transcription of the G1 cyclin gene CLN3 (58,59,63). Cln3 plays a critical role in coordinating cell growth with proliferation (64) and in determining cell size (65). As a matter of fact, we found that the expression of CLN3 exhibited a volatile pattern similar to the rRNA processing genes in the sch9Δ mutant (Supplementary Figure S5). This supports that the GRE element and Azf1 played active regulatory roles on genes, such as CLN3 and the rRNA processing genes, in the sch9Δ mutant.
The increased expression volatility of Azf1/GRE-regulated genes in the sch9Δ mutant indicated that the highly active regulation through Azf1 was important for the longevity of the sch9Δ mutant. We further conducted a CLS assay using azf1Δ mutant strains and sch9Δazf1Δ double mutant strains. The assay showed that the azf1Δ mutant had a cell size smaller than the wild type but larger than sch9Δ, and it survived almost as long as the wild type. The sch9Δazf1Δ double mutant had a cell size smaller than sch9Δ (Supplementary Figure S7; Table S5). Moreover, the deletion of AZF1 reversed the lifespan extension of the sch9Δ mutant, indicating that Azf1 was required for the lifespan extension of the sch9Δ mutant. The underlying mechanism of the Azf1 regulation is still under further investigation.
Stress response genes were up-regulated by larger fold changes in the sch9Δ mutant
The nutrients starvation and other stress conditions, including oxidative exposures, trigger the expressions of stress response genes before yeast cells enter the stationary phase. In this time-course expression profiles, the 12- to 24-h period was observed as the key time interval when many stress response genes were up-regulated to a high level. During this time period, we identified 120 and 101 stress response genes that were up-regulated by at least 1-fold (log2 ratio ≥ 1), respectively, in the wild type and the sch9Δ mutant; while 63 of them overlapped (Figure 7). Compared with the wild type, we discovered that the sch9Δ mutant had more extremely up-regulated genes with fold changes larger than four or even eight (log2 ratio > 2 or even 3) (Figure 7; Supplementary Table S6). Among them, we found cytosolic catalase gene CTT1; mitochondrial superoxide dismutase gene SOD2; peroxidase genes, GPX1, TSA2; heat shock genes, SSA3, SSA4, HSP12, HSP26, HSP30, HSP42, HSP78 and HSP104; and multi-stress-induced genes, GRE1 and DDR2. These results further confirmed that the sch9Δ cells showed enhanced stress protection while entering the non-dividing phase, consistent with the previous stress-resistance results (66).
Figure 7.

Venn diagram of the most up-regulated stress response genes between 12 and 24 h. The numbers of up-regulated genes were counted using three different log2 ratio cut-offs. In the sch9Δ mutant, we identified more extremely up-regulated genes, based on log2 ratio >2 or even 3.
DISCUSSION
Microarray technology provides us with a powerful tool for monitoring transcriptional activities of cells under certain conditions. In an earlier report, we analysed the expression profiles of the three long-lived yeast strains ras2Δ, tor1Δ and sch9Δ mutants together with the wild type at one point after the diauxic shift, and identified several expression patterns common to all three long-lived strains (25,26). The expression results are in agreement with not only the free radical theory (2) but also the programmed longevity theory (7). In this study, we performed the experiments to measure the gene expression profiles of the wild-type and the long-lived sch9Δ mutant from 12 to 120 h. Our goal was to identify the modifications of cellular activities and biological pathways that accounted for the longevity of the sch9Δ mutant. The success of the expression comparative analyses hinged on unbiased and accurate measurement of the mRNA abundances. A large fraction of genes were possibly differentially expressed in both strains. An appropriate data processing method needs to detect the expression differentiations while reducing random variation. We chose the reference–target pairs in three overlapped time windows (Supplementary Table S1) for sub-array normalization and carried out summarization based on the recently developed three-factor PTR model.
It has been reported that the overall transcription level declines dramatically as yeast cells approach stationary phase in the YPD medium (40). In the SDC medium, we did observe a substantial increase between 12 and 24 h and a substantial decline during the 48- to 60-h period in the wild type (Figure 1C). The observation matched our earlier understanding of the diauxic shift and post-diauxic phase of wild-type cells in SDC medium (17). In contrast, the global up- then down-regulation pattern was not observed in the sch9Δ mutant (Figure 1D). Since the TF and RNAP II activity can reflect the overall transcription to a great extent, we drew the median gene expression curves for gene sets: basal TFs (KEGG), transcriptional factor activity (GO) and RNAP II (GO) (Supplementary Figure S8). Their expression patterns were in concert with the global expression changes (Figure 1C).
A fraction of the genes accounting for the difference between the wild type and the sch9Δ mutant encode MRPs or relate to the mitochondrial activity. After compiling over 1000 published microarrays, Ihmels et al. (67) reported that expressions for MRPs and CRPs are uncorrelated (even weakly anti-correlated) in S. cerevisiae while they are strongly correlated in Candida albicans, which is another form of yeast that primarily grows aerobically (67). They argued that the change of MRP gene expression in S. cerevisiae is connected to the emergence of the capacity for rapid anaerobic growth. Further upstream sequence analysis confirmed that MRP and CRP genes are subject to different regulatory mechanisms in S. cerevisiae (67). In this study, the different regulatory patterns of MRP and CRP genes were clearly observed in the wild type from the time-course expression profiles (Figure 3A). However, the difference was almost lost in the sch9Δ mutant (Figure 3B). In other words, the deletion of SCH9 modified the transcription regulation of MRP genes during chronological ageing.
The aerobic metabolism of S. cerevisiae takes place in the mitochondria and the majority of harmful ROS may be generated during this process (68). ROS have been shown to be sufficient to induce apoptosis (69) and accelerate yeast chronological ageing (17). The change of MRP gene expressions suggested that in the sch9Δ mutant, the mitochondria did not require additional activity during the PDS. The early down-regulation of gene sets related to electron transport, oxidative phosphorylation and TCA further suggested that there were changes of chemical reactions on the electron transport chain that could lead to the reduction of ROS generation, in agreement with our experimental results showing that sch9Δ cells have less age-dependent increase of ROS-induced damage (21,70). In addition, we also observed that the stress response genes were up-regulated by larger fold changes in the sch9Δ mutant, which is in agreement with our recent data showing that the sch9Δ cells have enhanced cellular protection against oxidative stress (70). These findings suggest that the change in metabolic pathways together with the enhanced cellular protection through the regulation of stress resistance genes contribute to the longevity of the sch9Δ mutant.
The rRNA locus (rDNA) is a region of fluctuation because it is the primary site of repeated recombination (71). Quantitatively, we defined the volatility score for each gene and found indeed that rRNA processing genes were volatile, especially in the sch9Δ mutant. In contrast, the expressions of CRPs were more stable. One of the primary functions of Sch9 is to regulate ribosome biosynthesis (49). In yeast, the production of cytosolic ribosome, including the synthesis of mature rRNA and ribosomal proteins, demands numerous resources (72). Thus the regulation of ribosome synthesis is critical for the determination of growth rate and cell size (49). In this time-course expression profiles, the gene expressions related to rRNA synthesis were more volatile than that of ribosomal proteins. This was particularly true in the sch9Δ mutant and supports the hypothesis that the control of rRNA synthesis is the primary target of regulatory mechanisms, and the regulation of ribosomal protein synthesis is a consequence of rRNA production regulation (73).
A portion of genes exhibited increased expression volatility in sch9Δ while other genes were expressed stably. One explanation is that the volatile genes are directly and actively regulated in response to the environmental changes such as nutrition and stress. We identified three cis-regulatory elements enriched in the most volatile genes in the sch9Δ mutant. Among them, transcriptional activities via PAC and rRPE elements are involved in rRNA processing and RiBi (56). In the sch9Δ mutant, the expressions of the genes containing both PAC and rRPE motifs were co-expressed more tightly than the genes with rRPE only, and the positions of rRPE were much closer to the genes when they also contained the PAC element. Recently, Pbf1 and Pbf2 (also known as Dot6) were identified as PAC-binding factors (74). Stb3 also has been discovered as one rRPE-binding protein, but it only binds to a small portion of rRPE-containing gene (61,75). The verification of these binding factors in volatile genes and their regulations are under further investigation.
The discovery of the GRE motif in these volatile genes was particularly interesting. The known factor Azf1 binds to GRE, and its well-known target, CLN3, showed the similar volatile expression pattern as the rRNA processing genes in the sch9Δ mutant, which provided evidence that Azf1 binds to these volatile genes. We have conducted the lifespan assay of the azf1Δ mutant and the sch9Δazf1Δ double mutant. The experimental results indicate that phenotypes of the sch9Δ mutant including lifespan extension and cell size are associated with the regulation of Azf1.
Many studies supported the importance of rDNA in the ageing process. For example, ERCs are formed in the rDNA regions (55). Some recent suggestions and discussions regarding the importance of rDNA to ageing can also be found in Kobayashi (71). With the observation of the striking opposite expression differentiation over time between rRNA processing genes and electron transport, oxidative phosporylation and TCA, it is conceivable that in the non-dividing condition the up-regulation of aerobic respiration is counter-balanced by the down-regulation of rRNA synthesis and it is a possible way to protect the rDNA region from the ROS damage in the sch9Δ mutant.
Our comparative analyses of the time-course expression profiles of the sch9Δ mutant and the wild type indicated that the sch9Δ cells followed a different metabolic path during chronological ageing. We believe that the lack of SCH9 promotes entry into a longevity programme that extends the lifespan through metabolic changes and the activation of protective systems.
SUPPLEMENTARY DATA
Supplementary Data are available at NAR Online. The supplementary information consists of eight figures and six tables. The microarray data set published in this paper has been deposited in the Gene Expression Omnibus (GEO) Database under the series accession no. GSE14227. We also created a webpage (http://www-rcf.usc.edu/∼lilei/yeast_ageing.html) that will allow user to query the time-course expression profiles of yeast genes in both wild type and sch9Δ interactively.
FUNDING
National Institutes of Health Grant (R01 GM75308-05); NIH Neurosciences Blueprint (microarray experiments, partially). Funding for open access charge: USC.
Conflict of interest statement. None declared.
Supplementary Material
ACKNOWLEDGEMENTS
We thank Tam Tram for help in performing the lifespan assay for the azf1Δ mutant and the sch9Δazf1Δ double mutant. We thank Stavros Gonidakis and Peter Chang for proofreading the manuscript.
REFERENCES
- 1.Longo VD, Finch CE. Evolutionary medicine: from dwarf model systems to healthy centenarians? Science. 2003;299:1342–1346. doi: 10.1126/science.1077991. [DOI] [PubMed] [Google Scholar]
- 2.Harman D. Aging: a theory based on free radical and radiation chemistry. J. Gerontol. 1956;11:298–300. doi: 10.1093/geronj/11.3.298. [DOI] [PubMed] [Google Scholar]
- 3.Parsons PA. Inherited stress resistance and longevity: a stress theory of ageing. Heredity. 1995;75:216–221. doi: 10.1038/hdy.1995.126. [DOI] [PubMed] [Google Scholar]
- 4.Kirkwood TB. Understanding the odd science of aging. Cell. 2005;120:437–447. doi: 10.1016/j.cell.2005.01.027. [DOI] [PubMed] [Google Scholar]
- 5.Partridge L. Evolutionary theories of ageing applied to long-lived organisms. Exp. Gerontol. 2001;36:641–650. doi: 10.1016/s0531-5565(00)00232-1. [DOI] [PubMed] [Google Scholar]
- 6.Loeb LA, Wallace DC, Martin GM. The mitochondrial theory of aging and its relationship to reactive oxygen species damage and somatic mtDNA mutations. Proc. Natl Acad. Sci. USA. 2005;102:18769–18770. doi: 10.1073/pnas.0509776102. [DOI] [PMC free article] [PubMed] [Google Scholar]
- 7.Longo VD, Mitteldorf J, Skulachev VP. Programmed and altruistic ageing. Nat. Rev. Genet. 2005;6:866–872. doi: 10.1038/nrg1706. [DOI] [PubMed] [Google Scholar]
- 8.Kirkwood TB, Kowald A. Network theory of aging. Exp. Gerontol. 1997;32:395–399. doi: 10.1016/s0531-5565(96)00171-4. [DOI] [PubMed] [Google Scholar]
- 9.Kowald A, Kirkwood TB. Towards a network theory of ageing: a model combining the free radical theory and the protein error theory. J. Theor. Biol. 1994;168:75–94. doi: 10.1006/jtbi.1994.1089. [DOI] [PubMed] [Google Scholar]
- 10.Kowald A, Kirkwood TB. A network theory of ageing: the interactions of defective mitochondria, aberrant proteins, free radicals and scavengers in the aging process. Mutat. Res. 1996;316:209–226. doi: 10.1016/s0921-8734(96)90005-3. [DOI] [PubMed] [Google Scholar]
- 11.Bitterman KJ, Medvedik O, Sinclair DA. Longevity regulation in Saccharomyces cerevisiae: linking metabolism, genome stability, and heterochromatin. Microbiol. Mol. Biol. Rev. 2003;67:376–399. doi: 10.1128/MMBR.67.3.376-399.2003. [DOI] [PMC free article] [PubMed] [Google Scholar]
- 12.Madia F, Gattazzo C, Fabrizio P, Longo VD. A simple model system for age-dependent DNA damage and cancer. Mech. Ageing Dev. 2007;128:45–49. doi: 10.1016/j.mad.2006.11.009. [DOI] [PMC free article] [PubMed] [Google Scholar]
- 13.Morthimer RK, Johnston JR. Life span of individual yeast cells. Nature. 1959;183:1751–1752. doi: 10.1038/1831751a0. [DOI] [PubMed] [Google Scholar]
- 14.Longo VD, Gralla EB, Valentine JS. Superoxide dismutase activity is essential for stationary phase survival in Saccharomyces cerevisiae. J. Biol. Chem. 1996;271:12275–12280. doi: 10.1074/jbc.271.21.12275. [DOI] [PubMed] [Google Scholar]
- 15.Fabrizio P, Liou LL, Moy VN, Diaspro A, Valentine JS, Gralla EB, Longo VD. SOD2 functions downstream of Sch9 to extend longevity in yeast. Genetics. 2003;163:35–46. doi: 10.1093/genetics/163.1.35. [DOI] [PMC free article] [PubMed] [Google Scholar]
- 16.Kaeberlein M, Burtner CR, Kennedy BK. Recent developments in yeast aging. PLoS Genet. 2007;3:e84. doi: 10.1371/journal.pgen.0030084. [DOI] [PMC free article] [PubMed] [Google Scholar]
- 17.Fabrizio P, Longo VD. The chronological life span of Saccharomyces cerevisiae. Aging Cell. 2003;2:73–81. doi: 10.1046/j.1474-9728.2003.00033.x. [DOI] [PubMed] [Google Scholar]
- 18.Wei M, Fabrizio P, Hu J, Ge H, Cheng C, Li L, Longo VD. Life span extension by calorie restriction depends on Rim15 and transcription factors downstream of Ras/PKA, Tor, and Sch9. PLoS Genet. 2008;4:e13. doi: 10.1371/journal.pgen.0040013. [DOI] [PMC free article] [PubMed] [Google Scholar]
- 19.Geyskens I, Kumara SHMC, Donaton M, Bergsma JCT, Thevelein JM, Wera S. Expression of mammalian PKB partially complements deletion of the yeast protein kinase Sch9. NATO ASI Ser. A. Life Sci. 2000;316:117–126. [Google Scholar]
- 20.Urban J, Soulard A, Huber A, Lippman S, Mukhopadhyay D, Deloche O, Wanke V, Anrather D, Ammerer G, Riezman H, et al. Sch9 is a major target of TORC1 in Saccharomyces cerevisiae. Mol. Cell. 2007;26:663–674. doi: 10.1016/j.molcel.2007.04.020. [DOI] [PubMed] [Google Scholar]
- 21.Fabrizio P, Pozza F, Pletcher SD, Gendron CM, Longo VD. Regulation of longevity and stress resistance by Sch9 in yeast. Science. 2001;292:288–290. doi: 10.1126/science.1059497. [DOI] [PubMed] [Google Scholar]
- 22.Fabrizio P, Battistella L, Vardavas R, Gattazzo C, Liou LL, Diaspro A, Dossen JW, Gralla EB, Longo VD. Superoxide is a mediator of an altruistic aging program in Saccharomyces cerevisiae. J. Cell Biol. 2004;166:1055–1067. doi: 10.1083/jcb.200404002. [DOI] [PMC free article] [PubMed] [Google Scholar]
- 23.Madia F, Gattazzo C, Wei M, Fabrizio P, Burhans WC, Weinberger M, Galbani A, Smith JR, Nguyen C, Huey S, et al. Longevity mutation in SCH9 prevents recombination errors and premature genomic instability in a Werner/Bloom model system. J. Cell Biol. 2008;180:67–81. doi: 10.1083/jcb.200707154. [DOI] [PMC free article] [PubMed] [Google Scholar]
- 24.Prusty R, Keil RL. Sch9, a putative protein kinase from Saccharomyces cerevisiae, affects HOT1-stimulated recombination. Mol. Genet. Genomics. 2004;272:264–274. doi: 10.1007/s00438-004-1049-x. [DOI] [PubMed] [Google Scholar]
- 25.Cheng C, Fabrizio P, Ge H, Longo VD, Li LM. Inference of transcription modification in long-live yeast strains from their expression profiles. BMC Genomics. 2007;8:219. doi: 10.1186/1471-2164-8-219. [DOI] [PMC free article] [PubMed] [Google Scholar]
- 26.Cheng C, Fabrizio P, Ge H, Wei M, Longo VD, Li LM. Significant and systematic expression differentiation in long-lived yeast strains. PLoS ONE. 2007;2:e1095. doi: 10.1371/journal.pone.0001095. [DOI] [PMC free article] [PubMed] [Google Scholar]
- 27.Cheng C, Li LM. Sub-array normalization subject to differentiation. Nucleic Acids Res. 2005;33:5565–5573. doi: 10.1093/nar/gki844. [DOI] [PMC free article] [PubMed] [Google Scholar]
- 28.Li LM, Cheng C. Methods in Microarray Normalization. Differentiation Detection in Microarray Normalization. Boca Raton, London, New York: CRC Press, Taylor & Francis Group; 2008. pp. 19–40. [Google Scholar]
- 29.Ge H, Cheng C, Li LM. A probe-treatment-reference (PTR) model for the analysis of oligonucleotide expression microarrays. BMC Bioinformatics. 2008;9:194. doi: 10.1186/1471-2105-9-194. [DOI] [PMC free article] [PubMed] [Google Scholar]
- 30.Tukey JW. Exploratory Data Analysis. 1977. Addison-Wesley Longman, Reading, Mass. [Google Scholar]
- 31.Huh WK, Falvo JV, Gerke LC, Carroll AS, Howson RW, Weissman JS, O’Shea EK. Global analysis of protein localization in budding yeast. Nature. 2003;425:686–691. doi: 10.1038/nature02026. [DOI] [PubMed] [Google Scholar]
- 32.Storey JD, Tibshirani R. Statistical significance for genome-wide experiments. Proc. Natl Acad. Sci. USA. 2003;100:9440–9445. doi: 10.1073/pnas.1530509100. [DOI] [PMC free article] [PubMed] [Google Scholar]
- 33.Bailey TL, Williams N, Misleh C, Li WW. MEME: discovering and analyzing DNA and protein sequence motifs. Nucleic Acids Res. 2006;34:369–373. doi: 10.1093/nar/gkl198. [DOI] [PMC free article] [PubMed] [Google Scholar]
- 34.Bailey TL, Elkan C. Unsupervised learning of multiple motifs in biopolymers using expectation maximization. Mach. Learn. 1995;21:51–83. [Google Scholar]
- 35.Bailey TL, Gribskov M. Combining evidence using p-values: application to sequence homology searches. Bioinformatics. 1998;14:48–54. doi: 10.1093/bioinformatics/14.1.48. [DOI] [PubMed] [Google Scholar]
- 36.Brachmann CB, Davies A, Cost GJ, Caputo E, Li J, Hieter P, Boeke JD. Designer deletion strains derived from Saccharomyces cerevisiae S288C: a useful set of strains and plasmids for PCR-mediated gene disruption and other applications. Yeast. 1998;14:115–132. doi: 10.1002/(SICI)1097-0061(19980130)14:2<115::AID-YEA204>3.0.CO;2-2. [DOI] [PubMed] [Google Scholar]
- 37.Affymetrix GeneChip Expression Analysis – Data Analysis Fundamentals. 2002. Santa Clara, CA, Affymetrix. [Google Scholar]
- 38.Li C, Wong WH. Model-based analysis of oligonucleotide arrays: model validation, design issues and standard error application. Genome Biol. 2001;2:RESEARCH0032. doi: 10.1186/gb-2001-2-8-research0032. [DOI] [PMC free article] [PubMed] [Google Scholar]
- 39.Irizarry RA, Bolstad BM, Collin F, Cope LM, Hobbs B, Speed TP. Summaries of Affymetrix GeneChip probe level data. Nucleic Acids Res. 2003;31:e15. doi: 10.1093/nar/gng015. [DOI] [PMC free article] [PubMed] [Google Scholar]
- 40.Werner-Washburne M, Braun E, Johnston GC, Singer RA. Stationary phase in the yeast Saccharomyces cerevisiae. Microbiol. Rev. 1993;57:383–401. doi: 10.1128/mr.57.2.383-401.1993. [DOI] [PMC free article] [PubMed] [Google Scholar]
- 41.Dudoit S, Yang YH, Callow MJ, Speed TP. Statistical methods for identifying differentially expressed genes in replicated cDNA microarray experiments. Stat. Sin. 2002;12:111–139. [Google Scholar]
- 42.Venema J, Tollervey D. Ribosome synthesis in Saccharomyces cerevisiae. Annu. Rev. Genet. 1999;33:261–311. doi: 10.1146/annurev.genet.33.1.261. [DOI] [PubMed] [Google Scholar]
- 43.Dlakić M. The ribosomal subunit assembly line. Genome Biol. 2005;6:234. doi: 10.1186/gb-2005-6-10-234. [DOI] [PMC free article] [PubMed] [Google Scholar]
- 44.Gray JV, Petsko GA, Johnston GC, Ringe D, Singer RA, Werner-Washburne M. Sleeping beauty: quiescence in Saccharomyces cerevisiae. Microbiol. Mol. Biol. Rev. 2004;68:187–206. doi: 10.1128/MMBR.68.2.187-206.2004. [DOI] [PMC free article] [PubMed] [Google Scholar]
- 45.Lu L, Roberts G, Simon K, Yu J, Hudson AP. Rsf1p, a protein required for respiratory growth of Saccharomyces cerevisiae. Curr. Genet. 2003;43:263–272. doi: 10.1007/s00294-003-0398-z. [DOI] [PubMed] [Google Scholar]
- 46.Lu L, Roberts G, Oszust C, Hudson AP. The YJR127C/ZMS1 gene product is involved in glycerol-based respiratory growth of the yeast Saccharomyces cerevisiae. Curr. Genet. 2005;48:235–246. doi: 10.1007/s00294-005-0023-4. [DOI] [PubMed] [Google Scholar]
- 47.Wei M, Fabrizio P, Madia F, Hu J, Ge H, Li LM, Longo VD. Tor1/Sch9-regulated carbon source substitution is as effective as calorie restriction in life span extension. PLoS Genet. 2009;5:e1000467. doi: 10.1371/journal.pgen.1000467. [DOI] [PMC free article] [PubMed] [Google Scholar]
- 48.Leary DJ, Huang S. Regulation of ribosome biogenesis within the nucleolus. FEBS Lett. 2001;509:145–150. doi: 10.1016/s0014-5793(01)03143-x. [DOI] [PubMed] [Google Scholar]
- 49.Jorgensen P, Rupes I, Sharom JR, Schneper L, Broach JR, Tyers M. A dynamic transcriptional network communicates growth potential to ribosome synthesis and critical cell size. Genes Dev. 2004;18:2491–2505. doi: 10.1101/gad.1228804. [DOI] [PMC free article] [PubMed] [Google Scholar]
- 50.Dammann R, Lucchini R, Koller T, Sogo JM. Chromatin structures and transcription of rDNA in yeast Saccharomyces cerevisiae. Nucleic Acids Res. 1993;21:2331–2338. doi: 10.1093/nar/21.10.2331. [DOI] [PMC free article] [PubMed] [Google Scholar]
- 51.French SL, Osheim YN, Cioci F, Nomura M, Beyer AL. In exponentially growing Saccharomyces cerevisiae cells, rRNA synthesis is determined by the summed RNA polymerase I loading rate rather than by the number of active genes. Mol. Cell Biol. 2003;23:1558–1568. doi: 10.1128/MCB.23.5.1558-1568.2003. [DOI] [PMC free article] [PubMed] [Google Scholar]
- 52.Cavanaugh AH, Hirschler-Laszkiewicz I, Hu Q, Dundr M, Smink T, Misteli T, Rothblum LI. Rrn3 phosphorylation is a regulatory checkpoint for ribosome biogenesis. J. Biol. Chem. 2002;277:27423–27432. doi: 10.1074/jbc.M201232200. [DOI] [PubMed] [Google Scholar]
- 53.Beckouet F, Labarre-Mariotte S, Albert B, Imazawa Y, Werner M, Gadal O, Nogi Y, Thuriaux P. Two RNA polymerase I subunits control the binding and release of Rrn3 during transcription. Mol. Cell Biol. 2008;28:1596–1605. doi: 10.1128/MCB.01464-07. [DOI] [PMC free article] [PubMed] [Google Scholar]
- 54.Lalo D, Steffan JS, Dodd JA, Nomura M. RRN11 encodes the third subunit of the complex containing Rrn6p and Rrn7p that is essential for the initiation of rDNA transcription by yeast RNA polymerase I. J. Biol. Chem. 1996;271:21062–21067. doi: 10.1074/jbc.271.35.21062. [DOI] [PubMed] [Google Scholar]
- 55.Sinclair DA, Guarente L. Extrachromosomal rDNA circles–a cause of aging in yeast. Cell. 1997;91:1033–1042. doi: 10.1016/s0092-8674(00)80493-6. [DOI] [PubMed] [Google Scholar]
- 56.Hughes JD, Estep PW, Tavazoie S, Church GM. Computational identification of cis-regulatory elements associated with groups of functionally related genes in Saccharomyces cerevisiae. J. Mol. Biol. 2000;296:1205–1214. doi: 10.1006/jmbi.2000.3519. [DOI] [PubMed] [Google Scholar]
- 57.Wade CH, Umbarger MA, McAlear MA. The budding yeast rRNA and ribosome biosynthesis (RRB) regulon contains over 200 genes. Yeast. 2006;23:293–306. doi: 10.1002/yea.1353. [DOI] [PubMed] [Google Scholar]
- 58.Parviz F, Hall DD, Markwardt DD, Heideman W. Transcriptional regulation of CLN3 expression by glucose in Saccharomyces cerevisiae. J. Bacteriol. 1998;180:4508–4515. doi: 10.1128/jb.180.17.4508-4515.1998. [DOI] [PMC free article] [PubMed] [Google Scholar]
- 59.Newcomb LL, Hall DD, Heideman W. Azf1 is a glucose-dependent positive regulator of CLN3 transcription in Saccharomyces cerevisiae. Mol. Cell Biol. 2002;22:1607–1614. doi: 10.1128/mcb.22.5.1607-1614.2002. [DOI] [PMC free article] [PubMed] [Google Scholar]
- 60.Slattery MG, Liko D, Heideman W. Protein kinase A, TOR, and glucose transport control the response to nutrient repletion in Saccharomyces cerevisiae. Eukaryotic Cell. 2008;7:358–367. doi: 10.1128/EC.00334-07. [DOI] [PMC free article] [PubMed] [Google Scholar]
- 61.Boorsma A, Lu X, Zakrzewska A, Klis FM, Bussemaker HJ. Inferring condition-specific modulation of transcription factor activity in yeast through regulon-based analysis of genomewide expression. PLoS ONE. 2008;3:e3112. doi: 10.1371/journal.pone.0003112. [DOI] [PMC free article] [PubMed] [Google Scholar]
- 62.Beer M, Tavazoie S. Predicting gene expression from sequence. Cell. 2004;117:185–198. doi: 10.1016/s0092-8674(04)00304-6. [DOI] [PubMed] [Google Scholar]
- 63.Slattery MG, Liko D, Heideman W. The function and properties of the Azf1 transcriptional regulator change with growth conditions in Saccharomyces cerevisiae. Eukaryotic Cell. 2006;5:313–320. doi: 10.1128/EC.5.2.313-320.2006. [DOI] [PMC free article] [PubMed] [Google Scholar]
- 64.Polymenis M, Schmidt EV. Coupling of cell division to cell growth by translational control of the G1 cyclin Cln3 in yeast. Genes Dev. 1997;11:2522–2531. doi: 10.1101/gad.11.19.2522. [DOI] [PMC free article] [PubMed] [Google Scholar]
- 65.Zhang J, Schneider C, Ottmers L, Rodriguez R, Day A, Markwardt J, Schneider BL. Genomic scale mutant hunt identifies cell size homeostasis genes in S. cerevisiae. Curr. Biol. 2002;12:1992–2001. doi: 10.1016/s0960-9822(02)01305-2. [DOI] [PubMed] [Google Scholar]
- 66.Fabrizio P, Gattazzo C, Battistella L, Wei M, Cheng C, McGrew K, Longo V. Sir2 blocks extreme life-span extension. Cell. 2005;123:655–667. doi: 10.1016/j.cell.2005.08.042. [DOI] [PubMed] [Google Scholar]
- 67.Ihmels J, Bergmann S, Gerami-Nejad M, Yanai I, Mcclellan M, Berman J, Barkai N. Rewiring of the yeast transcriptional network through the evolution of motif usage. Science. 2005;309:938–940. doi: 10.1126/science.1113833. [DOI] [PubMed] [Google Scholar]
- 68.Balaban RS, Nemoto S, Finkel T. Mitochondria, oxidants, and aging. Cell. 2005;120:483–495. doi: 10.1016/j.cell.2005.02.001. [DOI] [PubMed] [Google Scholar]
- 69.Madeo F, Fröhlich E, Ligr M, Grey M, Sigrist SJ, Wolf DH, Fröhlich KU. Oxygen stress: a regulator of apoptosis in yeast. J. Cell Biol. 1999;145:757–767. doi: 10.1083/jcb.145.4.757. [DOI] [PMC free article] [PubMed] [Google Scholar]
- 70.Madia F, Wei M, Yuan V, Hu J, Gattazzo C, Pham P, Goodman MF, Longo DV. Oncogene homologue Sch9 promotes age-dependent mutations by a superoxide and Rev1/Polζ-dependent mechanism. J. Cell Biol. 2009;186:509–523. doi: 10.1083/jcb.200906011. [DOI] [PMC free article] [PubMed] [Google Scholar]
- 71.Kobayashi T. A new role of the rDNA and nucleolus in the nucleus – rDNA instability maintains genome integrity. Bioessays. 2008;30:267–272. doi: 10.1002/bies.20723. [DOI] [PubMed] [Google Scholar]
- 72.Warner JR. The economics of ribosome biosynthesis in yeast. Trends Biochem. Sci. 1999;24:437–440. doi: 10.1016/s0968-0004(99)01460-7. [DOI] [PubMed] [Google Scholar]
- 73.Nomura M. Regulation of ribosome biosynthesis in Escherichia coli and Saccharomyces cerevisiae: diversity and common principles. J. Bacteriol. 1999;181:6857–6864. doi: 10.1128/jb.181.22.6857-6864.1999. [DOI] [PMC free article] [PubMed] [Google Scholar]
- 74.Zhu C, Byers KJ, McCord RP, Shi Z, Berger MF, Newburger DE, Saulrieta K, Smith Z, Shah MV, Radhakrishnan M, et al. High-resolution DNA-binding specificity analysis of yeast transcription factors. Genome Res. 2009;19:556–566. doi: 10.1101/gr.090233.108. [DOI] [PMC free article] [PubMed] [Google Scholar]
- 75.Liko D, Slattery MG, Heideman W. Stb3 binds to ribosomal RNA processing element motifs that control transcriptional responses to growth in Saccharomyces cerevisiae. J. Biol. Chem. 2007;282:26623–26628. doi: 10.1074/jbc.M704762200. [DOI] [PubMed] [Google Scholar]
- 76.Workman CT, Yin Y, Corcoran DL, Ideker T, Stormo GD, Benos PV. enoLOGOS: a versatile web tool for energy normalized sequence logos. Nucleic Acids Res. 2005;33:W389–W392. doi: 10.1093/nar/gki439. [DOI] [PMC free article] [PubMed] [Google Scholar]
Associated Data
This section collects any data citations, data availability statements, or supplementary materials included in this article.