


Abstract
The nervous system is composed of a wide variety of neurons. A description of the transcriptional profiles of each neuron would yield enormous information about the molecular mechanisms that define morphological or functional characteristics. Here we show that RNA isolation from single neurons is feasible by using an optimized mRNA tagging method. This method extracts transcripts in the target cells by co-immunoprecipitation of the complexes of RNA and epitope-tagged poly(A) binding protein expressed specifically in the cells. With this method and genome-wide microarray, we compared the transcriptional profiles of two functionally different neurons in the main C. elegans gustatory neuron class ASE. Eight of the 13 known subtype-specific genes were successfully detected. Additionally, we identified nine novel genes including a receptor guanylyl cyclase, secreted proteins, a TRPC channel and uncharacterized genes conserved among nematodes, suggesting the two neurons are substantially different than previously thought. The expression of these novel genes was controlled by the previously known regulatory network for subtype differentiation. We also describe unique motif organization within individual gene groups classified by the expression patterns in ASE. Our study paves the way to the complete catalog of the expression profiles of individual C. elegans neurons.
INTRODUCTION
Each neuron in a mature nervous system has various physiological, biochemical and morphological properties, which are defined by the specific set of expressed genes in the neurons. Therefore, a description of the transcriptional profiles of each neuron would provide a basis for understanding the molecular mechanisms that generate neuronal diversity. With its relatively simple nervous system and fully-sequenced genome, the model nematode Caenorhabditis elegans offers a unique opportunity to attempt this challenging research objective (1–3).
Neurons are categorized into classes by their morphologies or cell positions, but the individual cells within a class may differ in some functional aspect or transcriptional profile. For example, each mammalian olfactory sensory neuron responds to a limited set of odorants and expresses a unique olfactory receptor despite their shared neuronal morphologies (4). Similar subtype differentiation within a neuron class can be found in the cone photoreceptor cells in the visual system (5) suggesting general mechanisms for generating neuronal diversities to deal with a wide spectrum of the stimuli. In the C. elegans taste sensory systems, the two members of the main taste neuron class, ASEL and ASER, differ in their responsive chemical ion (for example, Na+, K+ and Cl−), calcium response properties and expressed gene repertories of putative chemoreceptor guanylyl cyclases (gcy genes) and putative neurotransmitters despite their identical morphologies (6–10). Since these two neurons are the left/right pair of the ASE neuron class, the subtype differentiation between these two neurons results in the generation of left/right asymmetry.
The transcriptional profiles of some C. elegans neuron classes were described with the use of embryonic culture cells collected by fluorescence-activated cell sorting (FACS) method (11–14). However, expression profiling of each single member neuron within a neuron class has never been achieved because the subtype-differentiation often occurs at later developmental stages. On the other hand, comparison of whole transcripts between regulatory factor mutants that either lack or have an excess number of the target cells could also be used for the identification of the cell-specific transcripts (15,16). Although this method would be promising, use of specific regulatory factor mutants might underestimate the difference of the transcriptional profiles between target cells.
The mRNA tagging method is a direct mRNA extraction method using poly(A) binding protein (PABP) [see Figure 1 of ref. (17) for a schematic summary of this method] (17,18). The transcripts in the targets are captured by the epitope-tagged PABP (FLAG::PABP) expressed in the target cells by a cell-specific promoter. Transcripts in the target cells are harvested from the immunoprecipitated FLAG::PABP/mRNA complex by removing the crosslink, which can be used for microarray analysis for the description of the expression profiles. This method has been applied so far to relatively large tissues such as the muscles, the intestine, the whole nervous system and subsets of the nervous system such as the whole ciliated sensory neurons and ‘A class’ motor neurons (17–20). Although in principle this method can be used to target any cells at any developmental stage, in practice RNA isolation from a small number of cells has been technically demanding (16).
Figure 1.

FLAG::PABP is expressed in single neurons of the transgenic animals. Expression of FLAG::PABP in the single cells of transgenic worms carrying ASELp::flag::pabp (A) and ASERp::flag::pabp (B) are visualized by immunohistochemistory with anti-FLAG antibodies. Arrowheads point to the immunofluorescence signals. Top panels are immunofluorescence images, and bottom panels are differential interference contrast (DIC) images. Scale bar = 25 µm.
Here we show that transcript enrichment from single cells is feasible by an optimized mRNA tagging protocol and single cell-specific promoters. We conducted a comparison of transcriptional profiles of two subtype neurons within the ASE taste neuron class, ASEL and ASER, by genome-wide microarrays. The single-cell mRNA tagging/microarray strategy identified 62% of the previously known subtype-specific genes as well as nine novel genes with biased expression patterns confirmed. Four of the nine genes belonged to known, asymmetrically-expressed gene groups that encode putative chemoreceptors and neurotransmitters, whereas the other five genes belonged to unprecedented novel gene families including ion channels. These results suggest the wide range of differentiation within the neuron class. Expression of the novel genes was affected by mutations of the known regulatory factors, suggesting that all the subtype-specific gene expression is under the control of the regulatory pathway consisting of the upstream loop of global fate determinants and the downstream network of transcription factors. We also found a unique tendency in the number and the nucleotide usage of a specific cis-element in the genes with ASEL-biased expression. Our study expanded our knowledge regarding the extent of the neuronal subtype diversification, and paved the way for the impartial description of the gene expression profiles of the individual C. elegans neurons.
MATERIALS AND METHODS
Generation of strains expressing FLAG::PABP in ASEL or ASER
Plasmids expressing FLAG::PABP in ASEL or ASER were made by inserting the DNA fragment of the promoter region of gcy-7 or gcy-5, respectively, into the 5′-upstream of FLAG::PABP, which were cloned into pPD49.26. Resulting constructs were pgcy-7p::FLAG::PABP(FL) and pgcy-5p::FLAG::PABP(FL), respectively. Each construct was injected into dpy-20(e2017) animals with pMH86[dpy-20(+)] as a co-injection marker. Stable transgenic strains with the transgene integrated into the chromosome were generated from unstable transgenic lines as described (21,22). Each integrated strain was backcrossed five times with the host strain, resulting in JN1128 dpy-20(e2017) IV; Is[gcy-7p::flag::pabp; dpy-20(+)] and JN1129 dpy-20(e2017) IV; Is[gcy-5p::flag::pabp; dpy-20(+)].
Immunohistochemistry
Animals synchronized at later larval stages were fixed as described (23). Anti-FLAG M2 monoclonal antibody (Sigma) and Alexa Fluor 488 anti-mouse antibody (Molecular Probes) were used at a 1:500 dilution and at a 1:2000 dilution, respectively. Fluorescence was detected under a differential interference contrast (DIC)-fluorescence microscope.
mRNA tagging
For the efficient RNA isolation from single neurons, we modified the following five steps of the original mRNA tagging protocol (17). (i) Harvested liquid-cultured worms were treated with 0.5% formaldehyde in M9 for 20 min at room temperature. (ii) Elution of the precipitated materials including FLAG::PABP/mRNA complexes was repeated three times to improve recovery. (iii) The eluate of RNA/FLAG::PABP complexes were incubated for 1 h at 65°C to remove the crosslink rather than 6 h which may increase the probability of RNA degradation. (iv) Proteins were removed and nucleic acid was recovered with Trizol (Invitrogen) followed by isopropanol precipitation. (v) The nucleic acid extracts were processed with DNase I (Qiagen) and RNeasy minelute cleanup kit (Qiagen) to remove the contaminating DNA.
Real time RT–PCR
Reverse transcription and quantification of the PCR products were done by using SYBR RT-PCR kit Perfect real time (Takara) and ABI PRISM7000 (Applied Biosystems) according to the manufacturers’ protocol. Equal amounts of RNA were converted to cDNA and 10 ng of the cDNA from each sample was subjected to a gene-specific PCR reaction in a total volume of 20 µl. Serial dilutions of cDNA prepared from total RNA of wild-type worms were used to generate a standard curve. The ratio of expression levels for each gene was calculated using the amount of lmn-1 as a reference, and the results of two independent experiments were averaged. The primers used for the amplification of each gene were: lmn1–52: 5′-CGTTCACCACCCACCAGAA-3′, lmn1–32: 5′-CAAGACGAGCTGATGGGTTATCT-3′ for lmn-1; gcy5–51: 5′-CCTACCAAGAGAAAAAGTTGAACTAAGAA-3′, gcy5–31: 5′-GGGCATGGATAGACCAACGA-3′ for gcy-5; gcy6–51: 5′-CACGTGGCGAAGTCATAATCA-3′, gcy6-31: 5′-GCTGACTCGTCCATTTTAAGCA-3′ for gcy-6; gcy7.fw1: 5′-TCTCCCAGACCCGATTTGG-3′, gcy7.rv1: 5′-CCGAAGGACGTTCGGTAAAAC-3′ for gcy-7. All primers were designed to include one intron in the PCR product amplified from the genomic DNA for each gene, such that the length and melting point were different from the product amplified from the cDNA.
Microarray data analysis
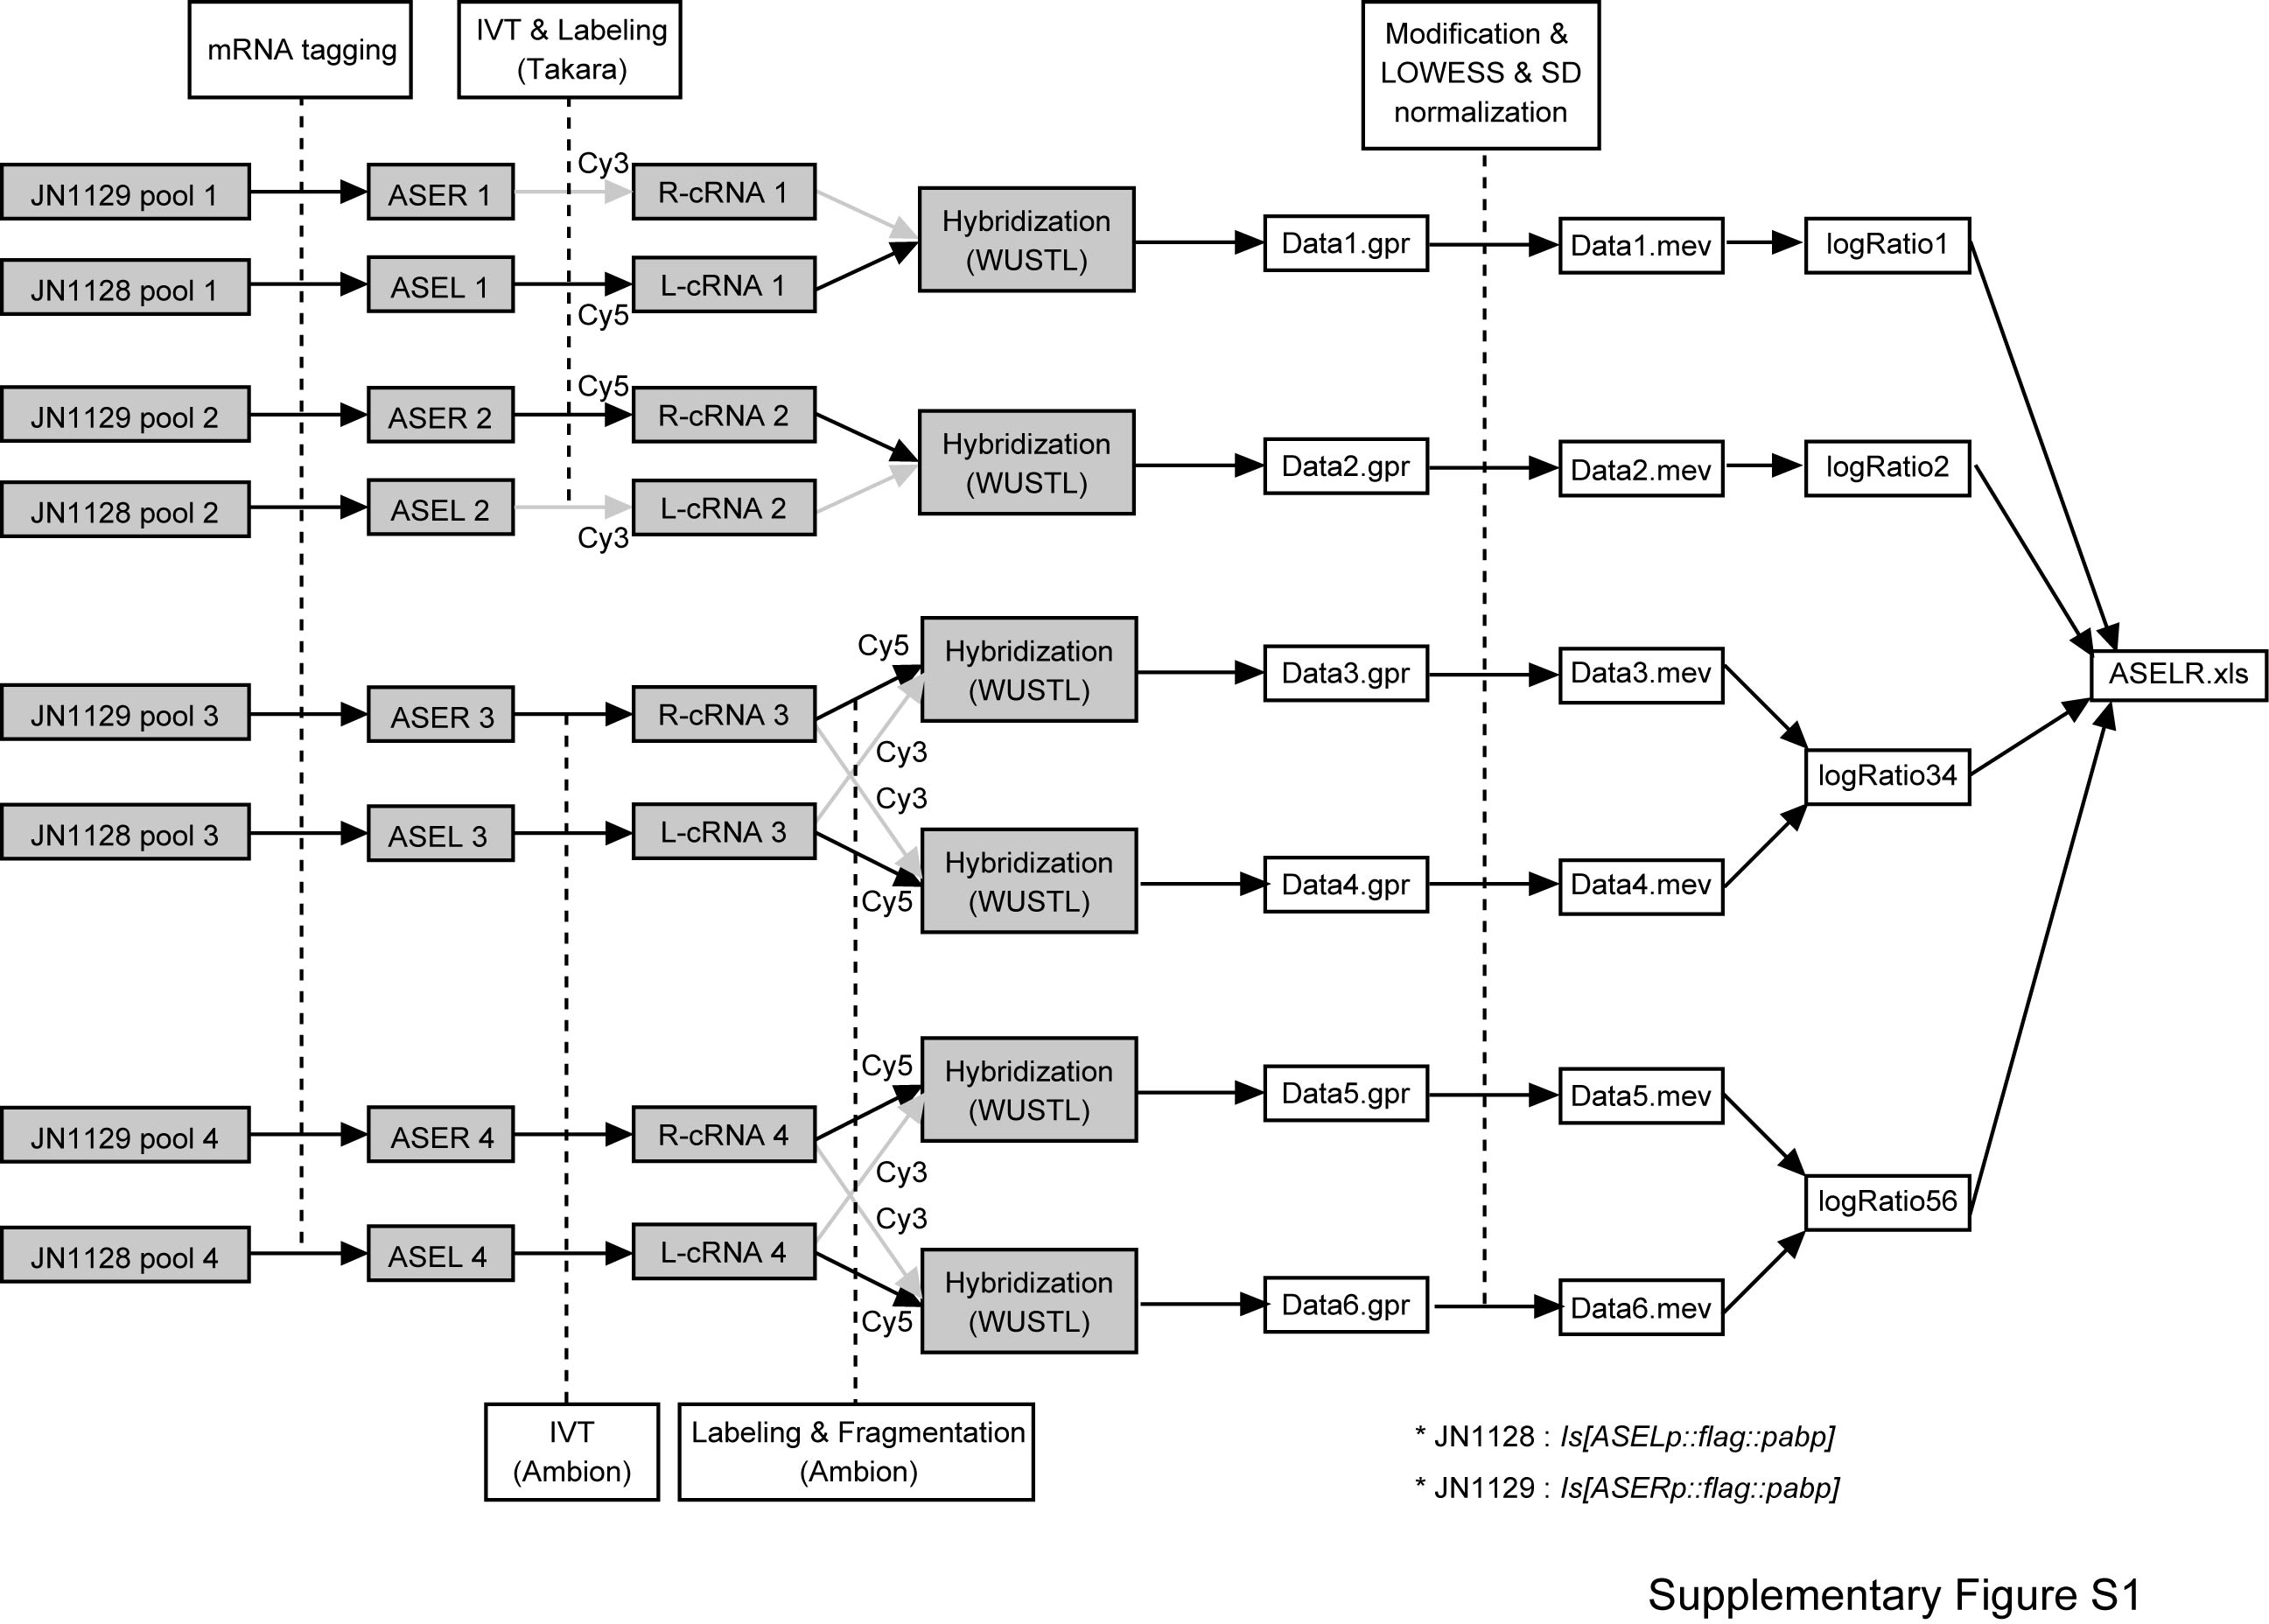
Four independent RNA samples were prepared from each of ASEL and ASER by mRNA tagging. Using SureLabel core kit (Takara) and MessageAmpII aRNA amplification kit (Ambion), the precipitated RNAs were reverse-transcribed, linearly amplified by in vitro transcription, labeled with fluorescent dye Cy3 or Cy5, and hybridized to six slides of long oligomer-based spotted microarray (Washington University, St. Louis) with two pairs of dye-swapped repeats (Supplementary Methods section and Supplementary Figure S1).
The data obtained by microarray scans were processed as follows (Supplementary Figure S1). Intensities of spot features annotated as ‘Bad’ or ‘Not Found’ in the .gpr files were set to −1 to be removed from further analysis, and all of the six processed .gpr data were converted to .mev file with TIGR ExpressConverter ver. 1.7. The .mev files were processed with TIGR MIDAS ver. 2.19 with parameters set as follows: ‘one bad channel tolerance policy’ as generous, with both of ‘channel flag’ checked and background unchecked. The data were normalized by lowess normalization with default settings and with block and slide SD regularization. We then calculated log2(ASER/ASEL) ratios for each gene on the microarray. For the two pairs of dye-swapped repeats, we calculated the mean log2(ASER/ASEL) of each repeat, so that up to four log2(ASER/ASEL) values per spot were obtained. We then calculated the percentile rank for each gene. Each gene spot detected more than once (18 847 spots) were subjected to Mann–Whitney’s U test to assess whether its percentile rank values are significantly higher compared to the rest of the genes detected in the same experiments. Resulting significance levels are shown by P-values. From the P-values, false discovery rate (FDR) was further calculated by the Benjamini and Hochberg method (24). Statistical analyses were done by using R software version 2.9. The microarray dataset is publicly available at ArrayExpress (http://www.ebi.ac.uk/microarray-as/ae/).
Venus reporter fusions for the determination of expression patterns
All reporter genes were created by PCR fusion as previously described (25) with modification for using a Venus plasmid, pPD-Venus75, which was made by inserting KpnI-EcoRI fragment from pPD-Venus into pPD95.75. Primer sequences are shown in Supplementary Table S3. DNA was injected at ∼20–80 ng/µl with pMH86[dpy-20(+)] to dpy-20(e2017) animals or with lin-44::GFP marker to wild-type N2 animals or animals carrying the otIs151 transgene in which ASEL/R and AWCL/R are labeled with DsRed2. Some of the transgenes were co-injected with pGceh-36p::mRFP to label ASEL/R and AWCL/R with mRFP. Transgenic lines of Venus reporter strains that showed ASER-biased expression were introduced into lim-6(nr2073), lsy-6(ot71) and che-1(p674) mutants by crossing them. Transgenic worms at the adult or L1 stages were observed under a DIC-fluorescence microscope. Cells were identified according to their positions by comparing the fluorescence images of Venus and DiQ staining and/or RFP fluorescence in ASE neurons with Nomarski images of the same animal. At least two independent transgenic lines were observed and quantified to confirm the expression patterns for wild-type and mutant backgrounds. Images were obtained as described previously (17).
DNA motif analysis
The patser algorithm was used to search for the ASE motifs (26). A position-specific scoring matrix was deduced from 27 sequences of the previously determined ASE motifs (Supplementary Methods section) (13). The background model was defined as A, T = 0.3 and C, G = 0.2, which roughly correspond to the rate of occurrence of each nucleotide in the examined promoters. The score of a given motif is defined as the sum of the score of each nucleotide, ranging from −29.88 to 11.38 in this motif. To correctly and specifically detect the ASE motifs, we set the lower threshold score to 7.00, which was higher than the numerically calculated cut-off score (6.14) and the highest score of the 31 sequences that failed to bind CHE-1 in vitro (3.29). This setting could detect 96% of the motifs previously shown to bind CHE-1 (25/26). Promoter sequences examined in the reporter fusion experiments and those of previous studies were categorized as ‘ASER’, ‘ASEL’, ‘Bilateral’ or ‘Neither’ gene set according to their expression patterns in ASE neurons (Supplementary Tables S4 and S5). Approximately 150 genes were selected randomly from genes spotted in the oligonucleotide microarray, constituting the ‘Random’ gene set. 5′-intergenic regions with maximum length of 5000 bp were obtained as promoter sequences of ‘Random’ set from WormBase (WS170) through WormMart (Supplementary Table S4). Similar results were obtained from two other independent sets of random promoters (data not shown).
RESULTS
Optimization of the mRNA tagging/microarray profiling method for single cells
To enrich for transcripts from the single mature taste neurons, we generated two C. elegans lines stably expressing FLAG::PABP in ASEL or ASER from chromosomally integrated transgenes. FLAG::PABP was expressed by the promoter of gcy-7 or gcy-5, which drives expression exclusively in ASEL or ASER, respectively (10). Single cell expression of FLAG::PABP was confirmed by immunohistochemistry with the anti-FLAG antibody (Figure 1). Chemotaxis to NaCl and KCl were normal in these transgenic worms, suggesting the functional integrities of ASE neurons in these transgenic lines (data not shown).
For the efficient extraction of transcripts from single neurons, we made five modifications on the mRNA tagging method (‘Materials and methods’ section). With these modifications, we could specifically enrich for the cell-specific transcripts from ASEL and ASER. The effectiveness of enrichment was assessed by quantifying the relative amount of the transcripts in the extracted RNA samples by real-time quantitative RT-PCR (qPCR). The amount of transcripts for ASEL-specific gcy-6 and gcy-7 were larger in RNA samples from ASEL by 10- and 90-fold, respectively, compared to those from ASER (Supplementary Table S1). Additionally, transcript for ASER-specific gcy-5 gene was 5-fold enriched (Supplementary Table S1). These results suggest that the mRNA tagging method specifically enriches transcripts from single cells.
For the expression profiling by microarrays, we adopted two alterations to the experimental procedures: (i) use of genome-wide oligonucleotide microarrays instead of cDNA microarrays, and (ii) linear amplification of mRNA by in vitro transcription with T7 RNA polymerase. We chose genome-wide microarrays rather than cDNA microarrays to increase the probability of identifying subtype-specific genes because genes expressed in a small subset of neurons tend to be under-represented in cDNA libraries. Amplification of mRNA was introduced because we assumed the relative amount of the targeted transcripts to be low in the extracted RNA sample. In reality, we observed significant amount of rRNA in the RNA eluate by gel electrophoresis (data not shown), and the amount of RNA from single cells was comparable with that from whole muscle cells; ∼100 ng RNA was obtained from 0.4 to 0.5 ml of formaldehyde-treated worms in both cases (17). We reasoned that rRNAs were the majority of the pulled-down RNA sample, and hence the total amounts of the two samples were not different. Thus, we adopted Eberwine’s linear amplification method to increase the relative amount of transcripts (27).
Single cell mRNA tagging identified nine novel genes expressed differentially in the target cells
We applied the above-mentioned mRNA tagging-microarray strategy for the identification of subtype-specific genes in the ASE neurons. Approximately 1 µg of RNA was extracted from ∼4 ml of formaldehyde-treated worms. RNA samples extracted from each cell were linearly amplified, labeled with Cy3 or Cy5, mixed with each other and hybridized to the microarray, which carried 20 966 C. elegans genes. Four independent RNA samples were hybridized to six slides of microarray with dye-swapping (Supplementary Figure S1). For each spot of hybridization, we calculated the logarithm ratio of the signal intensity, log2(ASER/ASEL), and the percentile rank ordered by the log ratio (from 0.00% for the highest ASER-bias to 100.00% for the highest ASEL-bias). Eighteen thousand eight hundred and forty-seven spots were detected in more than one experiment.
From the results, we considered a given gene to be significantly different between the two neurons according to two criteria. First, the averaged log ratio should be larger than 1.0 or smaller than −1.0, which means a 2-fold enrichment in either of the cells; 188 genes (149 for ASER and 39 for ASEL) satisfied this criterion. Second, the distribution of the percentile rank values of the gene should be significantly higher or lower than the other genes detected in the same experiments (P < 0.005; Mann–Whitney’s U-test, which correspond to 35% FDR). This criterion further refined the candidates to 102 and 27 genes as significantly enriched to ASER and ASEL, respectively (Supplementary Table S2).
To evaluate the microarray results, we examined the scores of 13 genes already known for the subtype-specific expression (indicated by asterisks in Table 1). The above analysis detected 62% (8/13) of ASEL- or ASER-biased genes as significantly enriched (gcy-6, gcy-7, gcy-14 and gcy-20 for ASEL; gcy-3, gcy-4, gcy-5 and gcy-22 for ASER). Although not highly significant, three of the remaining five genes showed expected bias of the signal intensities (Table 1; hen-1: log ratio = 0.44, P = 0.078; fozi-1: log ratio = 0.28, P = 0.101; lim-6: log ratio = −0.53, P = 0.027). We note that the estimated ratios of transcripts for gcy-6, gcy-7 and gcy-5 were larger in qPCR than microarray (Supplementary Table S1). This discrepancy may be explained by relatively higher background signal in microarray experiments, which might be caused by the cross-hybridization of other transcripts.
Table 1.
Microarray results of the known and novel candidate genes whose expression patterns were examined
| Gene | Probe ID | log fold | n | P-value | Molecular function | Bias |
|---|---|---|---|---|---|---|
| ASER > ASEL | ||||||
| gcy-19 | cea2.i.09274 | 3.10 | 4 | <0.001 | Guanylyl cyclase | ASER |
| K06H6.1 | cea2.i.41240 | 2.54 | 2 | <0.001 | Unknown | – |
| F22B7.3 | cea2.i.19341 | 2.49 | 2 | <0.001 | Unknown | – |
| srxa-5 | cea2.i.18632 | 2.38 | 2 | <0.001 | 7TMR | – |
| nlp-5 | cea2.i.11927 | 2.35 | 4 | <0.001 | Neuropeptide-like | ASER |
| srsx-17 | cea2.i.40237 | 2.31 | 3 | <0.001 | 7TMR | – |
| gcy-3* | cea2.i.14750 | 2.27 | 3 | <0.001 | Guanylyl cyclase | ASER |
| F08B4.4 | cea2.i.25129 | 2.20 | 2 | <0.001 | Unknown | Equal |
| srxa-4 | cea2.i.36881 | 2.17 | 2 | <0.001 | 7TMR | ND |
| srg-41 | cea2.i.44722 | 2.08 | 2 | <0.001 | 7TMR | – |
| K06H6.2 | cea2.d.04545 | 2.05 | 2 | <0.001 | Unknown | – |
| C39D10.5 | cea2.p.136555 | 2.05 | 4 | <0.001 | Unknown | ASER |
| C14C6.3 | cea2.i.33346 | 1.94 | 2 | <0.001 | Unknown | – |
| gcy-13 | cea2.p.114422 | 1.92 | 2 | <0.001 | Guanylyl cyclase | – |
| EGAP5.1 | cea2.i.52221 | 1.89 | 2 | <0.001 | Unknown | ASER |
| ins-3 | cea2.i.18106 | 1.89 | 2 | <0.001 | Insulin like peptide | – |
| str-199 | cea2.d.46339 | 1.88 | 2 | <0.001 | 7TMR | – |
| gcy-22* | cea2.p.123255 | 1.77 | 3 | <0.001 | Guanylyl cyclase | ASER |
| F08G12.8 | cea2.p.139395 | 1.75 | 4 | <0.001 | Unknown | ASER |
| gcy-4* | cea2.i.18253 | 1.72 | 2 | <0.001 | Guanylyl cyclase | ASER |
| nlp-25 | cea2.i.47134 | 1.64 | 3 | <0.001 | Neuropeptide-like | – |
| K07C5.9 | cea2.c.37161 | 1.64 | 4 | <0.001 | Unknown | ASER |
| nlp-7 | cea2.i.52868 | 1.45 | 3 | <0.001 | Neuropeptide-like | ASER |
| ins-4 | cea2.i.18097 | 1.40 | 2 | <0.001 | Insulin like peptide | – |
| gcy-5* | cea2.i.18285 | 1.23 | 3 | 0.002 | Guanylyl cyclase | ASER |
| trp-2 | cea2.d.08009 | 1.15 | 2 | 0.002 | TRPC channel | ASER |
| hen-1* | cea2.c.42027 | 0.44 | 2 | 0.078 | LDL motif protein | ASER |
| fozi-1* | cea2.p.67529 | 0.28 | 3 | 0.101 | Transcription factor | ASER |
| ASEL > ASER | ||||||
| gcy-7* | cea2.p.117523 | −3.71 | 4 | <0.001 | Guanylyl cyclase | ASEL |
| gcy-20* | cea2.i.37357 | −2.01 | 3 | <0.001 | Guanylyl cyclase | ASEL |
| gcy-6* | cea2.3.00146 | −1.73 | 2 | <0.001 | Guanylyl cyclase | ASEL |
| ins-32 | cea2.i.17635 | −1.65 | 2 | <0.001 | Insulin like peptide | ASEL |
| gcy-14* | cea2.i.48658 | −1.60 | 4 | <0.001 | Guanylyl cyclase | ASEL |
| ugt-56 | cea2.p.123534 | −1.39 | 4 | <0.001 | UDP-glucuronosyltransferase | Equal |
| F26C11.3 | cea2.p.37582 | −1.21 | 2 | <0.001 | Unknown | – |
| C08F11.7 | cea2.i.23393 | −1.21 | 2 | <0.001 | Unknown | ND |
| C36F7.2 | cea2.p.04051 | −1.15 | 4 | <0.001 | Unknown | – |
| gcy-17 | cea2.p.18940 | −1.08 | 2 | 0.002 | Guanylyl cyclase | – |
| lim-6* | cea2.p.149121 | −0.53 | 2 | 0.027 | Transcription factor | ASEL |
| flp-20* | cea2.p.138754 | −0.10 | 2 | 0.832 | FMRFamide-like | ASEL |
| flp-4* | cea2.c.10142 | 0.04 | 3 | 0.954 | FMRFamide-like | ASEL |
Microarray results for the genes whose expression patterns were examined by reporter analysis and those known for the lateralized expression (indicated by asterisk) to ASER or ASEL. ‘log fold’ indicates the averaged log2(ASER/ASEL) value. ‘n’ refers to the number of detection through the four sets of microarray experiments. ‘Molecular function’ of each gene is based on the description of WormBase (WS170). ‘ASER’ and ‘ASEL’ in the ‘Bias’ column indicate the respective expression bias within ASE neurons as determined by promoter-fused reporter experiments, whereas ‘-’ indicates the absence of the expression in ASE despite expression in other cells. ‘ND’ indicates that the expression was not observed throughout the body and hence the expression pattern could not be determined. Genes in bold face are newly identified genes in this study.
To search for novel subtype-specific genes, we examined the expression patterns of 28 significantly enriched genes (and nine non-significant genes) by promoter-fused reporter analyses (Table 1; Supplementary Figure S2; Supplementary Table S3). We could determine expression patterns of 26 of 28 significantly enriched genes, and identified nine novel genes with subtype-specific expression. These genes include one insulin-like peptide gene (ins-32) as an ASEL-biased gene, and one guanylyl cyclase (gcy-19), two neuropeptide-like genes (nlp-5 and nlp-7), one TRPC cation channel (trp-2) and four genes conserved among nematodes with unknown functions (C39D10.5, F08G12.8, K07C5.9 and EGAP5.1) as ASER-biased genes. Representative results of seven genes are shown in Figure 2 and quantitative results of the expression bias are shown in Figure 3B. Expression of gcy-19 was reported to be weak in both of ASE neurons (7), but we observed ASER-biased expression in four independent transgenic lines probably because a promoter region different from the previous study was used. The findings of the subtype-specific TRPC channel and four functionally unknown genes were surprising because they do not apparently belong to the two known subtype-specific gene groups of receptor guanylyl cyclases and secreted proteins, and imply a broad spectrum of the difference between the two neurons. These results suggest that the mRNA tagging/microarray strategy could identify novel genes specifically expressed in the single cells of interest.
Figure 2.

Representative fluorescence images for novel ASER-biased genes. (A) Schematic depiction of the locations of ASE neurons. Circles indicate the ASEL and ASER neurons. (B–H) Transgenic animals carrying promoter-fused Venus reporter genes. Animals at the L1 stage (B–F) and the adult stage (G, H) are shown. Scale bar = 10 µm.
Figure 3.

Quantification of the expression bias of the newly identified genes in wild-type and mutant backgrounds. (A) Lateralized gene expression in ASE is controlled by the upstream double-negative feedback loop and the downstream transcription factors (6). ASER-biased gcy genes are regulated by lim-6, whereas hen-1 is independent of lim-6. Genes in active or inactive state are shown in black or grey, respectively. (B) Quantification of the expression laterality in ASE neurons of the newly identified genes in wild-type and the mutant backgrounds. The expression bias is indicated as follows except for trp-2: ‘L > 0’ and ‘0 < R’ refer to the restricted expression to ASEL or ASER, respectively; ‘L > R’ and ‘L < R’ refer to different levels of expression in ASEL versus ASER; ‘L = R’ refers to equal expression in ASEL and ASER; ‘0 = 0’ refers to no expression in ASEL nor in ASER. For trp-2, since strong Venus expression in trp-2p::Venus worms were seen in neurons just medial to ASE, the expression was observed on one side for each animal. ‘Strong’, ‘Weak’ and ‘None’ refer to the expression levels at each neuron. The number of examined animals is shown in each graph.
To gain some insights into the functional significance of lateralized gene expression, we examined the phenotypes of four available mutants in two classes of newly identified genes. Three deletion mutants for the two novel ASER-biased neuropeptide genes, nlp-5(tm2125), nlp-7(tm2984) and nlp-7(tm2990), showed normal behavior in both salt chemotaxis and salt chemotaxis learning (28) (n = 6–8, data not shown). On the other hand, nlp-5; nlp-7 double mutants showed marginal defects in salt chemotaxis learning; the double mutant nlp-5(tm2125); nlp-7(tm2984) showed a statistically significant defect, while nlp-5(tm2125); nlp-7(tm2990) did not (n = 7–9; Supplementary Figure S4). Because ASER was suggested to have specific roles in salt chemotaxis learning (28), these neuropeptides, possibly along with some unidentified neuropeptides, might have redundant functions in salt chemotaxis learning, the possibility being the subject of future studies.
To analyze the function of trp-2 in ASE neurons, we assessed the chemotaxis behavior of the null mutant trp-2(sy691) (29), but they showed a ‘curling’ locomotion like bent-head unc-23 animals (30,31), despite their normal head morphology, making it difficult to perform ordinary chemotaxis assays. Because the curling locomotion was observed even when there was no gradient of chemical attractants, the phenotype may result from an abnormal function in neuron(s) other than ASE (data not shown). We also measured the response of ASE neurons in trp-2(sy691) mutants to upshift or downshift of ambient salt concentration by a ratiometric calcium indicator cameleon, but failed to detect any significant deficits (wild-type: n = 69, trp-2: n = 75, data not shown). Nonetheless, TRP-2 channel might contribute to an unknown feature of ASER.
Generality of the regulatory network for the ASEL/R specification
Regulatory factors and the regulatory network for the lateralized expression of the previously identified genes such as gcy and flp genes, have been well studied (6,32–37). In brief, there are two parts in the regulatory pathway: the upstream double negative feedback loop that is involved in the global fate determination of ASEL/R and the downstream network of transcription factors that regulate subsets of the subtype-specific genes (Figure 3A). All of the known asymmetrically expressed genes are dependent on the feedback loop composed of mutually regulating transcription factors and microRNAs such as lsy-6 (Figure 3A) (6,36). In the ASEL neuron, lsy-6 down-regulates the cog-1 transcription factor, which activates the expression of microRNAs such as mir-273, which in turn represses the die-1 transcription factor, which activates the expression of lsy-6 microRNA; hence they consist of a bi-stable, double negative feedback loop (6). In the downstream of the feedback loop there is a network of transcription factors, which control a subset of the subtype-specific genes. For example, the lim-6 transcription factor represses the expression of gcy-5 etc. in the ASER neuron, but does not regulate the expression of hen-1 (6).
The nine novel genes were identified in this study independently of the regulatory mechanisms for asymmetric expression. Therefore, we tested whether the regulatory feedback loop controls these genes as well. We investigated the dependency of the eight ASER-biased genes on lsy-6 by examining the expression patterns in the null mutant background of lsy-6(ot71). Since lsy-6 represses the expression of ASER-biased genes such as gcy-5 in ASEL, the expression of a given ASER-biased gene would become detectable in the ASEL neuron under the mutant background if it depends on lsy-6. We observed equivalent expression of all of the eight genes in ASEL and ASER in lsy-6(ot71) mutants (Figure 3B), suggesting the regulatory factor exerts its effects on the whole repertoire of the differentially expressed genes. The regulation was also clearly seen at the early larval stage (Supplementary Figure S3). These results strongly support the notion that the global fate determination mechanism underlies the whole aspect of the subtype-differentiation in C. elegans ASE neuron class.
We also examined the dependency of five genes on lim-6/LIM homeodomain transcription factor, which represses the expression of a subset of the ASER-biased genes (Figure 3A) (6). In the lim-6(nr2073) null mutant background, four genes (C39D10.5, K07C5.9, trp-2 and nlp-7) altered their ASER-biased expression to equivalent expression, whereas F08G12.8 did not change its expression pattern (Figure 3B). Notably, the regulation by lim-6 was either absent or only weakly observed at the larval stage (Supplementary Figure S3). These results suggest that the downstream regulators such as lim-6 control a part of the cell-fate particularly at the later developmental stages for the maintenance of the cell fate. Together with the above analysis, it is strongly supported that all of the subtype differentiation is explained by the known scheme of the regulation, which consists of the upstream fate determination loop and the downstream network of the transcription factors.
Unique motif organization in the promoter region of ASEL-biased genes
Every gene known to be expressed in ASE and other restricted sets of neurons loses its expression specifically in ASE in che-1 mutants (13,38). che-1 encodes a C2H2 zinc finger transcription factor that binds to a defined 12 bp-long DNA sequence, called the ASE motif (5′-GAADCMNHNNNH-3′; D = A/T/G, M = A/C, H = A/T/C, N = any) (13). Most of the genes expressed in ASEL and/or ASER have ASE motifs in their 5′-upstream regions, which are specifically required for the expression in ASE neurons. Other genes expressed in ASE without ASE motifs are supposed to be indirectly regulated by CHE-1 (i.e. regulated by binding of other transcription factors, which in turn are regulated by CHE-1). To address whether the newly identified nine genes are regulated by CHE-1 directly or indirectly we searched for ASE motifs in their promoter regions using a pattern matching program, patser, which scans DNA sequences with a position-specific scoring matrix (26). We set the threshold value so that it detects 25/26 of the confirmed ASE motif and none of 31 negative control sequences that are unable to bind CHE-1 (13). We found that all of the novel ASER-biased genes had ASE motif(s) in the promoter regions, whereas no ASE motif was found in the ASEL-biased ins-32 promoter (Figure 4).
Figure 4.

The newly identified genes with ASER-biased expression have ASE motifs. All of the ASER-biased genes had ASE motifs in the promoter region, whereas ASEL-biased ins-32 did not. The location of ASE motifs was shown by arrow heads. Notably, six of the eight ASER-biased genes harbored multiple motifs within the promoter region.
Etchberger et al. (13) reported that a region of nlp-7 promoter containing ASE motifs is required for the expression in ASE, and CHE-1 directly binds to ASE motifs found in gcy-19 and nlp-7 promoters, suggesting at least some ASE motifs found in this study are functional. We confirmed that the expression of the nine genes in ASE neuron is dependent on che-1 by observing the reporter expression in the che-1(p674) mutant (Figure 3B), which lacks most of the DNA binding domain of CHE-1 (38). Therefore, we suggest that all of the eight novel ASER-biased genes could be directly regulated by CHE-1 binding to their ASE motifs whereas ins-32 expression is regulated indirectly.
To determine whether the ASE motifs were enriched in the genes expressed in ASE neurons, we examined the frequency of ASE motifs per one kilobase promoter of each gene set categorized by the expression patterns in ASE (Figure 5A). We calculated the frequency by dividing the sum of the number of ASE motifs by the sum of the length of promoters in each gene set. The frequency was higher in the genes expressed in either or both of ASE neurons than those not expressed in ASE neurons or those selected randomly from the microarray probe set (Figure 5A), suggesting that the ASE motif is enriched in the genes expressed in ASE neurons.
Figure 5.

Similar ASE motif organization was observed within each gene set classified by the expression laterality. (A) The occurrence frequency of ASE motifs was high in the genes expressed in ASE neurons. ‘ASEL’, ‘Bilateral’, ‘ASER’ and ‘Neither’ refer to the gene set with corresponding expression in ASE neurons. Genes in the ‘Random’ set were selected randomly from gene spots in the microarray. (B) Most of the ASEL-biased genes had single ASE motifs, whereas many of the other two gene sets had multiple motifs (*P < 0.05; randomization test). Bars refer to the average number of motifs. Genes with no ASE motif were discarded, since they were assumed to be indirectly regulated by CHE-1. (C) No strong correlation was observed between the length of a promoter and the number of motifs per promoter. (D) A was most frequently observed at the fourth nucleotide within the ASE motifs of the promoters with ASEL-biased expression, whereas G was the majority in genes expressed in ASER. (E) T was most frequently observed at the seventh nucleotide in ASEL-biased promoters, whereas no strong preference in nucleotide usage was seen in the promoters with equivalent or ASER-biased expression. (F) Expression laterality in ASE neurons of wild-type nlp-5 promoter and mutant promoter that has ‘ASEL-type’ mutations in ASE motif. Laterality is presented in the same manner as Figure 3.
Since most of the novel ASER-biased genes (6/8) had multiple ASE motifs (Figure 4), we examined the number of motifs in the promoter region of 53 ASE-expressed genes. We observed multiple ASE motifs in 71% of the promoters of ASER-biased genes (12/17) and 61% of the bilateral promoters (17/28), whereas 75% of the ASEL-biased genes (6/8) had only one ASE motif (Figure 5B). The average number of ASE motifs per promoter was 2.47, 2.14 and 1.38 for the ASER-biased genes, the bilateral genes and the ASEL-biased genes, respectively (Figure 5B). Because there was no strong correlation between the promoter length and the number of ASE motifs (Figure 5C), the difference in the motif number did not merely result from the difference in the lengths of the promoters examined. These results suggest that ASEL-biased genes tend to have a single ASE motif, whereas ASER-biased and equivalently expressed genes may harbor multiple ASE motifs. We also observed a unique tendency in the nucleotide usage within individual ASE motifs of ASEL-biased genes. We observed that motifs of ASEL-biased genes preferred to use A and T at the fourth and seventh positions, respectively, whereas both the bilaterally expressed and ASER-biased gene sets used G and N (Figure 5D and E). An alteration of the two ‘ASER-type’ nucleotides at the fourth and seventh positions (G4 and C7) of the ASE motif of nlp-5 promoter to ‘ASEL-type’ (A4 and T7) resulted in the decrease of the expression in the ASER neuron (Figure 5F). This result implies that the two nucleotides affect the expression efficiency in ASER, probably by the alteration of the CHE-1 binding affinity. Altogether, we suggest a common aspect in motif organization for each gene group classified by the expression laterality.
DISCUSSION
Here we showed that transcript extraction from single cells is feasible by a modified mRNA tagging method. This technique can be used in applications from single cells to large tissues, so long as an appropriate promoter is available. The major advantages of this method are its independence of any regulatory factors and applicability to every developmental stage, while limitation to generality of this method would be the requirement of appropriate cell-specific promoters. Since the transcriptional profiling of a small number of cells in C. elegans was so far limited to embryonic cells, our study opened the door to the impartial expression profiling of single cells that differentiate or are even generated post-embryonically.
Although our study successfully identified known and novel genes expressed in the target cells, the true positive rate for the examined positive genes was relatively low (35%; 9/26) compared to our previous study on ciliated sensory neuron profiling (87%; 13/15) (17). However, the true positive rate was improved (60%; 6/10) if we add a third criterion to omit the genes that are detected only twice, probably because of low expression levels. Therefore, the less stringent criteria would yield the identification of more genes with the cost of high false discovery, whereas the more stringent evaluation with additional criteria would yield the more precise set of candidate genes. We should also note that in our analyses the expression was assessed by promoter-fused reporters, which might potentially underestimate the number of genes with genuine subtype-specific expression because of the absence of more distal cis-elements in the selected promoter region.
The likely cause of low true positive rate is the small relative amount of the transcripts from single target cells in the RNA samples, which are probably more affected by the contaminating transcripts from other tissues. In this case, even small systematic difference between the two strains would be comparable to the real differences of gene expression between target cells. For this reason, we examined where the source of the possible contamination might be. We examined the proportion of the genes with reported expression in major tissues such as the body wall muscle, the intestine, the gonad, the hypodermis and the nervous system [583, 1398, 94, 635 and 1164 genes were fetched from WormBase (WS170), respectively], but failed to find any differences significantly higher than chance (P > 0.1; data not shown). However, we speculate the source of contamination in the ASER candidates might be the seam cells, because three genes among the 22 examined ASER candidates were expressed in the seam cells (K06H6.1, C14C6.3 and cnc-4; Supplementary Table S3). If a zinc finger protein dpy-20 gene, a transgenic marker used for the PABP strains, regulates the expression of those epithelial genes, the ASER-specific enrichment of such genes is explained by the difference of dpy-20 expression between the two PABP strains.
Our microarray analysis identified the asymmetrically expressed genes including one receptor-type guanylyl cyclase, three putative neurotransmitter/neuromodulators, and to our surprise, one TRPC channel and four genes with unknown functions. All of the subtype-specific genes known so far were either putative chemoreceptor genes or secreted proteins in ASE neurons. It was also true for the subtype differentiation in the olfactory neuron AWC, whose known difference in gene expression was also limited to that of chemoreceptor genes (39,40). Our study showed that member neurons within a class also differ at the channel repertoire level and probably in other ways as implied by the four genes with unknown functions. Additionally, even though the genes were not categorized to the previously known gene groups, they are regulated by similar mechanisms with previously reported genes. This result strongly supports the notion that a single genetic network controls the whole aspect of the subtype-specification in ASER neurons. One characteristic of our results is that the number of ASER-biased genes was much larger than those biased to ASEL. Because the ASER neuron is thought to be more important than ASEL for chemotaxis by laser-ablation experiments (8), and is a major sensory neuron for integrating external and internal cues (28,41), it may have a number of molecular regulatory mechanisms for the functions, which may require more specifically expressed genes than ASEL.
The promoter motif analysis revealed the unique tendencies regarding the motif organization within the gene groups classified by the expression laterality. Namely, promoters of ASEL-biased genes tended to have only one ASE motif while those of ASER-biased and bilateral genes tended to have multiple motifs, and the nucleotide choice in the motifs was also different between the two groups. Alterations from the ASER-type nucleotides to the ASEL-type within the ASE motif of nlp-5 promoter decreased the expression in ASER neuron (Figure 5F). We speculate that ASER-type nucleotides have higher affinity for CHE-1 binding than ASEL-type. On the other hand, two recent papers reported that enhancing the affinity of single ASE motif changes the ASEL- or ASER-restricted expression to a bilateral pattern, and that multiple ASE motifs within a promoter ensure robust gene expression in these neurons (42,43). We also observed that insertion of one additional ASE motif in gcy-7 promoter could change its ASEL-restricted expression to be less biased (J.T. and Y.I., unpublished observation). Summarizing these observations, the singularity and a tighter consensus sequence of the ASE motif in ASEL-biased promoters might guarantee the lateralized expression to ASEL. In this scenario, we would expect robust expression of ASER-biased promoters, which carry multiple and strong ASE motifs, in the ASEL neuron as well as ASER. However, they are probably repressed in ASEL neurons through cis-acting elements other than the ASE motifs (42).
Our study opened the door to the expression profiling of individual neurons, and revealed that neurons within a single class are much more different than previously considered. With the well-defined 302 neurons, a number of identified cell-specific promoters and techniques for combinatorial expression by two promoters (44,45), the complete catalog of gene expression profiles of individual C. elegans neurons may be feasible in the near future.
SUPPLEMENTARY DATA
Supplementary Data are available at NAR Online.
FUNDING
Grant-in-aid for Scientific Research on Priority Areas ‘Systems Genomics’ (to Y.I.) and for JSPS Fellows (to J.T.) from the Ministry of Education, Culture, Sports, Science and Technology of Japan. Funding for open access charge: Ministry of Education, Culture, Sports, Science and Technology of Japan [Grant-in-aid for Scientific Research (B)].
Conflict of interest statement. None declared.
Supplementary Material
ACKNOWLEDGEMENTS
The authors thank Oliver Hobert for otIs151 animals and insightful discussion, Sawako Yoshina and Shohei Mitani for deletion mutants of nlp genes, Takeshi Ishihara for lin-44::GFP and pPD-Venus plasmids and Andy Fire for pPD49.26 and pPD95.75 vector. The authors also thank Asim Beg, Kouichi Iwasaki, Rex Kerr and the members of Iino lab for useful discussion.
REFERENCES
- 1.The C. elegans Sequencing Consortium. Genome sequence of the nematode C. elegans: a platform for investigating biology. Science. 1998;282:2012–2018. doi: 10.1126/science.282.5396.2012. [DOI] [PubMed] [Google Scholar]
- 2.Brenner S. The genetics of Caenorhabditis elegans. Genetics. 1974;77:71–94. doi: 10.1093/genetics/77.1.71. [DOI] [PMC free article] [PubMed] [Google Scholar]
- 3.White JG, Southgate E, Thomson JG, Brenner S. The structure of the nervous system of the nematode Caenorhabditis elegans. Phil. Trans. R. Soc. Lond. B. 1986;314:1–340. doi: 10.1098/rstb.1986.0056. [DOI] [PubMed] [Google Scholar]
- 4.Malnic B, Hirono J, Sato T, Buck LB. Combinatorial receptor codes for odors. Cell. 1999;96:713–723. doi: 10.1016/s0092-8674(00)80581-4. [DOI] [PubMed] [Google Scholar]
- 5.Cook T, Desplan C. Photoreceptor subtype specification: from flies to humans. Semin. Cell Dev. Biol. 2001;12:509–518. doi: 10.1006/scdb.2001.0275. [DOI] [PubMed] [Google Scholar]
- 6.Johnston RJ, Jr, Chang S, Etchberger JF, Ortiz CO, Hobert O. MicroRNAs acting in a double-negative feedback loop to control a neuronal cell fate decision. Proc. Natl Acad. Sci. USA. 2005;102:12449–12454. doi: 10.1073/pnas.0505530102. [DOI] [PMC free article] [PubMed] [Google Scholar]
- 7.Ortiz CO, Etchberger JF, Posy SL, Frokjaer-Jensen C, Lockery S, Honig B, Hobert O. Searching for neuronal left/right asymmetry: genomewide analysis of nematode receptor-type guanylyl cyclases. Genetics. 2006;173:131–149. doi: 10.1534/genetics.106.055749. [DOI] [PMC free article] [PubMed] [Google Scholar]
- 8.Pierce-Shimomura JT, Faumont S, Gaston MR, Pearson BJ, Lockery SR. The homeobox gene lim-6 is required for distinct chemosensory representations in C. elegans. Nature. 2001;410:694–698. doi: 10.1038/35070575. [DOI] [PubMed] [Google Scholar]
- 9.Suzuki H, Thiele TR, Faumont S, Ezcurra M, Lockery SR, Schafer WR. Functional asymmetry in Caenorhabditis elegans taste neurons and its computational role in chemotaxis. Nature. 2008;454:114–117. doi: 10.1038/nature06927. [DOI] [PMC free article] [PubMed] [Google Scholar]
- 10.Yu S, Avery L, Baude E, Garbers DL. Guanylyl cyclase expression in specific sensory neurons: a new family of chemosensory receptors. Proc. Natl Acad. Sci. USA. 1997;94:3384–3387. doi: 10.1073/pnas.94.7.3384. [DOI] [PMC free article] [PubMed] [Google Scholar]
- 11.Cinar H, Keles S, Jin Y. Expression profiling of GABAergic motor neurons in Caenorhabditis elegans. Curr. Biol. 2005;15:340–346. doi: 10.1016/j.cub.2005.02.025. [DOI] [PubMed] [Google Scholar]
- 12.Colosimo ME, Brown A, Mukhopadhyay S, Gabel C, Lanjuin AE, Samuel AD, Sengupta P. Identification of thermosensory and olfactory neuron-specific genes via expression profiling of single neuron types. Curr. Biol. 2004;14:2245–2251. doi: 10.1016/j.cub.2004.12.030. [DOI] [PubMed] [Google Scholar]
- 13.Etchberger JF, Lorch A, Sleumer MC, Zapf R, Jones SJ, Marra MA, Holt RA, Moerman DG, Hobert O. The molecular signature and cis-regulatory architecture of a C. elegans gustatory neuron. Genes Dev. 2007;21:1653–1674. doi: 10.1101/gad.1560107. [DOI] [PMC free article] [PubMed] [Google Scholar]
- 14.Zhang Y, Ma C, Delohery T, Nasipak B, Foat BC, Bounoutas A, Bussemaker HJ, Kim SK, Chalfie M. Identification of genes expressed in C. elegans touch receptor neurons. Nature. 2002;418:331–335. doi: 10.1038/nature00891. [DOI] [PubMed] [Google Scholar]
- 15.Gaudet J, Mango SE. Regulation of organogenesis by the Caenorhabditis elegans FoxA protein PHA-4. Science. 2002;295:821–825. doi: 10.1126/science.1065175. [DOI] [PubMed] [Google Scholar]
- 16.Portman DS, Emmons SW. Identification of C. elegans sensory ray genes using whole-genome expression profiling. Dev. Biol. 2004;270:499–512. doi: 10.1016/j.ydbio.2004.02.020. [DOI] [PubMed] [Google Scholar]
- 17.Kunitomo H, Uesugi H, Kohara Y, Iino Y. Identification of ciliated sensory neuron-expressed genes in Caenorhabditis elegans using targeted pull-down of poly(A) tails. Genome Biol. 2005;6:R17. doi: 10.1186/gb-2005-6-2-r17. [DOI] [PMC free article] [PubMed] [Google Scholar]
- 18.Roy PJ, Stuart JM, Lund J, Kim SK. Chromosomal clustering of muscle-expressed genes in Caenorhabditis elegans. Nature. 2002;418:975–979. doi: 10.1038/nature01012. [DOI] [PubMed] [Google Scholar]
- 19.Pauli F, Liu Y, Kim YA, Chen PJ, Kim SK. Chromosomal clustering and GATA transcriptional regulation of intestine-expressed genes in C. elegans. Development. 2006;133:287–295. doi: 10.1242/dev.02185. [DOI] [PMC free article] [PubMed] [Google Scholar]
- 20.Von Stetina SE, Watson JD, Fox RM, Olszewski KL, Spencer WC, Roy PJ, Miller DM., 3rd Cell-specific microarray profiling experiments reveal a comprehensive picture of gene expression in the C. elegans nervous system. Genome Biol. 2007;8:R135. doi: 10.1186/gb-2007-8-7-r135. [DOI] [PMC free article] [PubMed] [Google Scholar]
- 21.Mello C, Fire A. DNA transformation. Methods Cell Biol. 1995;48:451–482. [PubMed] [Google Scholar]
- 22.Mello CC, Kramer JM, Stinchcomb D, Ambros V. Efficient gene transfer in C. elegans: extrachromosomal maintenance and integration of transforming sequences. EMBO J. 1991;10:3959–3970. doi: 10.1002/j.1460-2075.1991.tb04966.x. [DOI] [PMC free article] [PubMed] [Google Scholar]
- 23.Finney M, Ruvkun G. The unc-86 gene product couples cell lineage and cell identity in C. elegans. Cell. 1990;63:895–905. doi: 10.1016/0092-8674(90)90493-x. [DOI] [PubMed] [Google Scholar]
- 24.Benjamini Y, Hochberg Y. Controlling the false discovery rate: a practical and powerful approach to multiple testing. J. Roy. Stat. Soc. B Met. 1995;57:289–300. [Google Scholar]
- 25.Hobert O. PCR fusion-based approach to create reporter gene constructs for expression analysis in transgenic C. elegans. Biotechniques. 2002;32:728–730. doi: 10.2144/02324bm01. [DOI] [PubMed] [Google Scholar]
- 26.van Helden J. Regulatory sequence analysis tools. Nucleic Acids Res. 2003;31:3593–3596. doi: 10.1093/nar/gkg567. [DOI] [PMC free article] [PubMed] [Google Scholar]
- 27.Van Gelder RN, von Zastrow ME, Yool A, Dement WC, Barchas JD, Eberwine JH. Amplified RNA synthesized from limited quantities of heterogeneous cDNA. Proc. Natl Acad. Sci. USA. 1990;87:1663–1667. doi: 10.1073/pnas.87.5.1663. [DOI] [PMC free article] [PubMed] [Google Scholar]
- 28.Tomioka M, Adachi T, Suzuki H, Kunitomo H, Schafer WR, Iino Y. The insulin/PI 3-kinase pathway regulates salt chemotaxis learning in Caenorhabditis elegans. Neuron. 2006;51:613–625. doi: 10.1016/j.neuron.2006.07.024. [DOI] [PubMed] [Google Scholar]
- 29.Feng Z, Li W, Ward A, Piggott BJ, Larkspur ER, Sternberg PW, Xu XZS. A C. elegans model of nicotine-dependent behavior: regulation by TRP-family channels. Cell. 2006;127:621–633. doi: 10.1016/j.cell.2006.09.035. [DOI] [PMC free article] [PubMed] [Google Scholar]
- 30.Pierce-Shimomura JT, Dores M, Lockery SR. Analysis of the effects of turning bias on chemotaxis in C. elegans. J. Exp. Biol. 2005;208:4727–4733. doi: 10.1242/jeb.01933. [DOI] [PubMed] [Google Scholar]
- 31.Ward S. Chemotaxis by the nematode Caenorhabditis elegans: identification of attractants and analysis of the response by use of mutants. Proc. Natl Acad. Sci. USA. 1973;70:817–821. doi: 10.1073/pnas.70.3.817. [DOI] [PMC free article] [PubMed] [Google Scholar]
- 32.Chang S, Johnston RJ, Jr, Frokjaer-Jensen C, Lockery S, Hobert O. MicroRNAs act sequentially and asymmetrically to control chemosensory laterality in the nematode. Nature. 2004;430:785–789. doi: 10.1038/nature02752. [DOI] [PubMed] [Google Scholar]
- 33.Chang S, Johnston RJ, Jr, Hobert O. A transcriptional regulatory cascade that controls left/right asymmetry in chemosensory neurons of C. elegans. Genes Dev. 2003;17:2123–2137. doi: 10.1101/gad.1117903. [DOI] [PMC free article] [PubMed] [Google Scholar]
- 34.Hobert O, Tessmar K, Ruvkun G. The Caenorhabditis elegans lim-6 LIM homeobox gene regulates neurite outgrowth and function of particular GABAergic neurons. Development. 1999;126:1547–1562. doi: 10.1242/dev.126.7.1547. [DOI] [PubMed] [Google Scholar]
- 35.Johnston RJ, Jr, Copeland JW, Fasnacht M, Etchberger JF, Liu J, Honig B, Hobert O. An unusual Zn-finger/FH2 domain protein controls a left/right asymmetric neuronal fate decision in C. elegans. Development. 2006;133:3317–3328. doi: 10.1242/dev.02494. [DOI] [PubMed] [Google Scholar]
- 36.Johnston RJ, Hobert O. A microRNA controlling left/right neuronal asymmetry in Caenorhabditis elegans. Nature. 2003;426:845–849. doi: 10.1038/nature02255. [DOI] [PubMed] [Google Scholar]
- 37.Johnston RJ, Jr, Hobert O. A novel C. elegans zinc finger transcription factor, lsy-2, required for the cell type-specific expression of the lsy-6 microRNA. Development. 2005;132:5451–5460. doi: 10.1242/dev.02163. [DOI] [PubMed] [Google Scholar]
- 38.Uchida O, Nakano H, Koga M, Ohshima Y. The C. elegans che-1 gene encodes a zinc finger transcription factor required for specification of the ASE chemosensory neurons. Development. 2003;130:1215–1224. doi: 10.1242/dev.00341. [DOI] [PubMed] [Google Scholar]
- 39.Bauer Huang SL, Saheki Y, VanHoven MK, Torayama I, Ishihara T, Katsura I, van der Linden A, Sengupta P, Bargmann CI. Left-right olfactory asymmetry results from antagonistic functions of voltage-activated calcium channels and the Raw repeat protein OLRN-1 in C. elegans. Neural Dev. 2007;2:24. doi: 10.1186/1749-8104-2-24. [DOI] [PMC free article] [PubMed] [Google Scholar]
- 40.Troemel ER, Chou JH, Dwyer ND, Colbert HA, Bargmann CI. Divergent seven transmembrane receptors are candidate chemosensory receptors in C. elegans. Cell. 1995;83:207–218. doi: 10.1016/0092-8674(95)90162-0. [DOI] [PubMed] [Google Scholar]
- 41.Ikeda DD, Duan Y, Matsuki M, Kunitomo H, Hutter H, Hedgecock EM, Iino Y. CASY-1, an ortholog of calsyntenins/alcadeins, is essential for learning in Caenorhabditis elegans. Proc. Natl Acad. Sci. USA. 2008;105:5260–5265. doi: 10.1073/pnas.0711894105. [DOI] [PMC free article] [PubMed] [Google Scholar]
- 42.Etchberger JF, Flowers EB, Poole RJ, Bashllari E, Hobert O. Cis-regulatory mechanisms of left/right asymmetric neuron-subtype specification in C. elegans. Development. 2009;136:147–160. doi: 10.1242/dev.030064. [DOI] [PMC free article] [PubMed] [Google Scholar]
- 43.O'M;eara MM, Bigelow H, Flibotte S, Etchberger JF, Moerman DG, Hobert O. Cis-regulatory mutations in the Caenorhabditis elegans homeobox gene locus cog-1 affect neuronal development. Genetics. 2009;181:1679–1686. doi: 10.1534/genetics.108.097832. [DOI] [PMC free article] [PubMed] [Google Scholar]
- 44.Davis MW, Morton JJ, Carroll D, Jorgensen EM. Gene activation using FLP recombinase in C. elegans. PLoS Genet. 2008;4:e1000028. doi: 10.1371/journal.pgen.1000028. [DOI] [PMC free article] [PubMed] [Google Scholar]
- 45.Macosko EZ, Pokala N, Feinberg EH, Chalasani SH, Butcher RA, Clardy J, Bargmann CI. A hub-and-spoke circuit drives pheromone attraction and social behaviour in C. elegans. Nature. 2009;458:1171–1175. doi: 10.1038/nature07886. [DOI] [PMC free article] [PubMed] [Google Scholar]
Associated Data
This section collects any data citations, data availability statements, or supplementary materials included in this article.