

Abstract
Family studies of exceptional longevity can potentially identify genetic and other factors contributing to long life and healthy aging. Although such studies seek families that are exceptionally long lived, they also need living members who can provide DNA and phenotype information. On the basis of these considerations, the authors developed a metric to rank families for selection into a family study of longevity. Their measure, the family longevity selection score (FLoSS), is the sum of 2 components: 1) an estimated family longevity score built from birth-, gender-, and nation-specific cohort survival probabilities and 2) a bonus for older living siblings. The authors examined properties of FLoSS-based family rankings by using data from 3 ongoing studies: the New England Centenarian Study, the Framingham Heart Study, and screenees for the Long Life Family Study. FLoSS-based selection yields families with exceptional longevity, satisfactory sibship sizes and numbers of living siblings, and high ages. Parameters in the FLoSS formula can be tailored for studies of specific populations or age ranges or with different conditions. The first component of the FLoSS also provides a conceptually sound survival measure to characterize exceptional longevity in individuals or families in various types of studies and correlates well with later-observed longevity.
Keywords: aged, 80 and over; family data; longevity; Shannon information
Exceptional longevity strongly aggregates in families (1–4). Thus, studies of exceptionally long-lived families have the potential to identify genetic variants and other factors contributing to longevity, particularly factors that are too rare to detect in a population-based study (5, 6). Both a family's exceptionality of survival and its number of living siblings contribute to its value for a genetic study of longevity. A challenge in selecting families for such studies is that the most long-lived individuals may have few or no living siblings to provide DNA and other biologic material. To select families for a study of environmental and genetic factors contributing to longevity, we developed the family longevity selection score (FLoSS). The FLoSS combines a measure of the exceptionality of a family's survival with a bonus for the presence of living old members; it is computed from information that can be collected relatively easily from an immediate family member.
We compare the FLoSS with an alternative scoring method, the family risk score (FRS). The FRS generalizes the family history score (7) to quantitative phenotypes, creating an average score among family members adjusted for the distribution of the phenotype in the general population (8, 9). We compare the FLoSS and FRS with regard to characteristics of sibships that would be selected by choosing the highest scoring sibships according to the following: sibship size, numbers of living siblings, mean age, and exceptionality of sibship survival. We compare these characteristics in 2 US populations selected for longevity (the Long Life Family Study and the New England Centenarian Study) and in 1 not selected for longevity (the Framingham Heart Study), a geographically based US cohort.
MATERIALS AND METHODS
Metric of estimated survival exceptionality for a family
We define both a family measure of survival exceptionality that requires knowing the age at death of all members and a method for estimating this measure when all family members have not yet died.
We characterize an individual's “exceptionality of longevity” at age A via p(A), the probability that a random person in the same birth cohort survives to at least age A. We use , the information content of the rarity of survival measured by “Shannon information” (10), as the basis for an individual's exceptionality score. The increment in this function for each additional year of survival rises with age. For example, the increase in its value for survival past age 96 years versus 95 years is far greater than the increase for survival past age 71 years versus age 70 years.
The probability of survival past age A varies by cohort as specified by year, country of birth, and gender. For example, on the basis of the US Social Security Administration cohort life tables (http://www.ssa.gov/OACT/NOTES/as116/as116LOT.html), the same age can produce very different exceptionality scores: 2.7 = –ln(0.065) for a woman aged 95 years born in 1910 versus 4.2 = –ln(0.015) for a man aged 95 years born in 1900. Specifically, an individual's exceptionality score at age A is –ln(p(A|C)), where p(A|C) is the probability of survival past age A for those born into that person's country-, birth year-, and gender-specific cohort C. Of course, exceptionality of longevity is fully observed only at death.
We next wished to measure the family's survival exceptionality. Note that simply summing the –ln(p) values for individuals cannot be correct, because these are always positive; thus, each additional family member, even one who dies at a young age, would increase the score. Clearly, a family of 2, both living at age 95, is more exceptional than a family of 3, with 2 still living at age 95 plus one who died at age 65. This suggests that each person's score should be of the form, –ln(p) − k, where k is chosen so that the expected value of the score for a randomly selected person is 0. In that case, a family member for whom –ln(p) exceeds k increases the family's longevity exceptionality, while one who dies younger subtracts. The desired value of k is 1 because, for each cohort, the probabilities p in a life table are uniformly distributed on the interval from 0 to 1, and the integral (i.e., mean value) of –ln(p) over this interval is 1. Thus, we choose to measure each member's survival exceptionality for including in a family score, defined as follows:
in which all A’s are ages at death.
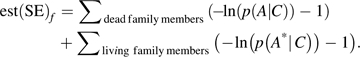
For a living person of age A, we can calculate A*, an expected age at death calculated from life tables. Specifically, A* is a cohort-specific expected age at death, conditional on survival to age A; then, –ln(p(A*|C)) is an estimated measure of the person's exceptionality of survival. Because exceptional longevity is strongly familial (1, 2, 4–6), those with long-lived siblings are likely to live longer than life-table calculations suggest. (In this sense, −ln(p(A*|C)) is a conservative estimate of expected exceptionality in families of interest in longevity studies.) This leads to the following estimated survival exceptionality for a family f, in which each member's contribution increases the family score only if for dead members or for living members exceeds 1:
 |
Metric incorporating the added value of old living family members
The score “” can be computed with any mix of living and dead family members. For families with living members, it is a plausible current estimate of , the family's (ultimate) survival exceptionality. When all have died, it equals . Although should be useful for many purposes, it may not be ideal for selecting families into a study of familial longevity, because it does not particularly value additional older living siblings, who provide more biologic and phenotypic data. Thus, we add a living siblings’ bonus score that satisfies the following principles:
Living family members whose age A is already somewhat exceptional, in the sense that is greater than 0, should add to the family's value for genetic studies on exceptional survival beyond the value already captured in their contribution to .
The amount of added value conferred by these living family members should be a function of , where A is their current age, rather than their expected age at death (A*), since only survival through age A is certain.
Living family members who are still so young that is negative should neither add to nor subtract from the bonus.
This leads us to define the following living sibling bonus:
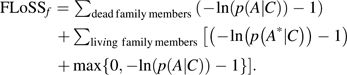
Adding this to produces our family longevity selection score, or FLoSS:
 |
To illustrate the FloSS calculation, consider a sibship with an oldest brother born in 1920 and died (at age 88) in 2008, while 2 other siblings remain living at the end of 2008: a brother born in 1921 (aged 87 years) and a sister in 1930 (aged 78 years). The US Social Security Administration cohort life tables indicate that only about 12.2% of the brothers’ cohort (males born between 1916 and 1925) lives past 88 and 14.3% lives past 87, while 57.4% of the females of the sister's cohort (born between 1926 and 1935) lives past 78. Furthermore, the living brother is expected to achieve age A* = 91, while the sister's A* is 88. The FLoSS is the sum of their 3 scores. Note that −ln(0.122) − 1 = 2.104 − 1 = 1.104 is the score for the dead sibling, while for each of the 2 living siblings the score is computed as + . From the US cohort tables, , while so that . Similarly, , while and . These values lead to an est(SE) for the sibship of 3.042 = 1.104 + 1.685 + 0.253, a living siblings’ bonus of 0.942 + 0, and a FLoSS of 3.984. Additional sibships with various survival patterns and high FLoSS scores are described and illustrated in supplementary material (Web Figure 1). (This information is posted on the Journal’s website (http://aje.oxfordjournals.org/).)
Figure 1.

Characteristics of Long Life Family Study sibships in 2007 as ranked by the family longevity selection score (FLoSS) (A) and the family risk score (FRS) (B). These plots show the relation between the percentile ranking of the sibships screened for the Long Life Family Study based on the estimated survival exceptionality, est(SE), on the y axis and the percentile ranking based on the family longevity selection score on the x axis of part A and the family risk score on the x axis of part B. Diagonal lines represent least-square regression lines and 95% confidence bounds. Note that the 3 lines essentially overlap in the plot of part A.
An additional consideration is whether to exclude from scoring those family members who died before some age A0 and, if so, what age. Factors to consider include the quality of data on deaths in infancy and the survival phenotype of principal interest, for example, survival from birth, survival conditional on reaching maturity, or survival conditional on reaching a specified older age. In the Long Life Family Study, given our focus on exceptional familial survival over the life span, we calculated survival conditional on reaching age 40 (rather than a younger age), on the basis of several considerations. First, in the early 20th century, deaths below age 2 were often not recorded. Furthermore, in our study cohorts, infectious disease epidemics and wars were prominent contributors to mortality in infancy, adolescence, and early maturity. Moreover, the role of familial factors in survival below age 40 is unclear (2). Hence, we calculated in our analyses as the “probability of survival to age A, conditional upon survival to age A0 = 40.” We computed this from population birth cohort life tables, using only the subjects alive at age 40 as the referent population. We provide gender- and US birth cohort-specific scores for those who survived to at least age 40 in the online supplementary material (Web Table 1; refer to the Journal’s website) and on the Long Life Family Study website (https://longlifefamilystudy.wustl.edu/FLoSS).
Table 1.
Age and Size Distributions of Low- and High-ranked Sibship Cohorts in the Long Life Family Study, by Ranking Method, in 2007a
| Siblings Included and Ranking Method | Sibship Age, years |
|||||
| Lowest Ranked 40% |
Highest Ranked 5% |
|||||
| Mean | Median | % >90 Years | Mean | Median | % >90 Years | |
| All | ||||||
| FLoSS | 80.6 | 81.0 | 6 | 92.8 | 92.5 | 67 |
| FRS | 78.9 | 79.5 | 0 | 99.9 | 99.0 | 100 |
| Living only | ||||||
| FLoSS | 85.0 | 85.0 | 16 | 95.8 | 95.8 | 87 |
| FRS | 84.8 | 84.5 | 13 | 100.0 | 100.0 | 100 |
| Sibship Size, no. | ||||||
| Lowest Ranked 40% | Highest Ranked 5% | |||||
| Mean | Median | % >1 Sibling | Mean | Median | % >1 Sibling | |
| All | ||||||
| FLoSS | 3.0 | 3.0 | 75 | 5.3 | 5.0 | 95 |
| FRS | 4.0 | 4.0 | 91 | 1.3 | 1.0 | 20 |
| Living only | ||||||
| FLoSS | 1.7 | 1.0 | 44 | 3.0 | 3.0 | 79 |
| FRS | 2.4 | 2.0 | 64 | 1.0 | 1.0 | 3 |
Abbreviations: FLoSS, family longevity selection score; FRS, family risk score.
Summary statistics of size and age of sibships ranked in the lowest 40% and the top 5% by the FLoSS or the FRS in the Long Life Family Study. In each of the 4 pairs of rows, the first describes sibships as ranked by the FLoSS and the second, by the FRS. Age statistics describe the average achieved ages (either age at death or current age), for either all siblings or only living ones, as indicated, in the included sibships. All differences in sibship age and size for the FRS versus FLoSS top groups were significant (P < 0.001; Wilcoxon test).
Regarding the actual or expected ages at death required for individuals to make a positive contribution to this score, we note that , so that is only greater than 0 when p is smaller than 0.37, so that a positive score is achieved only when longevity exceeds the 63rd percentile for members of the same gender/birth year cohort who survived until at least age 40. In the 1900 birth cohort, for example, this corresponds to 77 years for males and 87 for females.
Comparing the FLoSS and the FRS
A FRS can be generated for quantitative phenotypes, adjusting for family size and the distribution of the phenotype in the general population (8, 9). When applied to longevity in sibships, the FRS is the average over all siblings in a family of their individual scores, S, where:
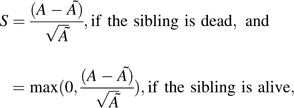 |
where A denotes the current age (or age at death) of the sibling, and  is the sex/birth year cohort-adjusted life expectancy of that sibling. Note that, in long-lived sibships, each still-living but younger-than-average sibling pulls the FRS toward 0. In addition, the FRS scores a family with 2 exceptional siblings identically to a family with 4 or 8 siblings, each pair of which is just as exceptional as the 2.
Characteristics of populations used to compare FLoSS and FRS
We calculated these scores in 3 sibship samples. Only the first 2 are enriched for longevity.
Sample 1: 660 sibships from the New England Centenarian Study—a nationwide-based sample of centenarians, their siblings, and offspring. In all selected sibships, the proband was aged ≥100 years. In 2005, 49% of all siblings were still living, 33% of the sibships contained at least 1 living member, and the average attained age was 91 years.
Sample 2: 1,671 US sibships from the screening pilot phase of the Long Life Family Study—a US–Danish study of long-lived sibships and their offspring (https://longlifefamilystudy.wustl.edu/). Sibships of living probands who were at least 80 years of age were screened in the US component of the Long Life Family Study. In 2007, 58% of all siblings were still living, all sibships contained at least 1 living member (the proband who provided data on the other siblings), and the average age was 83 years.
Sample 3: 766 sibships from the Framingham Heart Study (11)—a sample of longitudinally followed subjects and their families. The Framington Heart Study has enrolled subjects born from 1888 onward; all our sibships had at least 1 sibling born before 1925. In 2004, 13% of all siblings were still living, 21% of the sibships contained at least 1 living member, and the average attained age was 74 years.
Cohort, survivorship, and sibship data
For the New England Centenarian Study, Framington Heart Study, and Long Life Family Study sibships, we estimated gender/birth-year survival functions and calculated the expected age at death (A*) using the Social Security Administration cohort life tables for successive birth decades, with the 1900 tables for births from 1895 through 1904, the 1910 tables for births from 1905 through 1914, and so on. These tables are available at http://www.ssa.gov/OACT/NOTES/as116/as116LOT.html. In the Long Life Family Study data, siblings with unknown vital status were considered to be dead, with the age at death given (conservatively) as the age at last contact. For an unknown birth year, we used the youngest sibling's birth year. Both siblings and half-siblings were included in FLoSS score calculations.
Statistical analysis
We estimated Spearman correlations between the percentile ranking based on and the FLoSS and FRS. We used summary statistics to illustrate differences between sibships in the lowest 40 percentile groups and in the top 5%, as defined by each score, and Wilcoxon and t statistics to test for their significance. Reported P values are 2 sided.
RESULTS
As shown in Figure 1, the percentile ranking of families screened for the Long Life Family Study based on , the estimated “survival exceptionality,” is more strongly correlated with the rankings based on the FLoSS (r = 0.98) (Figure 1A) than with those based on the FRS (r = 0.71) (Figure 1B). As seen in Table 1, the sibships ranked in the top 5% by the FLoSS and FRS have quite different characteristics. Sibships ranked in the top 5% by the FRS average between 4 and 7 years older but are far smaller than those ranked in the top 5% by the FLoSS. Note that 79% of the sibships ranked in the top 5% by the FLoSS have more than 1 living sibling compared with only 3% of the sibships ranked in the top 5% by the FRS.
Figure 2 shows the distribution of the FLoSS and FRS in the sibships of the Framington Heart Study (left), the Long Life Family Study (middle), and the New England Centenarian Study (right). For comparability, the FLoSS and FRS scores in the Long Life Family Study and the New England Centenarian Study are each standardized to their distributions in the Framington Heart Study, a sample that is not enriched for longevity. In contrast, the New England Centenarian Study recruited families with centenarians, resulting in a strongly shifted distribution of the standardized FLoSS scores. The FLoSS distribution for the Long Life Family Study screening population is intermediate, because it includes families with some evidence of longevity. The standardized FRS score distributions also shift to the right in the Long Life Family Study and New England Centenarian Study. Indeed, all 3 cohort pairs differ in score distributions (all P < 0.001; Wilcoxon test). However, the FLoSS distinguishes the populations far more sharply. Note that less than 1% of Framington Heart Study sibships have a FLoSS of >7 (standardized FLoSS, >4.95). To focus on unusually long-lived families, the Long Life Family Study enrolled only families with a FLoSS of 7 or more.
Figure 2.

Distribution of the standardized family longevity selection score (S-FLoSS) and the standardized family risk score (S-FRS) for sibships from the Framingham Heart Study (FHS), the Long Life Family Study (LLFS) screenees, and the New England Centenarian Study (NECS). S-FLoSS is defined as (FLoSS − M)/S, where M = −0.24 and S = 1.47 are, respectively, the mean and standard deviation of FLoSS scores in the FHS cohort. S-FRS is defined analogously (i.e., as a z score in the same cohort, with M = 1.98 and S = 1.30). Parameters μ and σ in each panel are the mean and standard deviation of standardized scores. Dashed lines represent the standard normal density, and dotted lines represent the normal density with mean and standard deviation of the S-FLoSS and S-FRS. The S-FLoSS values for the LLFS and NECS sibships are significantly different from the S-FLoSS values for the FHS sibships (P < 0.0000; Wilcoxon test). Similarly, the S-FRS values for the LLFS and NECS sibships are significantly different from the S-FRS values for the FHS sibships (P < 0.0000; Wilcoxon test).
We also examined the degree to which the FLoSS and estimated survival exceptionality score predict actual survival exceptionality (SEf), observed only after all have died. For those 442 sibships of the New England Centenarian Study in which at least 1 sibling was alive in 1995 but all had died by 2004, we computed the FLoSS using data known in 1995 and the (fully observed) SEf in 2004. The scatterplot in Figure 3 shows the relation between the sibships’ rankings based on the 2004 SEf (y axis) and those based on the FLoSS and on the estimated survival exceptionality longevity score, , in 1995. The ranking based on the FLoSS and on in 1995 correlates equally strongly with the ranking based on the SEf measured a decade later (both r = 0.90).
Figure 3.

Rankings for survival exceptionality versus family longevity selection score (FLoSS) and estimated survival exceptionality (est(SE)) among 442 New England Centenarian Study sibships with final survivors’ deaths within 10 years after 1995. For each of the 442 New England Centenarian Study sibships with at least 1 living member in 1995 and none in 2004, an open circle relates its percentile ranking based on observed survival exceptionality in 2004 on the y axis to its 1995 family longevity selection score percentile ranking on the x axis. Stars show the same relation for a sibship's percentile ranking based on survival exceptionality in 2004 (on the y axis) and percentile ranking based on its 1995 estimated survival exceptionality on the x axis.
DISCUSSION
A sibship's FLoSS is a good predictor of its true (not yet fully known) exceptionality of survival. Thus, it is useful for selecting long-lived families for studies of genetic and nongenetic factors contributing to longevity. In particular, the FLoSS can identify desirable sibships among families being screened for genetic epidemiologic studies of exceptional longevity. Sibships with a high FLoSS have high ages of the total sibship and of living siblings, as well as high numbers of total and living members.
A high FLoSS can be achieved by the presence of a single individual with extremely long survival (if the other siblings are not short lived) or by the presence of many long (but not extremely)-lived siblings. The modes of transmission of longevity (if any) associated with these types of patterns may differ. For example, the former might reflect a recessive trait; the latter, a dominant. The fact that a high FLoSS value captures both of these patterns is one of its strengths, because it does not exclude longevous families who might not be ascertained by other methods (e.g., setting a single extremely exceptional age for inclusion of individuals or siblings). However, the additional potential heterogeneity of genetic factors captured in high-FLoSS families implies a need for attention to potential differences among subgroups in genetic transmission.
We used the FLoSS to score families defined as members of a single sibship. Although it could be used to score multigenerational groups of relatives, gathering complete information on the parents of old siblings or on widely dispersed groups of near relatives could be challenging. Furthermore, young people contribute little information regarding ultimate survival.
In the Long Life Family Study, we set the minimum FLoSS for a family to be eligible at 7. This threshold was chosen by observing that only 0.2% of the FLoSS sibships of the Framington Heart Study meet this threshold, in contrast to over 30% of the Long Life Family Study screening families and over 40% of families enrolled in the New England Centenarian Study. Thus, families with a FloSS as large as 7 are extremely rare but findable. Calculation of FLoSS scores in families from additional population-based samples can provide further guidance about appropriate selection thresholds.
The FLoSS is the sum of and LBf (the living bonus). Its first component is a current estimate of a family's ultimate, “fully observed,” survival exceptionality, SEf. Although the living bonus enables the FLoSS to select families that are more desirable for genetic epidemiologic studies of exceptional longevity, may be a better intrinsic measure of family longevity. As such, may be particularly useful for examining relations of genotypes and other risk factors to phenotypes of family members and their family's exceptionality of survival, or for finding subsets of populations that are similar with respect to the exceptionality of their families. Although in our comparison the FLoSS and correlated equally well with the observed SEf 10 years later, this may not apply over longer intervals. Note that, when all family members have died, all 3 measures coincide.
The FLoSS as used in the Long Life Family Study can be viewed as a member of a class of family scores that combine an estimated exceptionality of survival with a bonus for living siblings, as in the following:
where is of the form,
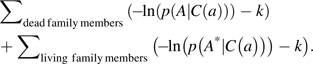 |
Here, w and k are nonnegative constants, C(a) is a person-specific reference cohort of those born around the same time who survived to some minimum age, a, and LBf is a nonnegative bonus for older living siblings. Each parameter can be tailored to the particular needs of other studies.
For the FLoSS, we chose w = 1, C(a) = all people in the same birth-year, gender, and national cohort who survived to at least age 40, k = 1, and
An age threshold other than 40 years could be chosen depending on a study's focus (e.g., age 70 to study factors influencing survival only in advanced age). Choosing w = 1 weights the estimated survival exceptionality and living bonus equally; w = 0 yields , a measure of family survival exceptionality alone. Note that the expected value of for a “pseudofamily” constructed by grouping N randomly selected individuals from the US population is N × (1 – k). Choosing k = 1 makes neutral to sibship size, because its expected value should be 0 for randomly selected (not particularly long-lived) people. The “neutrality” of the FLoSS was validated by the fact that its average in the geography-based Framingham Heart Study cohort was quite close to 0. Because –ln(0.37) is approximately equal to 1, only ages in the top 37th percentile add to . More generally, values of k smaller than 1 favor larger families (because each “typical” person's expected score is positive), while choosing k larger than 1 favors smaller ones. If greater exceptionality is sought, a larger cutoff for the FLoSS could be used.
We chose w = 1, giving equal weight to the estimated exceptionality score and the “bonus” for living older family members. This reflected our interest in both survival exceptionality and the availability of old living study subjects. With this choice, the FLoSS still correlates strongly with as we wanted. Larger w’s will give more weight to the living bonus and reduce the correlation with .
In summary, we have introduced and examined the consequences of a conceptually attractive framework for family longevity studies. These include 1) a measure of an individual's exceptionality of survival, 2) a feasible way to estimate that exceptionality for those still alive, 3) a size-neutral way to combine individual scores into a family score, 4) a plausible bonus measure for the additional value of already exceptional living family members, and 5) a way to balance interest in older living relatives and family survival exceptionality in a single score such as the FLoSS. This framework should be useful in many settings. We also note that formulas for the FLoSS and could be adapted to measure exceptionality of survival until other events besides death. Thus, we could quantify family risk for the onset of conditions (such as stroke or onset of diabetes or disability) whose incidence rises with age. We are investigating this idea.
Supplementary Material
Acknowledgments
Author affiliations: Department of Biostatistics, Boston University School of Public Health, Boston, Massachusetts (Paola Sebastiani); Division of Geriatrics and Clinical Gerontology, National Institute on Aging, Bethesda, Maryland (Evan C. Hadley, Winifred Rossi); Department of Biostatistics, Washington University, St. Louis, Missouri (Michael Province); the Danish Aging Research Center, Institute of Public Health, University of Southern Denmark, Odense, Denmark (Kaare Christensen); Geriatrics Division, Department of Medicine, Boston University Medical Center, Boston, Massachusetts (Thomas Perls); and Health Care Research Unit, Section of General Internal Medicine, Department of Medicine, Boston University School of Medicine, Boston, Massachusetts (Arlene S. Ash).
Funded by grants U01AG023755 (P. S., T. P., A. S. A.), U01AG023746 (M. P.), and U01AG023712 (K. C.). The Framingham Heart Study is conducted and supported by the National Heart, Lung, and Blood Institute in collaboration with Boston University.
The authors thank the staff and investigators of the Framingham Heart Study for providing access to their data.
This article was not prepared in collaboration with investigators of the Framingham Heart Study and does not necessarily reflect the opinions or views of the Framingham Heart Study, Boston University, or the National Heart, Lung, and Blood Institute.
Conflict of interest: none declared.
Glossary
Abbreviations
- FLoSS
family longevity selection score
- FRS
family risk score
References
- 1.Kerber RA, O'Brien E, Smith KR, et al. Familial excess longevity in Utah genealogies. J Gerontol A Biol Sci Med Sci. 2001;56(3):B130–B139. doi: 10.1093/gerona/56.3.b130. [DOI] [PubMed] [Google Scholar]
- 2.Perls TT, Wilmoth J, Levenson R, et al. Life-long sustained mortality advantage of siblings of centenarians. Proc Natl Acad Sci U S A. 2002;99(12):8442–8447. doi: 10.1073/pnas.122587599. [DOI] [PMC free article] [PubMed] [Google Scholar]
- 3.Willcox BJ, Willcox DC, He Q, et al. Siblings of Okinawan centenarians share lifelong mortality advantages. J Gerontol A Biol Sci Med Sci. 2006;61(4):345–354. doi: 10.1093/gerona/61.4.345. [DOI] [PubMed] [Google Scholar]
- 4.Gudmundsson H, Gudbjartsson DF, Frigge M, et al. Inheritance of human longevity in Iceland. Eur J Hum Genet. 2000;8(10):743–749. doi: 10.1038/sj.ejhg.5200527. [DOI] [PubMed] [Google Scholar]
- 5.Christensen K, Johnson TE, Vaupel JW. The quest for genetic determinants of human longevity: challenges and insights. Nat Rev Genet. 2006;7(6):436–448. doi: 10.1038/nrg1871. [DOI] [PMC free article] [PubMed] [Google Scholar]
- 6.Perls T, Kunkel L, Puca A. The genetics of aging. Curr Opin Genet Dev. 2002;12(3):362–369. doi: 10.1016/s0959-437x(02)00310-6. [DOI] [PubMed] [Google Scholar]
- 7.Williams RR, Hunt SC, Barlow GK, et al. Health family trees: a tool for finding and helping young family members of coronary and cancer prone pedigrees in Texas and Utah. Am J Public Health. 1988;78(10):1283–1286. doi: 10.2105/ajph.78.10.1283. [DOI] [PMC free article] [PubMed] [Google Scholar]
- 8.Li R, Bensen JT, Hutchinson RG, et al. Family risk score of coronary heart disease (CHD) as a predictor of CHD: the Atherosclerosis Risk in Communities (ARIC) Study and the NHLBI Family Heart Study. Genet Epidemiol. 2000;18(3):236–250. doi: 10.1002/(SICI)1098-2272(200003)18:3<236::AID-GEPI4>3.0.CO;2-0. [DOI] [PubMed] [Google Scholar]
- 9.Pereira MA, Schreiner PJ, Pankow JS, et al. The family risk score for coronary heart disease associations with lipids, lipoproteins, and body habitus in a middle-aged bi-racial cohort: the ARIC Study. Ann Epidemiol. 2000;10(4):239–245. doi: 10.1016/s1047-2797(99)00056-3. [DOI] [PubMed] [Google Scholar]
- 10.Shannon CE. The mathematical theory of communication. 1963. MD Comput. 1997;14(4):306–317. [PubMed] [Google Scholar]
- 11.Brand FN, Kiely DK, Kannel WB, et al. Family patterns of coronary heart disease mortality: the Framingham Longevity Study. J Clin Epidemiol. 1992;45(2):169–174. doi: 10.1016/0895-4356(92)90009-c. [DOI] [PubMed] [Google Scholar]
Associated Data
This section collects any data citations, data availability statements, or supplementary materials included in this article.