

Abstract
Motivation: Reconstructing gene networks from microarray data has provided mechanistic information on cellular processes. A popular structure learning method, Bayesian network inference, has been used to determine network topology despite its shortcomings, i.e. the high-computational cost when analyzing a large number of genes and the inefficiency in exploiting prior knowledge, such as the co-regulation information of the genes. To address these limitations, we are introducing an alternative method, knowledge-driven matrix factorization (KMF) framework, to reconstruct phenotype-specific modular gene networks.
Results: Considering the reconstruction of gene network as a matrix factorization problem, we first use the gene expression data to estimate a correlation matrix, and then factorize the correlation matrix to recover the gene modules and the interactions between them. Prior knowledge from Gene Ontology is integrated into the matrix factorization. We applied this KMF algorithm to hepatocellular carcinoma (HepG2) cells treated with free fatty acids (FFAs). By comparing the module networks for the different conditions, we identified the specific modules that are involved in conferring the cytotoxic phenotype induced by palmitate. Further analysis of the gene modules of the different conditions suggested individual genes that play important roles in palmitate-induced cytotoxicity. In summary, KMF can efficiently integrate gene expression data with prior knowledge, thereby providing a powerful method of reconstructing phenotype-specific gene networks and valuable insights into the mechanisms that govern the phenotype.
Contact: krischan@msu.edu
Supplementary information: Supplementary data are available at Bioinformatics online.
1 INTRODUCTION
Cellular activities are believed to be coordinately regulated by genes and proteins that function in complex networks. Disease states ensue upon abnormal regulation of cellular activities. Reconstructing the gene networks that give rise to the different phenotypes may provide insights into the cellular mechanisms involved (Said et al., 2004; Srivastava et al., 2007). Biological networks of protein–protein interaction (Han, 2008), metabolic pathways (Ravasz et al., 2002) and transcriptional regulation (Ihmels et al., 2002) are modular in structure, enabling mutations to be isolated to specific modules without affecting the overall viability of the system (Jeong et al., 2000; Thieffry and Romero, 1999; Yook et al., 2004). Since organized modularity is ubiquitous in biological systems, identifying the gene modules and their interplay in a modular network should help to provide insights into the differential mechanisms involved in normal versus disease states.
Previously we identified that saturated free fatty acid (FFA), e.g. palmitate, induced cytotoxicity in liver cells, while unsaturated FFAs, e.g. oleate and linoleate, were not significantly cytotoxic (Li et al., 2007a, b; Srivastava and Chan, 2007; Yang and Chan, 2009). Palmitate-induced cytotoxicity of liver cells has been implicated in the pathogenesis of many obesity-related metabolic disorders, such as fatty liver disease, non-alcoholic steatohepatitis (NASH) and non-alcoholic fatty liver disease (NAFLD) (Farrell and Larter, 2006; Scheen and Luyckx, 2002). Tumor necrosis factor (TNF)-α, a proinflammatory cytokine often is involved, along with elevated FFA, in these diseases (Bruce and Dyck, 2004), and further potentiates the cytotoxicity induced by palmitate (Li et al., 2007b; Srivastava and Chan, 2007; Srivastava et al., 2007). To study the multi-faceted effects of palmitate and provide insights into potential mechanism of saturated FFA-induced alterations, we obtained gene expression profiles of hepatocellular carcinoma (HepG2) cells upon exposure to different FFAs and TNF-α, and applied a module-based gene network reconstruction method that integrates prior knowledge and phenotypic information. The proposed methodology consists of two phases. The first phase, the ‘gene selection phase’, selects a subset of genes that are relevant to the phenotype, palmitate-induced cytotoxicity, using a mixture regression model. The second phase, the ‘network reconstruction phase’, clusters the selected genes into modules, and reconstructs a module network based upon the interactions between the modules.
Selecting the genes that are potentially relevant to the desired metabolic/phenotypic response of the cells can be viewed as a feature selection problem (Ressom et al., 2008; Saeys et al., 2007), which is extensively studied in machine learning (Bhaskar et al., 2006; Inza et al., 2004). Most feature selection methods, such as the Wilcoxon's rank sum test (Troyanskaya et al., 2002) and Fisher's Discriminant Analysis (FDR; Chan et al., 2003), are data driven, and thus susceptible to the noise level of the microarray data. One strategy to ameliorate this problem is to incorporate domain knowledge and functional information of the genes (Phillip et al., 2004). Typically these knowledge-based methods qualitatively incorporate the prior knowledge in post-processing the genes that are selected by the data-driven approaches. In the present work, we address this limitation with a Bayesian mixture regression model that quantitatively incorporates the prior knowledge of the gene functions, upfront, in the gene-selection phase (see Supplementary Methods for details). By this process 250 genes are selected.
Clustering methods, such as Self Organizing Map (Toronen et al., 1999; Yin et al., 2006), hierarchical clustering (Eisen et al., 1998) and K-means (Ma et al., 2005), commonly used to identify gene modules, cannot uncover the interactions among the modules or clusters. To address this limitation, several studies integrated clustering methods with structure learning algorithms, such as graphical Gaussian modeling and Bayesian network learning (Li and Chan, 2004; Segal et al., 2003; Toh and Horimoto, 2002). These approaches are predominantly data-driven and thus susceptible to noise in the expression data, and suffer from the sparse data problem associated with limited number of experimental conditions (Husmeier, 2003; Yu et al., 2004).
Previous studies recognized the importance of exploiting prior knowledge in reconstructing networks with sparse and noisy expression data (Bar-Joseph et al., 2003; Berman et al., 2002; Hartemink et al., 2002; Ideker et al., 2001; Ihmels et al., 2002; Li and Yang, 2004; Pilpel et al., 2001). Similarly, we developed a framework based on knowledge-driven matrix factorization, termed KMF, to exploit the domain knowledge and reconstruct modular gene networks. This framework views the gene network reconstruction as a matrix factorization problem. In brief, the pairwise correlation coefficients between any two genes are computed from their expression data and used to construct a correlation matrix. This correlation matrix is decomposed into a product of three matrices, from which the gene modules and module interaction information are extracted. During this process, the Gene Ontology (GO) information is introduced as regularization in matrix factorization, which affects the decomposed matrices and eventually the derived gene modules and interaction among modules. Compared with the existing approaches for gene network reconstruction, the key features of the proposed KMF framework are: (i) derives both the gene modules and their interactions from a combination of expression data and GO information; (ii) incorporates the prior knowledge of co-regulation relationships into the network reconstruction using a regularization scheme; and (iii) presents an efficient learning algorithm based on non-negative matrix factorization and semi-definite programming.
Finally, although a number of algorithms have been developed for matrix factorization (Ding and He, 2005; Lee and Seung, 1999), this study distinguishes from the prior studies in that it incorporates the prior knowledge of the gene functions into the matrix factorization. In addition, unlike most matrix factorization methods that only identify gene clusters, the current framework derives both the gene modules and their interactions simultaneously.
2 METHODS
KMF is a technique based on matrix factorization. It first computes pairwise correlation between two genes based on their expression levels across different experimental conditions. The matrix of pairwise gene correlation, denoted by W, is approximated by the product of three matrices, M × C × M. A gene modular network, including gene modules and their interaction, is derived from the decomposed matrices M and C.
We denote the gene expression data by X = (x1, x2,…, xn) where n is the number of genes, and each xi = (xi,1, xi,2,…, xi,m) ∈ Rm is the expression levels of the i-th gene measured under m conditions. We can compute the pairwise correlation between any two genes using statistical correlation metrics such as Pearson correlation, mutual information and χ2-statistics. In our experiment, we use RBF kernel function. This computation results in a symmetric matrix W = [wi,j]n×n where wi,j measures the correlation between gene xi and xj. This estimated correlation matrix W provides valuable information about the structure of the gene network since a high correlation wi,j between two genes xi and xj could suggest that: (i) genes xi and xj belong to the same module, or (ii) gene xi regulates the expression levels of gene xj or vice versa. To derive these two types of interactions simultaneously, we follow the framework of weighted non-negative matrix factorization (WNMF) of Ding and He (2005) and factorize W as follows:
where M is a matrix of size n × r and C is a matrix of size r × r, where r ≪ n is the number of modules that can be determined empirically as we will discuss later. Matrix M = [mi,j]n×r represents the memberships of the n genes in r modules where mi,j ≥ 0 indicates the confidence of assigning the i-th gene to the j-th module. Matrix C = [ci,j]r×r represents the relationships among r modules where ci,j ≥ 0 indicates the confidence of the two gene modules to interact (regulate) with each other. Note that in this study, we focus on the undirected network since the gene module regulation matrix C is symmetric.
To determine the appropriate factorization of matrix W, we first define a loss function ld(W, MCM⊤) that measures the difference between W and the factorized matrices M and C as follows:
Second, we regularize the solution of M using the prior knowledge from GO information. We encode the information within GO by a similarity matrix S, where Si,j ≥ 0 represents the similarity between two genes in their biological functions. The discussion of gene similarity by GO can be found in Jin et al. (2006). To ensure the modules to be consistent with the prior knowledge within the GO, we introduce another loss function lm(M, S) that measures the inconsistency between M and S as follows:
where mk is the k-th column of M matrix. L(S) is the combinatorial Laplacian of matrix S. The definition of combinatorial Laplacian and its application to regularize numerical solutions can be found in Chung (1997).
Furthermore, we regularize the solution for C by the regularizer lc(C) = ‖C‖F2. Regularizer, as already shown in statistical machine learning theory (Scholkopf and Smola, 2001), is important for improving the stability of solutions as well as the generalization error of statistical models. This regularizer enforces sparse regulation among the gene modules, and as point out in Andrade et al. (2005), will result in a scale-free structure of the gene module network. By combining the above factors together, we obtain the following optimization problem:
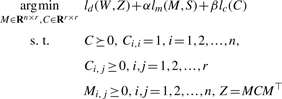 |
We solve the above optimization problem through alternating optimization. It alters the process of optimizing M with fixed C and the process of optimizing C with fixed M iteratively till the solution converges to the local optimum (see Supplementary Methods). Furthermore, the key parameters that determine the outcome of the algorithm, i.e. α, β and the number of modules, are tuned automatically. In particular, both α and β are determined by a supervised learning method; the number of modules is decided by a stability analysis. Further details can be found in the Supplementary Methods.
The KMF algorithm was applied to toxic and non-toxic conditions, separately. It was also applied to the combination of both conditions. We denoted by Ct and Cn the interaction matrices of toxic and non-toxic conditions, respectively, and by Call the interaction matrix derived from all the conditions. In order to ensure that matrices Ct and Cn are comparable, we align Ct and Cn with Call. The alignment is achieved by linearly transforming Ct (and Cn) to minimize |Ct − Call|F2 (and |Cn − Call|F2).
Finally, we emphasize that although this framework follows the work of WNMF, it is different from WNMF in that it incorporates the prior knowledge of the gene functions by introducing regularizer lm(S, M), which not only results in a different objective function to be optimized but also a different method of optimization.
3 RESULTS AND DISCUSSION
We applied the proposed KMF framework to HepG2 cells cultured in different FFAs, with or without TNF-α for 24 h (see Supplementary Methods for details). To reconstruct the network, 250 genes selected in the gene selection phase (see Supplementary Methods) were used. Prior knowledge can be incorporated to help reconstruct networks with sparse and noisy expression data (Bar-Joseph et al., 2003; Berman et al., 2002; Hartemink et al., 2002; Ideker et al., 2001; Ihmels et al., 2002; Li and Yang, 2004; Pilpel et al., 2001). Typically, the prior knowledge of the gene interaction is encoded in a Bayesian prior, in which a high probability is given for each gene relationship derived from prior knowledge. By incorporating a Bayesian prior, Bayesian network (BN) analysis penalizes any gene relationship (i.e. gives a low score) when it violates the prior knowledge of the gene relationships, thus improving both the accuracy and efficiency of BN analysis. In this study, the prior knowledge of the genes is taken from the GO database. Although GO information does not directly reveal the gene relationships, nevertheless it does provide co-regulation relationships and functional information of the genes, both of which are still potentially useful for reconstructing gene networks. Unlike existing methods that apply the GO information to generate predefined sets of genes based on supervised feature selection (Subramanian et al., 2005), our KMF algorithm applies an alternative unsupervised feature selection, which allows us to identify the feature genes when the classification of the experimental conditions is unknown. In addition, KMF tunes the impact of the GO information on the model selection to obtain optimal results (see Section 2). This is in contrast to the other methods where the GO information takes precedence over the subsequent analysis (Srivastava et al., 2008).
The KMF algorithm yields two matrices, M and C. M is the module matrix. Each element Mi,j in matrix M represents the confidence of assigning the i-th gene to the j-th module. We can derive the member genes for each module by assigning each gene i to the module j* with the highest weight, i.e. j* = argmax1≤j≤mMi,j. These member genes will furthermore allow us to infer the overall biological functions of each module. C is the network structure matrix that indicates the connectivity between gene modules. In particular, each element Ci,j in matrix C represents the strength of the interaction between modules i and j. The interaction information revealed by the C matrix may shed light onto how biological information is processed and passed between different cellular activities. Furthermore, comparing the C matrices for the different conditions suggests structural changes in the module network in response to the toxic conditions, and these changes may confer the cytotoxic phenotype.
3.1 Application of KMF to identify gene modules and the interactions between the modules
Nine gene modules are identified by the proposed. We observe that the identified modules are highly enriched with genes involved in specific cellular functions or activities (Table 1). A full list of the genes in each module is available online at http://www.chems.msu.edu/groups/chan/GO_KMF_genecluster.xls. Next, KMF identified the interactions between the modules, namely the connections between different cellular functions, in the form of the C matrix (Table 2), and thereby recovered a module network (Fig. 1). The bottom row (‘sum’) of Table 2 sums the correlation coefficients (Ci,j) between a module with the other eight modules, thereby capturing an overall snapshot of the module connections. A higher ‘sum’ value indicates that the module is more highly correlated with the other modules and thereby takes a more central position in the overall gene module network. A map of the module network is provided in Figure 1, where the strengths of the interactions between the gene modules are indicated by both darkness and thickness of the edges.
Table 1.
Gene modules identified by KMF
| Module | Function |
|---|---|
| 1 | Lipid metabolism and lipid processing. |
| 2 | Signaling proteins, intracellular and membrane protein-mediated: GPCR signaling, chemokine/TNF-α receptor signaling and ion channel-related signaling. |
| 3 | Glucose metabolism: glycolysis and pentose phosphate pathway. |
| 4 | Post-translational modification: ubiquitin-proteasome pathway, protein folding, transportation, phosphorylation. |
| 5 | Reactive oxygen species (ROS) homeostasis, redox system regulation and the TCA cycle. |
| 6 | Energy: ATP and GTP metabolism. |
| 7 | Protein synthesis: translation initiation and transcription. |
| 8 | Amino acid metabolism and urea cycle. |
| 9 | Apoptosis: executors and regulators. |
Table 2.
C matrix of the modules
| Module | 1 | 2 | 3 | 4 | 5 | 6 | 7 | 8 | 9 |
|---|---|---|---|---|---|---|---|---|---|
| 1 | 0.152 | 0.234 | 0.195 | 0.191 | 0.275 | 0.101 | 0.236 | 0.176 | |
| 2 | 0.152 | 0.177 | 0.155 | 0.152 | 0.214 | 0.092 | 0.183 | 0.140 | |
| 3 | 0.234 | 0.177 | 0.236 | 0.215 | 0.305 | 0.107 | 0.284 | 0.209 | |
| 4 | 0.195 | 0.155 | 0.236 | 0.204 | 0.295 | 0.120 | 0.249 | 0.188 | |
| 5 | 0.191 | 0.152 | 0.215 | 0.204 | 0.302 | 0.122 | 0.253 | 0.186 | |
| 6 | 0.275 | 0.214 | 0.305 | 0.295 | 0.302 | 0.170 | 0.360 | 0.267 | |
| 7 | 0.101 | 0.092 | 0.107 | 0.120 | 0.122 | 0.170 | 0.138 | 0.108 | |
| 8 | 0.236 | 0.183 | 0.284 | 0.249 | 0.253 | 0.360 | 0.138 | 0.227 | |
| 9 | 0.176 | 0.140 | 0.209 | 0.188 | 0.186 | 0.267 | 0.108 | 0.227 | |
| Sum | 1.560 | 1.265 | 1.767 | 1.642 | 1.625 | 2.188 | 0.958 | 1.930 | 1.501 |
Elements in rows 1–9 represent the interaction strength between modules. The bottom row (sum) is the summation of each column.
Fig. 1.

Gene module interaction network. Interactions among the nine gene modules are visualized according to the C matrix. The nodes represent modules and the edges indicating the strength of the interaction between modules. A higher Ci,j value in the C matrix, suggesting stronger interaction, is indicated by a thicker and darker edge line, whereas a higher ‘sum’ value in the C matrix, suggesting more relevant module, is indicated by a larger and darker node.
From the C matrix (Table 2) and the module interaction network (Fig. 1), module 6 (ATP and GTP metabolism) has the highest ‘sum’ value among the nine modules, and is presented as the largest node in the module interaction map. Indeed, as the molecular currency of intracellular energy transfer, ATP (as well as GTP) is either produced or consumed by most cellular activities, e.g. metabolism (catabolism and anabolism) and signaling pathways. Module 6 has the highest interaction values with modules 3, 5 and 8 in the C matrix, reflecting that glucose metabolism (module 3) and TCA cycle (module 5) are the major metabolic pathways that produce ATP, the electron transport chain (ETC) (module 5) produces the proton gradient across the mitochondria membrane to provide the driving force for ATP production (Lehninger et al., 2005), and amino acid metabolism (module 8) is highly dependent on the ATP levels. Therefore, from the example of module 6, KMF recovered a high connectivity between ATP (and GTP) synthesis and the major cellular activities that are known to be related to energy production and consumption.
3.2 Application of KMF to identify the interactions involved in palmitate-induced cytotoxicity
KMF, if applied to the different conditions separately, yields different C matrices specifically for the toxic (saturated FFAs and TNF-α, see Supplementary Table 1) and non-toxic (control, unsaturated FFAs and TNF-α, see Supplementary Table 2) conditions. This is in contrast to the average C matrix obtained using all the conditions discussed above (Table 2). Similarly, these condition-specific C matrices indicate module networks composed of interactions between cellular activities for their corresponding condition. The C matrix in the toxic conditions differs significantly from the non-toxic conditions, suggesting that the interactions between the gene modules in the toxic (saturated FFAs and TNF-α) case are altered significantly, and these changes potentially may help to explain the phenotype, palmitate-induced cytotoxicity. To quantitatively assess these changes, we subtracted the C matrix for the non-toxic conditions from the C matrix for the toxic conditions, and obtained a matrix we denoted as the ‘difference C matrix’ (Table 3). This matrix indicates the differences in the interactions between the gene modules for the toxic versus the non-toxic conditions. Positive values indicate stronger interactions between the modules under the toxic than the non-toxic conditions, and vice versa. The summation of each column in the difference C matrix (the row denoted as ‘sum’ in Table 3) indicates the difference between the toxic and the non-toxic conditions in the interactions of a module with the other modules. As shown in the difference C matrix (Table 3), modules 2, 3, 4 and 5 are more highly connected to the other modules, while modules 6 and 9 are less connected to the other modules in the toxic than in the non-toxic conditions. Since modules 4 and 6 have the largest positive and negative ‘sum’ values, 0.144 and −0.294, respectively, we focused on these two modules in the discussion of their potential involvement in palmitate-induced cytotoxicity (Supplementary Discussion). In brief, the ubiquitin-proteasome pathway and post-translational modifications (folding/unfolding, transportation and degradation) of proteins, module 4, was identified to be important in saturated FFA-induced cytotoxicity, which is supported by the literature (Ding et al., 2007; Guo et al., 2007; Lai et al., 2008; Zhang et al., 2006). In contrast, module 6, ATP metabolism, was suggested to be less correlated with the other cellular processes in the toxic than non-toxic conditions. Indeed long-term exposure of saturated FFAs can activate uncoupling proteins (UCP) (Lameloise et al., 2001), which uncouple mitochondrial oxidative phosphorylation and produce heat instead of ATP (Breen et al., 2006). As a result, with this additional regulation through UCPs, the level of ATP should be less connected with the cellular activities in the toxic than the non-toxic conditions.
Table 3.
Difference C matrix. Obtained by subtracting the C matrix of the non-toxic conditions (Supplementary Table 2) from the C matrix of the toxic conditions (Supplementary Table 1)
| Module | 1 | 2 | 3 | 4 | 5 | 6 | 7 | 8 | 9 |
|---|---|---|---|---|---|---|---|---|---|
| 1 | 0.006 | 0.016 | 0.023 | 0.008 | −0.050 | −0.016 | 0.006 | −0.007 | |
| 2 | 0.006 | 0.037 | 0.031 | 0.017 | −0.017 | −0.007 | 0.023 | −0.002 | |
| 3 | 0.016 | 0.037 | 0.038 | 0.039 | −0.053 | −0.001 | 0.010 | 0.011 | |
| 4 | 0.023 | 0.031 | 0.038 | 0.034 | −0.024 | 0.007 | 0.027 | 0.008 | |
| 5 | 0.008 | 0.017 | 0.039 | 0.034 | −0.021 | 0.011 | 0.015 | −0.005 | |
| 6 | −0.050 | −0.017 | −0.053 | −0.024 | −0.021 | −0.010 | −0.062 | −0.057 | |
| 7 | −0.016 | −0.007 | −0.001 | 0.007 | 0.011 | −0.010 | 0.003 | −0.027 | |
| 8 | 0.006 | 0.023 | 0.010 | 0.027 | 0.015 | −0.062 | 0.003 | −0.010 | |
| 9 | −0.007 | −0.002 | 0.011 | 0.008 | −0.005 | −0.057 | −0.027 | −0.010 | |
| Sum | −0.014 | 0.088 | 0.097 | 0.144 | 0.098 | −0.294 | −0.040 | 0.012 | −0.089 |
The largest positive (0.144) and negative (−0.294) sum values are marked in bold.
The proposed KMF algorithm identified the gene modules and their interactions, as well as how they change in the toxic versus non-toxic conditions. The results suggested that post-translational modification and uncoupling proteins (UCP) play important roles in mediating the palmitate/TNF-α induced cellular responses, thereby shedding light on potential mechanisms involved in palmitate-induced cytotoxicity. Thus far, this methodology has focused on the module network. To further uncover the specific genes that may be responsible for the palmitate-induced cytotoxicity, we performed further analysis to assess the contribution of each gene in the two gene modules that were deemed important.
3.3 Identifying potential genes responsible for palmitate-induced cytotoxicity
As described above, the values in the M matrix (Mi,j) indicate the strength or contribution of gene i to module j. The rank of the genes in a module by their Mi,j values provides a relative index of the importance of a gene to the cellular function that corresponds to that module. Under different conditions, the modules remained relatively stable with respect to their size and gene members, however, the rank of certain genes changed significantly in some of the modules. The importance or the weights of these genes in their corresponding modules varied across the different conditions, suggesting that these genes may play important roles in conferring a phenotype.
Given the importance of modules 4 (post-translational modification of proteins) and 6 (ATP and GTP metabolism), we ranked the genes in these two modules according to their Mi,j values in the toxic conditions. The top 10 out of 33 genes in module 4 and all the genes in module 6 are listed in Table 4 and Supplementary Table 3, respectively. The ranking numbers of these genes in the toxic and non-toxic conditions are listed, as is the difference in the rankings of the genes between these conditions (Table 4 and Supplementary Table 3).
Table 4.
Top 10 out of 33 genes in module 4 ranked according to their contributions to the module under toxic conditions
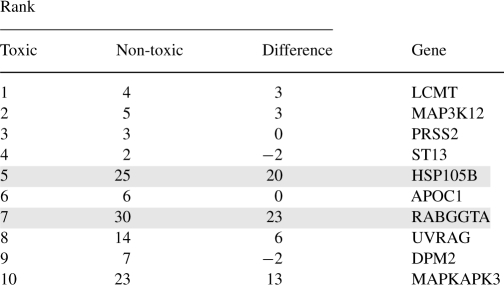 |
The ranking difference was calculated by subtracting the ranking number of the specific gene under toxic conditions from non-toxic conditions. Positive ranking differences indicate bigger ranking numbers and less contribution in non-toxic conditions. The two genes with the highest Difference ranks are highlighted in grey.
In module 4, the positions of two genes, Rab geranylgeranyltrans-ferase (RABGGTA) and heat shock 105 kDa (HSP105B) changed significantly in the toxic conditions, as indicated by high positive differences in the ranking, 23 and 20, respectively, suggesting that these two genes may be more involved in the toxic than non-toxic conditions and thereby play a role in conferring the toxic phenotype. RABGGT catalyzes the transfer of a geranyl–geranyl moiety from geranyl–geranyl pyrophosphate to Rab proteins (GTPases) such as RAB1A, RAB3A and RAB5A (Leung et al., 2006). As a member of the Ras superfamily of monomeric G proteins, Rab proteins regulate membrane traffic, which facilitates the trafficking of cell membrane proteins from the Golgi apparatus to the plasma membrane and the recycling of the membrane proteins (Seabra et al., 2002; Stenmark and Olkkonen, 2001). RABGGT, by facilitating the prenylation of Rab proteins (Leung et al., 2006), ensures that the Rab proteins are insoluble and correctly anchored in the membrane. The response of RABGGT to saturated FFAs and its potential role, if any, in the saturated FFA-induced cytotoxicity has never been studied. The mRNA level of RABGGT is not affected by oleate and increased by palmitate albeit insignificantly (Fig. 2a, see Supplementary Methods for the details of the experiments). However, further analysis by silencing the gene expression level of RABGGT revealed a very interesting feature of RABGGT in regulating cytotoxicity (Fig. 2b). In the non-toxic conditions, i.e. BSA (vehicle of the FFAs) or oleate, the LDH release was increased by the siRNA of RABGGT (Fig. 2b), suggesting that RABGGT may help to maintain normal healthy cellular activities under physiological and non-toxic conditions. Indeed, membrane traffic pathways, regulated by RABGGT through Rab GTPases, are important in maintaining normal vesicle formation and movement and membrane protein trafficking and recycling. In contrast, in the toxic condition, i.e. palmitate, the LDH release was decreased by the siRNA of RABGGT (Fig. 2b), suggesting that RABGGT may be involved in mediating the cytotoxic effect of palmitate. The potential mechanism of the distinct roles of RABGGT under the different conditions is unclear at this point. Given that RABGGT catalyzes the prenylation and therefore the activation of Rab GTPases, we hypothesize that the toxic conditions (i.e. palmitate) induce disordered trafficking and recycling of the membrane proteins and disrupt the membrane integrity, through RABGGT and Rab proteins, thereby enhancing the cytotoxicity.
Fig. 2.

Effects of the fatty acids on the expression level of RABGGTA and the role of RABGGTA in cytotoxicity. HepG2 cells were exposed to 0.7 mM palmitate or oleate for 24 hours (a). After treatment, the cells were harvested, and RT-PCR analysis was performed to detect the mRNA levels of RABGGTA (a). Reverse transfection of suspended HepG2 cells were performed with scrambled siRNA (whit bar, negative control) or siRNA of RABGGTA (gray bars, siRABGGTA) for 24 h and the transfected cells were then cultured in 0.7 mM palmitate or oleate for another 24 h (b). Cells were then harvested, and the LDH release was assayed (b). Data expressed as average of nine samples ±SD from three independent experiments. Student's t-test was used to analyze the differences between treatment groups. Significantly higher (*) or lower (**) than negative control, i.e. scrambled siRNA; P < 0.01.
As discussed in the Supplementary Discussion, as an important chaperone protein involved in processing denatured proteins under stress conditions (Yamagishi et al., 2000, 2003), HSP105B may also be involved in the cellular responses induced by the toxic conditions, potentially by regulating the post-translational modifications, such as denaturation, folding/unfolding, transportation and degradation. Indeed, we found that both the mRNA (Supplementary Fig. 1A) and protein (Supplementary Fig. 1B) expression levels of HSP105B were significantly increased by palmitate but not by oleate, suggesting that this gene potentially plays a role in the cytotoxicity induced by saturated FFA. HSP105B usually exists as a complex associated with Hsp70 and Hsc70 (a constitutive member of the HSP70 family) in mammalian cells and functions as a negative regulator of Hsp70/Hsc70 by suppressing the Hsp70/Hsc70 chaperone activity (Yamagishi et al., 2000). More detailed investigation is needed to clarify the exact role of HSP105 in palmitate-induced cytotoxicity.
In module 6, the positions of two genes, ATPase, H+ transporting, lysosomal interacting protein 1 (ATP6IP1) and guanine monophosphate synthetase (GMPS) are changed significantly by the toxic conditions, indicated by their having the highest positive difference ranking, 7 and 6, respectively (see Supplementary Table 3), suggesting that these two genes may be involved in conferring the toxic phenotype. As an essential component of most eukaryotic cells, ATP6IP1 is located on the vacuole membrane, responsible for acidifying vacuoles by transporting H+ into the vacuoles at the expense of ATP (Nelson, 1987, 1992). Vacuoles are involved in removing and recycling unwanted or harmful substances, such as misfolded proteins and foreign invaders such as bacteria (Alberts, 2002; Ganong, 2003). Together with lysosomes, vacuoles play major roles in autophagy and maintaining the balance between biogenesis and degradation of many cellular products. It has been shown that palmitate induces lysosomal permeabilization, which contributes to the cytotoxicity induced by palmitate (Acosta and Wenzel, 1974; Feldstein et al., 2004); however, the effect of palmitate on the vacuole membrane has not been reported. In fact, vacuoles and lysosomes share similarities in their structures, internal pH and major functions, and these two organelles sometimes fuse together to exchange their internal substances. Considering the similarity between vacuoles and lysosomes, and more importantly based on our result that suggests this vacuole membrane protein ATP6IP1 plays an important role in the toxic (palmitate) conditions, we hypothesize that palmitate may similarly perturb the vacuole membrane, and thereby interrupt the internal pH, and induce vacuole permeabilization, which may lead to apoptosis and cytotoxicity. Since ATP6IP1 is the major membrane protein that produces the pH difference across the vacuole membrane, we further propose that palmitate perturbs the vacuole membrane by interacting with ATP6IP1. The mRNA (Fig. 3a) and protein (Fig. 3c) expression levels of ATP6IP1 were not significantly affected by either palmitate or oleate. However, silencing the expression of ATP6IP1 with the siRNA of ATP6IP1 decreased the cytotoxicity induced by palmitate, as evidenced by the LDH release (Fig. 3b). This result suggests that palmitate may alter the vacuole membrane and induce cytotoxicity through the vacuole membrane protein ATP6IP1.
Fig. 3.

Effects of the fatty acids on the expression level of ATP6IP1 and the role of ATP6IP1 in cytotoxicity. HepG2 cells were exposed to 0.7 mM palmitate or oleate for 24 h (a and c). After treatment, the cells were harvested, and RT-PCR (a) and western blot analysis (c) were performed to detect the mRNA (a) and the protein (c) expression levels of ATP6IP1. Reverse transfection of suspended HepG2 cells were performed with scrambled siRNA (white bar, negative control) or siRNA of ATP6IP1 (gray bar, siATP6IP1) for 24 h and the transfected cells were then cultured in 0.7 mM palmitate or oleate for another 24 h (b). Cells were then harvested, and the LDH release was assayed (b). Data expressed as average of nine samples ±SD from three independent experiments. Student's t-test was used to analyze the differences between treatment groups. **Significantly lower than negative control, i.e. scrambled siRNA, P < 0.01.
As discussed in the Supplementary Material, the regulation of guanine nucleotide synthesis by GMPS in liver cell cytotoxicity has never been studied. Interestingly, we found that the mRNA (Supplementary Fig. 2A) and protein (Supplementary Fig. 2B) expression levels of GMPS were both significantly enhanced by the saturated FFA, palmitate, but not by unsaturated FFA, oleate. Currently, it is unclear what role this enzyme plays in the toxicity induced by saturated FFA. However, the changes at the gene and protein expressions of GMPS in response to palmitate suggested that GMPS may play a role in saturated FFA-induced cellular activities.
4 CONCLUSIONS
KMF was used to reconstruct a gene module network, composed of functional gene modules and their interactions. Comparing the gene module networks for the different conditions revealed changes in module interactions across the conditions. Our results showed that modules 2–6 and 9 played important roles in palmitate-induced cytotoxicity. These modules covered most of the popular areas of the research on the cytotoxicity induced by saturated FFAs and TNF-α in liver cells, including the regulation of apoptosis pathways (module 9) (Barreyro et al., 2007; Feldstein et al., 2004; Yang and Chan, 2009) and redox system (module 5) (Li et al., 2008; Srivastava and Chan, 2007). In a separate study, we evaluated how saturated FFAs and TNF-α affected some of the genes in module 9, such as PKR and Bcl-2 family proteins, and found that the gene expression level of Bcl-2 was suppressed by palmitate and TNF-α through PKR (Li et al., 2007a; Yang and Chan, 2009), providing a potential mechanism by which palmitate and TNF-α-induced cytotoxicity. We also investigated some of the genes in module 5, such as NADH dehydrogenases, which we found was also highly involved in palmitate-induced cytotoxicity by inducing ROS production (Li et al., 2008).
In addition, assessing the contribution of genes within some of the highly relevant modules (4 and 6) revealed potential genes that may be involved in palmitate-induced cytotoxicity. Further experiments confirmed the involvement of these genes in conferring the phenotype, palmitate-induced cytotoxicity and suggested novel research targets for addressing the palmitate-induced cytotoxicity. In summary, by quantitatively integrating gene expression profile with prior knowledge extracted from GO database, KMF provides a powerful tool to reconstruct modular and phenotype-specific gene networks that elucidate possible mechanisms involved in producing a phenotype.
Funding: National Institute of Health (R01GM079688-01, R21CA126136-01, R21RR024439); Michigan Universities Commercialization Initiative (MUCI); the MSU Foundation and Center for Systems Biology.
Conflict of Interest: none declared.
Supplementary Material
REFERENCES
- Acosta D, Wenzel DG. Injury produced by free fatty acids to lysosomes and mitochondria in cultured heart muscle and endothelial cells. Atherosclerosis. 1974;20:417–426. doi: 10.1016/0021-9150(74)90023-9. [DOI] [PubMed] [Google Scholar]
- Alberts B. Molecular Biology of the Cell. 4th. New York: Garland Science; 2002. [Google Scholar]
- Andrade JS, et al. Apollonian networks: simultaneously scale-free, small world, Euclidean, space filling, and with matching raphs. Phys. Rev. Lett. 2005;94 doi: 10.1103/PhysRevLett.94.018702. 018702-1-4. [DOI] [PubMed] [Google Scholar]
- Bar-Joseph Z, et al. Computational discovery of gene modules and regulatory networks. Nat. Biotechnol. 2003;21:1337–1342. doi: 10.1038/nbt890. [DOI] [PubMed] [Google Scholar]
- Barreyro FJ, et al. Transcriptional regulation of Bim by Foxo3A mediates hepatocyte lipoapoptosis. J. Biol. Chem. 2007;282:27141–27154. doi: 10.1074/jbc.M704391200. [DOI] [PubMed] [Google Scholar]
- Berman BP, et al. Exploiting transcription factor binding site clustering to identify cis-regulatory modules involved in pattern formation in the Drosophila genome. Proc. Natl Acad. Sci. USA. 2002;99:757–762. doi: 10.1073/pnas.231608898. [DOI] [PMC free article] [PubMed] [Google Scholar]
- Bhaskar H, et al. Machine learning in bioinformatics: a brief survey and recommendations for practitioners. Comput. Biol. Med. 2006;36:1104–1125. doi: 10.1016/j.compbiomed.2005.09.002. [DOI] [PubMed] [Google Scholar]
- Breen EP, et al. On the mechanism of mitochondrial uncoupling protein 1 function. J. Biol. Chem. 2006;281:2114–2119. doi: 10.1074/jbc.M511575200. [DOI] [PubMed] [Google Scholar]
- Bruce CR, Dyck DJ. Cytokine regulation of skeletal muscle fatty acid metabolism: effect of interleukin-6 and tumor necrosis factor-alpha. Am. J. Physiol. Endocrinol. Metab. 2004;287:E616–E621. doi: 10.1152/ajpendo.00150.2004. [DOI] [PubMed] [Google Scholar]
- Chan C, et al. Application of multivariate analysis to optimize function of cultured hepatocytes. Biotechnol. Prog. 2003;19:580–598. doi: 10.1021/bp025660h. [DOI] [PubMed] [Google Scholar]
- Chung FRK. Spectral Graph Theory. Providence, R.I: American Mathematical Society; 1997. [Google Scholar]
- Ding C, He X. Proceeding of the SIAM International Conference on Data Mining (SDM05) Philadelphia: Society for Industrial and Applied Mathematics; 2005. On the equivalence of nonnegative matrix factorization and spectral clustering; pp. 606–610. [Google Scholar]
- Ding WX, et al. Linking of autophagy to ubiquitin-proteasome system is important for the regulation of endoplasmic reticulum stress and cell viability. Am. J. Pathol. 2007;171:513–524. doi: 10.2353/ajpath.2007.070188. [DOI] [PMC free article] [PubMed] [Google Scholar]
- Eisen MB, et al. Cluster analysis and display of genome-wide expression patterns. Proc. Natl Acad. Sci. USA. 1998;95:14863–14868. doi: 10.1073/pnas.95.25.14863. [DOI] [PMC free article] [PubMed] [Google Scholar]
- Farrell GC, Larter CZ. Nonalcoholic fatty liver disease: from steatosis to cirrhosis. Hepatology. 2006;43(2 Suppl. 1):S99–S112. doi: 10.1002/hep.20973. [DOI] [PubMed] [Google Scholar]
- Feldstein AE, et al. Free fatty acids promote hepatic lipotoxicity by stimulating TNF-alpha expression via a lysosomal pathway. Hepatology. 2004;40:185–194. doi: 10.1002/hep.20283. [DOI] [PubMed] [Google Scholar]
- Ganong WF. Review of Medical Physiology. 21st. New York, London: McGraw-Hill; 2003. [Google Scholar]
- Guo W, et al. Palmitate modulates intracellular signaling, induces endoplasmic reticulum stress, and causes apoptosis in mouse 3T3-L1 and rat primary preadipocytes. Am. J. Physiol. Endocrinol. Metab. 2007;293:E576–E586. doi: 10.1152/ajpendo.00523.2006. [DOI] [PubMed] [Google Scholar]
- Han JD. Understanding biological functions through molecular networks. Cell Res. 2008;18:224–237. doi: 10.1038/cr.2008.16. [DOI] [PubMed] [Google Scholar]
- Hartemink AJ, et al. Combining location and expression data for principled discovery of genetic regulatory network models. Pac. Symp. Biocomput. 2002:437–449. [PubMed] [Google Scholar]
- Husmeier D. Sensitivity and specificity of inferring genetic regulatory interactions from microarray experiments with dynamic Bayesian networks. Bioinformatics. 2003;19:2271–2282. doi: 10.1093/bioinformatics/btg313. [DOI] [PubMed] [Google Scholar]
- Ideker T, et al. Integrated genomic and proteomic analyses of a systematically perturbed metabolic network. Science. 2001;292:929–934. doi: 10.1126/science.292.5518.929. [DOI] [PubMed] [Google Scholar]
- Ihmels J, et al. Revealing modular organization in the yeast transcriptional network. Nat. Genet. 2002;31:370–377. doi: 10.1038/ng941. [DOI] [PubMed] [Google Scholar]
- Inza I, et al. Filter versus wrapper gene selection approaches in DNA microarray domains. Artif. Intell. Med. 2004;31:91–103. doi: 10.1016/j.artmed.2004.01.007. [DOI] [PubMed] [Google Scholar]
- Jeong H, et al. The large-scale organization of metabolic networks. Nature. 2000;407:651–654. doi: 10.1038/35036627. [DOI] [PubMed] [Google Scholar]
- Jin R, et al. A knowledge driven regression model for gene expression and microarray analysis. Conf. Proc. IEEE Eng. Med. Biol. Soc. 2006;1:5326–5329. doi: 10.1109/IEMBS.2006.260347. [DOI] [PubMed] [Google Scholar]
- Lai E, et al. Differential activation of er stress and apoptosis in response to chronically elevated free fatty acids in pancreatic beta-cells. Am. J. Physiol. Endocrinol. Metab. 2008;294:E540–E550. doi: 10.1152/ajpendo.00478.2007. [DOI] [PubMed] [Google Scholar]
- Lameloise N, et al. Uncoupling protein 2: a possible link between fatty acid excess and impaired glucose-induced insulin secretion? Diabetes. 2001;50:803–809. doi: 10.2337/diabetes.50.4.803. [DOI] [PubMed] [Google Scholar]
- Lee DD, Seung HS. Learning the parts of objects by non-negative matrix factorization. Nature. 1999;401:788–791. doi: 10.1038/44565. [DOI] [PubMed] [Google Scholar]
- Lehninger AL, et al. Lehninger Principles of Biochemistry. 4th. New York: W.H. Freeman; 2005. [Google Scholar]
- Leung KF, et al. Thematic review series: lipid posttranslational modifications. Geranylgeranylation of Rab GTPases. J. Lipid Res. 2006;47:467–475. doi: 10.1194/jlr.R500017-JLR200. [DOI] [PubMed] [Google Scholar]
- Li F, Yang Y. Recovering genetic regulatory networks from micro-array data and location analysis data. Genome Inform. 2004;15:131–140. [PubMed] [Google Scholar]
- Li Z, Chan C. Inferring pathways and networks with a Bayesian framework. FASEB J. 2004;18:746–748. doi: 10.1096/fj.03-0475fje. [DOI] [PubMed] [Google Scholar]
- Li Z, et al. A hierarchical approach employing metabolic and gene expression profiles to identify the pathways that confer cytotoxicity in Hepg2 cells. BMC Syst. Biol. 2007a;1:21. doi: 10.1186/1752-0509-1-21. [DOI] [PMC free article] [PubMed] [Google Scholar]
- Li Z, et al. A three stage integrative pathway search (tips) framework to identify toxicity relevant genes and pathways. BMC Bioinformatics. 2007b;8:202. doi: 10.1186/1471-2105-8-202. [DOI] [PMC free article] [PubMed] [Google Scholar]
- Li Z, et al. Using dynamic gene module map analysis to identify targets that modulate free fatty acid induced cytotoxicity. Biotechnol. Prog. 2008;24:29–37. doi: 10.1021/bp070120b. [DOI] [PMC free article] [PubMed] [Google Scholar]
- Ma SF, et al. Bioinformatic identification of novel early stress response genes in rodent models of lung injury. Am. J. Physiol. Lung Cell. Mol. Physiol. 2005;289:L468–L477. doi: 10.1152/ajplung.00109.2005. [DOI] [PubMed] [Google Scholar]
- Nelson N. The vacuolar proton-atpase of eukaryotic cells. Bioessays. 1987;7:251–254. doi: 10.1002/bies.950070605. [DOI] [PubMed] [Google Scholar]
- Nelson N. Evolution of organellar proton-ATPases. Biochim. Biophys. Acta. 1992;1100:109–124. doi: 10.1016/0005-2728(92)90072-a. [DOI] [PubMed] [Google Scholar]
- Phillip PL, et al. Using prior knowledge to improve genetic network reconstruction from microarray data. In Silico Biol. 2004;4:335–353. [PubMed] [Google Scholar]
- Pilpel Y, et al. Identifying regulatory networks by combinatorial analysis of promoter elements. Nat. Genet. 2001;29:153–159. doi: 10.1038/ng724. [DOI] [PubMed] [Google Scholar]
- Ravasz E, et al. Hierarchical organization of modularity in metabolic networks. Science. 2002;297:1551–1555. doi: 10.1126/science.1073374. [DOI] [PubMed] [Google Scholar]
- Ressom HW, et al. Classification algorithms for phenotype prediction in genomics and proteomics. Front Biosci. 2008;13:691–708. doi: 10.2741/2712. [DOI] [PMC free article] [PubMed] [Google Scholar]
- Saeys Y, et al. A review of feature selection techniques in bioinformatics. Bioinformatics. 2007;23:2507–2517. doi: 10.1093/bioinformatics/btm344. [DOI] [PubMed] [Google Scholar]
- Said MR, et al. Global network analysis of phenotypic effects: protein networks and toxicity modulation in Saccharomyces cerevisiae. Proc. Natl Acad. Sci. USA. 2004;101:18006–18011. doi: 10.1073/pnas.0405996101. [DOI] [PMC free article] [PubMed] [Google Scholar]
- Scheen AJ, Luyckx FH. Obesity and liver disease. Best Pract. Res. Clin. Endocrinol. Metab. 2002;16:703–716. doi: 10.1053/beem.2002.0225. [DOI] [PubMed] [Google Scholar]
- Scholkopf B, Smola AJ. Learning with Kernels: Support Vector Machines, Regularization, Optimization, and Beyond. Cambridge, MA: MIT Press; 2001. [Google Scholar]
- Seabra MC, et al. Rab GTPases, intracellular traffic and disease. Trends Mol. Med. 2002;8:23–30. doi: 10.1016/s1471-4914(01)02227-4. [DOI] [PubMed] [Google Scholar]
- Segal E, et al. Module networks: identifying regulatory modules and their condition-specific regulators from gene expression data. Nat. Genet. 2003;34:166–176. doi: 10.1038/ng1165. [DOI] [PubMed] [Google Scholar]
- Srivastava S, Chan C. Hydrogen peroxide and hydroxyl radicals mediate palmitate-induced cytotoxicity to hepatoma cells: relation to mitochondrial permeability transition. Free Radic. Res. 2007;41:38–49. doi: 10.1080/10715760600943900. [DOI] [PubMed] [Google Scholar]
- Srivastava S, et al. Identification of genes that regulate multiple cellular processes/responses in the context of lipotoxicity to hepatoma cells. BMC Genomics. 2007;8:364. doi: 10.1186/1471-2164-8-364. [DOI] [PMC free article] [PubMed] [Google Scholar]
- Srivastava S, et al. A novel method incorporating gene ontology information for unsupervised clustering and feature selection. PLoS ONE. 2008;3:e3860. doi: 10.1371/journal.pone.0003860. [DOI] [PMC free article] [PubMed] [Google Scholar]
- Stenmark H, Olkkonen VM. The Rab GTPase family. Genome Biol. 2001;2 doi: 10.1186/gb-2001-2-5-reviews3007. REVIEWS3007. [DOI] [PMC free article] [PubMed] [Google Scholar]
- Subramanian A, et al. Gene set enrichment analysis: a knowledge-based approach for interpreting genome-wide expression profiles. Proc. Natl Acad. Sci. USA. 2005;102:15545–15550. doi: 10.1073/pnas.0506580102. [DOI] [PMC free article] [PubMed] [Google Scholar]
- Thieffry D, Romero D. The modularity of biological regulatory networks. Biosystems. 1999;50:49–59. doi: 10.1016/s0303-2647(98)00087-2. [DOI] [PubMed] [Google Scholar]
- Toh H, Horimoto K. Inference of a genetic network by a combined approach of cluster analysis and graphical gaussian modeling. Bioinformatics. 2002;18:287–297. doi: 10.1093/bioinformatics/18.2.287. [DOI] [PubMed] [Google Scholar]
- Toronen P, et al. Analysis of gene expression data using self-organizing maps. FEBS Lett. 1999;451:142–146. doi: 10.1016/s0014-5793(99)00524-4. [DOI] [PubMed] [Google Scholar]
- Troyanskaya OG, et al. Nonparametric methods for identifying differentially expressed genes in microarray data. Bioinformatics. 2002;18:1454–1461. doi: 10.1093/bioinformatics/18.11.1454. [DOI] [PubMed] [Google Scholar]
- Yamagishi N, et al. Modulation of the chaperone activities of Hsc70/Hsp40 by Hsp105alpha and Hsp105beta. Biochem. Biophys. Res. Commun. 2000;272:850–855. doi: 10.1006/bbrc.2000.2864. [DOI] [PubMed] [Google Scholar]
- Yamagishi N, et al. Hsp105 but not Hsp70 family proteins suppress the aggregation of heat-denatured protein in the presence of ADP. FEBS Lett. 2003;555:390–396. doi: 10.1016/s0014-5793(03)01292-4. [DOI] [PubMed] [Google Scholar]
- Yang X, Chan C. Repression of PKR mediates palmitate-induced apoptosis in HepG2 cells through regulation of Bcl-2. Cell Res. 2009;19:469–486. doi: 10.1038/cr.2009.25. [DOI] [PMC free article] [PubMed] [Google Scholar]
- Yin L, et al. Clustering of gene expression data: performance and similarity analysis. BMC Bioinformatics. 2006;7(Suppl. 4):S19. doi: 10.1186/1471-2105-7-S4-S19. [DOI] [PMC free article] [PubMed] [Google Scholar]
- Yook SH, et al. Functional and topological characterization of protein interaction networks. Proteomics. 2004;4:928–942. doi: 10.1002/pmic.200300636. [DOI] [PubMed] [Google Scholar]
- Yu J, et al. Advances to bayesian network inference for generating causal networks from observational biological data. Bioinformatics. 2004;20:3594–3603. doi: 10.1093/bioinformatics/bth448. [DOI] [PubMed] [Google Scholar]
- Zhang Z, et al. Palmitoyl-protein thioesterase-1 deficiency mediates the activation of the unfolded protein response and neuronal apoptosis in INCL. Hum. Mol. Genet. 2006;15:337–346. doi: 10.1093/hmg/ddi451. [DOI] [PubMed] [Google Scholar]
Associated Data
This section collects any data citations, data availability statements, or supplementary materials included in this article.