

1 Introduction
Sleep is an essential component of human existence, consuming roughly one third of our lives. Fatigue, jet-lag, poor sleep and vivid dreams are frequent points of our morning discussions. We look and feel terrible after getting too little sleep; hence a twenty billion dollar industry of beds, pillows, pills and other tools has cropped up to help us sleep better. Correspondingly, there are plenty of products designed to keep us awake.
Despite the importance of sleep in our lives, and the lives of so many other species, a definitive answer on the specific neuro-biological or physiologic purpose of sleep eludes researchers. However, substantial advancements in the field are uncovering the crucial role that sleep plays in our health, behavior and well being.
For example, studies of sleep duration have found associations with a variety of important health outcomes. Short sleep duration correlates with impaired cognitive function, hypertension, glucose intolerance, altered immune function, obesity and even mortality. This point is driven home by the fact that sleep deprivation is a well recognized form of torture. Consider the following quote from former Israeli Prime Minister Menachem Begin, who suffered forced sleep deprivation as a KGB prisoner:
In the head of the interrogated prisoner, a haze begins to form. His spirit is wearied to death, his legs are unsteady, and he has one sole desire: to sleep, to sleep just a little, not to get up, to lie, to rest, to forget... Anyone who has experienced this desire knows that not even hunger and thirst are comparable with it.
Quantity of sleep is only one measurable facet of sleep that is associated with health. Table 1 gives a few of the more common measurements of sleep and sleep disturbance. The next section describes sleep measurement in greater detail.
Table 1.
Measurements of sleep taken during an overnight sleep study and routine clinical evaluation of sleep.
| Sleep measure | Description |
|---|---|
| Arousal index | Number of arousals per hour slept |
| Epworth Sleepiness Scale | Aggregate measure of general sleepiness |
| Respiratory disturbance index | Number of apneas and hypopneas per hour |
| Sleep architecture | Proportion of time spent in various sleep states |
| Sleep efficiency | Time asleep as a proportion of time in bed |
| Sleep latency | Time until falling asleep |
| Total sleep time | Total time asleep in a night |
A common sleep disorder that is of particular public health interest is sleep apnea. This is a chronic condition characterized by collapses of the upper airway during sleep. Complete collapses lead to so-called “apneas”, whereas partial collapses to so-called “hypopneas”. Over the last decade, research has shown that these events can lead to several physiologic consequences, including changes in metabolism, glucose tolerance and cardiac function.
The respiratory disturbance index (RDI), sometimes also called the apnea/hypopnea index (AHI), is the principal measure of severity of sleep apnea. This rate index is the count of the number of apneas and hypopneas divided by the total time slept in hours. A severely affected patient may have an RDI of thirty events per hour or higher! Hence such a patient is, on average, having a disruption in their sleep and breathing every two minutes. As one can imagine, such frequent disruptions in sleep and oxygen intake can have negative health consequences. Young, Peppard and Gottlieb review that a high RDI has been shown to be associated with hypertension, cardiovascular disease, cerebrovascular disease, excessive daytime sleepiness, decreased cognitive function, decreased health-related quality of life, increased motor vehicle crashes and occupational accidents, and mortality.
In this article, we relate measures of sleep apnea with transitions that occur between “sleep states”. Sleep states are based on visual classification of brain electroencephalograms (EEGs) patterns (see below). Two major sleep states are rapid eye movement (REM) and non-REM. Sleep states can be seen as a categorical response time series. Crude summaries of these states, such as the percentage time spent in each one, are often used as predictors of health. Instead, we investigate the role that sleep apnea has on the rate of transitioning between the states. We emphasize that the rate of transitioning contains more important additional information than the crude percentage of time spent in each state. Notably, we use matching to account for other variables that might be related to both disease status and sleep behavior and hence compare a severely diseased group with a matched non-diseased group.
In the next section we give a brief overview of sleep measurement. Following that, we discuss an analysis of sleep transition rates comparing those with moderate to severe sleep apnea to those without. We end the article with a discussion.
2 Sleep measurement
The gold standard of sleep measurement is based on an overnight sleep study called a “polysomnogram.” During a polysomnogram, a patient has several physiologic recordings that are digitized and subsequently stored. Some of these recordings includes skull surface electroencephalograms, which measure the actual electrical activity from neurons firing. Because the EEG measures aggregate electrical activity in the cortex, they have poor spatial resolution; however, they have excellent temporal resolution, with hundreds of measurements per second.
Other physiologic recordings measure eye movement (an electro-oculogram), leg movement (electro-myogram), oxygen saturation (pulse-oximter), air flow, chin movement activity (electro-myogram), chest and abdominal movement (via belts around the torso), and heart rate and rhythm (electro-cardiogram). As such, a polysomogram produces an enormous amount of data, since each of these signals is recorded nearly continuously over a night of sleep. The signals are processed by trained technicians under the supervision of sleep physicians.
The technicians and sleep physicians distill this deluge of information to more manageable summaries. In clinical settings, these summaries are used to help patient care decisions. They are also used in research, to investigate the causes and consequences of sleep related phenomena. Table 1 lists examples of summaries of the polysomnogram as well as the Epworth Sleepiness Scale, a questionnaire based assessment of daytime sleep propensity.
Often a concern in sleep clinics is whether or not the subject has sleep apnea and, if so, to evaluate the severity of the disease. As previously mentioned, the primary measure of severity of sleep apnea is the number of apneas or hypopneas per hour slept
Another important summary splits the sleep pattern into a few distinct sleep states. This is done visually, by trained and certified technicians and physicians, by grouping the data into thirty second “epochs”. The states of interest are labeled: Wake, Stage I, Stage II, Stage III, Stage IV and REM. Stages I–IV are referred to as Non-REM sleep. Stages I and II represent light sleeping and encompass 3 – 8% and 44 – 55% of total sleep time, respectively. Stages III and IV represent deeper sleep and comprise about 15 – 20% of the total sleep time. In REM sleep, which compromises approximately 20 – 25% of total sleep time, the body is inactive while the brain manifests EEG patterns similar to wakefulness. As described by Chokroverty, most dreaming occurs in REM sleep.
A patient's “sleep architecture” is simply the person-specific percentage of time spent in each of the six states. Sleep architecture can vary between people and within a person as they age. For example, infants spend more than 80% of their sleeping time in REM. It is generally accepted that sleep staging is relevant for understanding sleep's effect on health. We are particularly interested in the impact of the rate of transitioning between the various sleep states. Note that it is not the case that a person necessarily transitions from wakefulness through Stages I to IV in sequential order, and then to REM. Instead, people pass through the states in cycles, with transitioning from any state to another both possible and likely to occur. Wakefulness to REM is the transition that occurs the least frequently.
In addition to measuring night-time sleep signals, other behavioral measurements can be very valuable in sleep research. One of the more widely used measures is the Epworth Sleepiness Scale. This is an aggregated score of several self administered questions involving sleep behavior, and is used as a measure of daytime sleep propensity. For example, patients are scored on whether or not they fall asleep when sitting and reading, or watching television.
3 Sleep transition rates
In this section we present some analysis from sleep transition rates from a large multi-center cohort study, the Sleep Heart Health Study (SHHS). The SHHS added to and combined data from large well established longitudinal studies: the Atherosclerosis Risk in Communities Study, the Cardiovascular Health Study, the Framingham Heart Study, the Strong Heart Study and the Tucson Health and Environment study. As described by Quan and colleagues, at enormous expense, the SHHS recruited over six thousand subjects from these studies to undergo an abbreviated in-home polysomogram. Roughly four thousand of these subjects repeated this process around four years later. The sleep data were processed by trained SHHS technicians, including rigorous data quality checks. The SHHS offers a unique data set to understand sleep and health. However, being an observational study, analysis of the data is often challenging. Any effects or absence of effects seen might be due to subtle biases from the sampling or from (measured or unmeasured) variables either unaccounted for or improperly accounted for in the analysis.
3.1 Matching
We consider now the relationship between sleep transitions and sleep apnea. Hence we compare a group of severely diseased patients with sleep apnea, as defined by an RDI greater than 22.3 events per hour, with a group of healthy controls having RDIs of less than 1.33 events per hour. The groups were chosen so that each subject in the diseased group had a matching subject in the control group. This process helps control for confounding variables, not unlike methods such as regression analysis. However matching, unlike regression adjustment, forces a discussion of how alike or unlike the diseased and control groups are. In contrast, regression adjustment will happily plod along via linearity assumptions, even if there is no overlap in the confounding variables for the diseased and control groups. However, matching is not without its issues. Most notably, the SHHS population being studied is a subset of the population selected originally for study; hence a matched subset may lack the generalizability of results on the original data.
Only a subset of the SHHS was eligible to be matched for our analysis. For example, to adequately define disease status, only those subjects with outstanding sleep recording quality and without any history of coronary heart disease, cardiovascular disease, hypertension, chronic obstructive pulmonary disease, asthma, or stroke were eligible. In addition, current smokers were also not considered. These rigid qualification standards narrowed down the original SHHS pool from over 6,000 to 183 diseased and 458 non-diseased subjects. These groups are not representative of the population, as conditions such as hypertension and cardiovascular disease commonly occur with sleep apnea. Hence, our “diseased” group is quite healthy in many aspects excepting the high index of sleep apnea disease severity.
The matching variables included body mass index (BMI, a ratio a subjects weight to the square of their height), age, race, and sex. Exact matching was used for race and sex, whereas BMI and age were matched within a caliper (i.e. matched within an acceptable range). The matching procedure produced 60 pairs. Apart from body mass index, none of the variables were significantly different (using Student's T test and chi-square tests at the 5% level) when comparing the two groups. Although concern exists about the differential body mass indices, we note that obesity is the primary cause of sleep apnea and both the diseased and control groups, though having statistical different BMIs, were similar practically. Specifically, the average body mass indices for the diseased group was 30.7 Kg/m2, whereas it was 29.2 Kg/m2 for the non-diseased.
Of note is that traditional sleep architecture - though not considered for a matching parameter - was not statistically different between groups. This implies that this gold standard measurement summary of sleep states may not be affected by sleep apnea. Using this fact, we now consider how frequently the subjects transition between the various states.
Figure 1 displays the time series for the six sleep states for a single subject; such a plot is called a “hypnogram”. Figure 2 displays a plot comparing the 60 diseased and 60 matched control subjects. In this plot, each gray-scale point corresponds to a different transition type, the horizontal index is time in hours, and the vertical index is subject. This plot simultaneously displays the information of many hypnograms. As discussed in Swihart and colleagues, this plot and variations highlight the higher rate of transitioning occurring in the diseased group.
Figure 1.

Hypnogram plot for a single subject. The left plot shows the full night whereas the right plot highlights sleep between the second and third hours.
Figure 2.

Transition plots for the sixty diseased (apneic) and matched control subjects. Gray-scale points represent transitions where. The key is such that N represents non-REM, R represents REM and W represents wake. Hence, NR represents non-REM to REM, RW represents REM to wakefulness, and so on.
3.2 Analysis of sleep transition rates
We restrict ourselves to studying the transitions starting at the first transition from wakefulness to sleep (usually to Stage 1) and ending at the last transition from a sleep state to wakefulness. That is, we discard time before sleep onset and after waking up. We note that the initial time in bed before sleep onset (sleep latency) between the matched pairs showed no difference (Student's t-test P-value of 0.70).
Figure 3 shows mean/difference plots for the log base two of the transition rates for the matched pairs. By a transition, we mean a change from any sleep state to another; hence the transition rate is the number of changes divided by the total time asleep in hours. Such plots highlight whether there is a difference between the two matched groups, whereas plotting against the average highlights whether any such difference is dependent on the magnitude of the transition rates. Log base two is used simply to work with ratios and because powers of two are easier to work with than powers of Euler's number, e, and represent smaller increments than the other option of using base 10.
Figure 3.
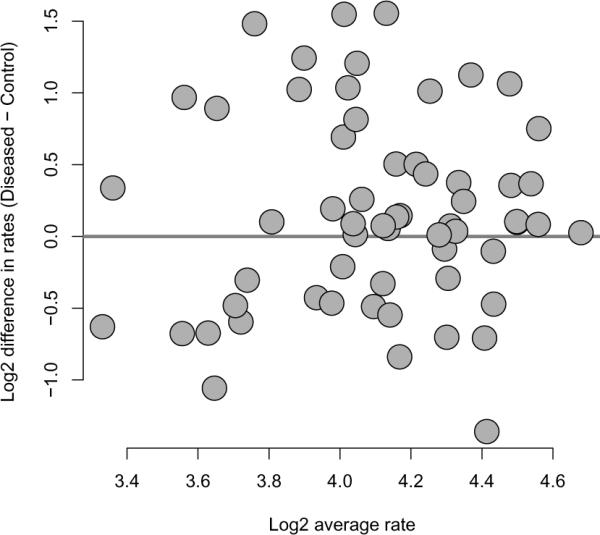
Mean/difference plot of log base two of transition rates with diseased minus matched controls on the vertical axis and pair-wise average log base two transition rates on the horizontal axis.
Recall that the transition rate is defined as the number of transitions per hour of sleep. We note that a reasonable discussion could be had on which of the two measures, the transition rate or the raw number of transitions, is more important. It may be that a certain raw number of transitions is important for health, regardless of the rate. However, clearly a person who sleeps longer has more opportunities to transition between states, suggesting the use of rates. Regardless, we focus only on the analysis of the rates. Further analysis of the rates and transition numbers is presented in the paper by Swihart and colleagues. In Figure 3, 39 of the 60 observations lie above the horizontal line, potentially indicating that diseased subjects transition more frequently than non-diseased. For example, under a null hypothesis of no difference in transition rates between the diseased and non-diseased groups, the binomial probability of 39 or more pairs out of 60 lying above the horizontal line is only .014 (the two sided P-value would double this number).
A useful summary of each subject's data would be a three-by-three table that displays counts of their previous sleep state by their current sleep state. Table 2 displays the combination of such summary tables across subjects, with the non-REM sleeping states (Stages I–IV) aggregated. Shown are counts of the previous state by the current state, cross-classified by disease status. Transition counts occur in the off-diagonal cells, with the diagonal cells representing instances where the subjects stayed in the same state from one epoch to the next. For example, in the diseased subjects, there were 346 transitions from non-REM (N) to REM (R), whereas there were 175 transitions from wake (W) to REM. Column totals in this data are special, representing the time at-risk for various kinds of transitions. The column totals, which are counts of epochs, are converted into hours for convenience. Therefore, there were 346 transitions of type N → R, and there were 281.78 total hours spent in non-REM where this type of transition could be made.
Table 2.
Disease and control counts of transitions. The columns denote the previous sleep state whereas the rows denote the current. The times in state are measured in thirty second “epochs”. Column totals gives the total epochs in each state, which are converted to hours for convenience.
| Previous state | ||||||
|---|---|---|---|---|---|---|
| Disease | Controls | |||||
| Current state | N | R | W | N | R | W |
| Non-REM (N) | 31,880 | 160 | 1,733 | 32,592 | 134 | 1,376 |
| REM (R) | 346 | 7,609 | 175 | 351 | 8,784 | 114 |
| Wake (W) | 1,588 | 358 | 6,079 | 1,210 | 324 | 5,775 |
| Total epochs | 33,814 | 8,127 | 7,987 | 34,153 | 9,242 | 7,265 |
| Total in hours | 281.78 | 67.73 | 66.56 | 284.61 | 77.02 | 60.54 |
The most frequent transition in both groups is W → N, with rates of 1,733/66.56 = 26.0 and 1,376/60.54 = 22.7, transitions per hour respectively. The next most frequent transitions are N → W and R → W. The data paint a picture that a person, diseased or not, spends the majority of their time in the non-REM state. From there, they often transition to REM, but then spend a little time in REM before transitioning to wakefulness (more likely) or back to non-REM (less likely). In addition, from non-REM, they often briefly wake up, then transition (more likely) back to non-REM.
It is of interest to compare whether these rates differ across disease groups. This is a somewhat challenging task, given that one must account for the correlation induced by matching as well as the correlation of the various rates within a particular subject. For example, in a subject with a high rate of non-REM to wake transitions, it is reasonable to believe that there would be a correspondingly high rate of wake to non-REM transitions; hence these two rates would be correlated. We fit a model that assumes a constant rate of transitioning over the time at-risk for transitioning, a so-called exponential hazard model, accounting for these kinds of correlations. We will relegate a more careful exploration of these data and the model to later work, but we present some of the initial results below.
Table 3 shows the estimated relative rates, i.e. the estimated rate of transitioning for the diseased divided by that of the controls, and 95% credible interval. A credible interval is a Bayesian analog to the confidence interval; readers unfamiliar with Bayesian analysis can simply think of them as confidence intervals. The data suggest that the rate of transitioning from non-REM to wakefulness, REM to non-REM, and REM to wakefulness all differ between the two groups. Notably, all of the estimates represent increases in the transition rates for the diseased subjects. This suggests that the disruption of sleep continuity in responses to the airway collapses during sleep may cause increased transitions between wakefulness and the other states.
Table 3.
Relative rates comparing diseased (numerator) to non-diseased (denominator) subjects.
| Transition Type | Relative Rate | |
|---|---|---|
| N → R | 1.04 | [0.84, 1.29] |
| N → W | 1.39 | [1.17, 1.65] |
| R → N | 1.46 | [1.11, 1.93] |
| R → W | 1.34 | [1.08, 1.67] |
| W → N | 1.04 | [0.87, 1.22] |
| W → R | 1.27 | [0.95, 1.68] |
4 Discussion
In this manuscript, we briefly reviewed an area of observational sleep research with a particular emphasis to analyzing sleep transitions and their relationship with sleep apnea. The analysis showed some potential differences between the diseased and non-diseased group with respect to the amount of transitioning; though significant work remains to be done to fully understand this problem. Especially, it is important to consider how the transition rates differ over the night, relaxing the assumptions of the exponential model we presumed, improving the matching algorithm and applying the methods to the large, unmatched data using other adjustments. Hence, the study presented herein represents a small snippet of understanding of how sleep is influenced by a specific disease.
We emphasize, however, that the overarching focus of our research, is to better exploit the full information contained in polysomnograms from large-scale observational studies of sleep. This includes functional data analysis of the sleep state and EEG signals. We believe that there is important information omitted by only considering the standard epidemiological summaries, which in most cases were designed as simple clinical indices and hence may be improved upon for research purposes. This point is driven home by the example considered in this paper, where several relevant differences in sleep transition behavior were illustrated between a diseased and non-diseased group, while the standard index of sleep staging showed none.
5 Further reading
The book by Chokroverty contains an excellent summary of sleep medicine. The manuscripts by Swihart et al. provide introductions to the display and analysis of sleep transitions. The article by Young et al. gives an overview of sleep disordered breathing.
- Chokroverty S. Sleep disorders medicine: basic science, technical considerations, and clinical aspects. Butterworth-Heinemann Boston, MA: 1999. [Google Scholar]
- Quan S, Howard B, Iber C, Kiley J, Nieto F, O'Connor G, Rapoport D, Redline S, Robbins J, Samet J, et al. The Sleep Heart Health Study: design, rationale, and methods. Sleep. 1997;20(12):107785. [PubMed] [Google Scholar]
- Swihart B, Caffo B, Bandeen-Roche K, Punjabi N. Quantitative characterization of sleep architecture using multi-state and log-linear models. Journal of Clinical Sleep Medicine. 2008;4(4):349–355. [PMC free article] [PubMed] [Google Scholar]
- Swihart B, Caffo B, Strand M, Punjabi N. Johns Hopkins University, Dept. of Biostatistics Working Papers. 2007. Novel Methods in the Visualization of Transitional Phenomena. [Google Scholar]
- Young T, Peppard P, Gottlieb D. Epidemiology of Obstructive Sleep Apnea. A Population Health Perspective. American Journal of Respiratory and Critical Care Medicine. 2002;165(9):1217–1239. doi: 10.1164/rccm.2109080. [DOI] [PubMed] [Google Scholar]